. 2020 Dec 8;16(12):7852-7865.
doi: 10.1021/acs.jctc.0c00739. Epub 2020 Nov 4.

Diversity of Long-Lived Intermediates along the Binding Pathway of Imatinib to Abl Kinase Revealed by MD Simulations

Affiliations

Diversity of Long-Lived Intermediates along the Binding Pathway of Imatinib to Abl Kinase Revealed by MD Simulations

Fabian Paul et al. J Chem Theory Comput. .

Abstract

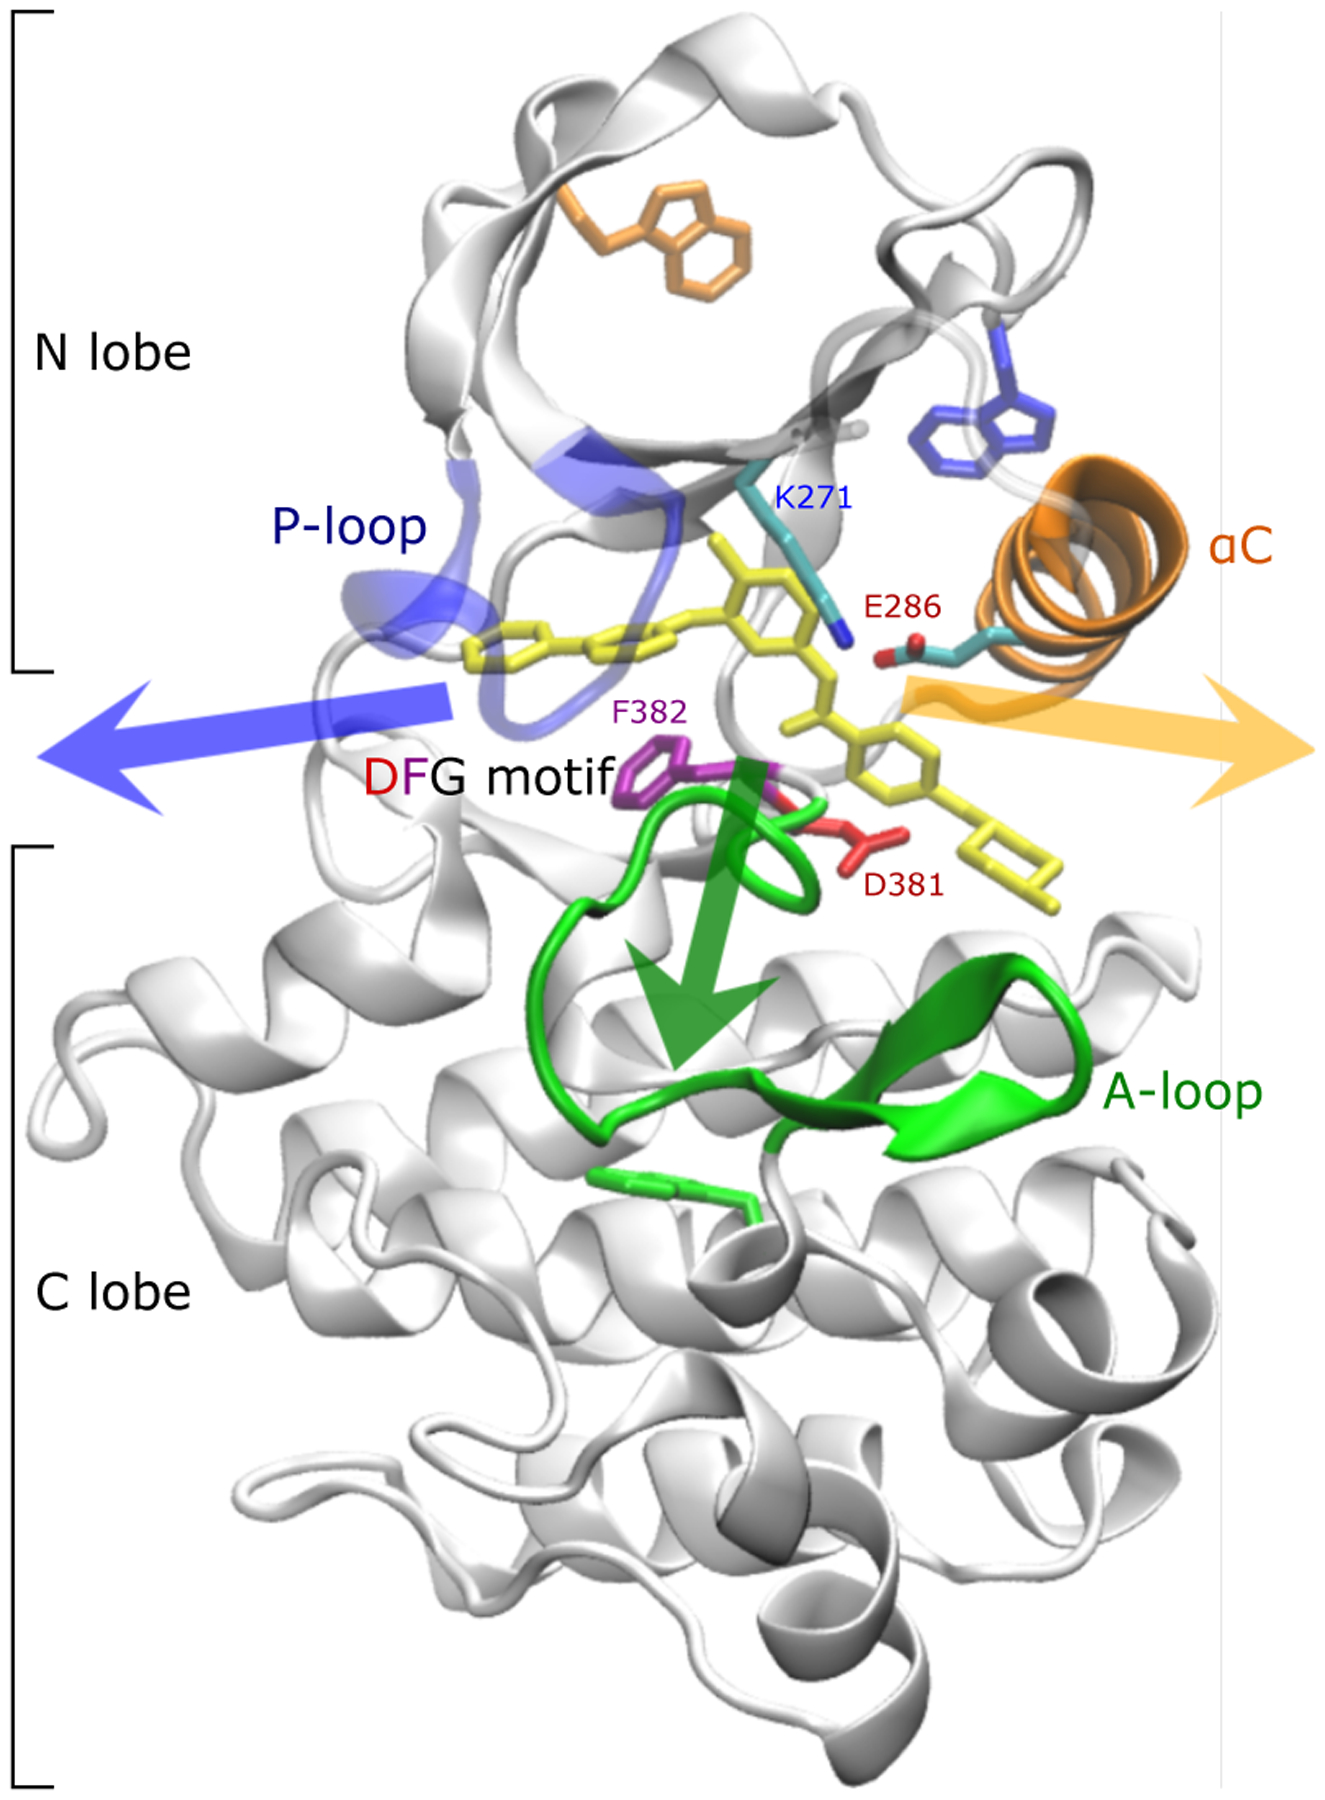
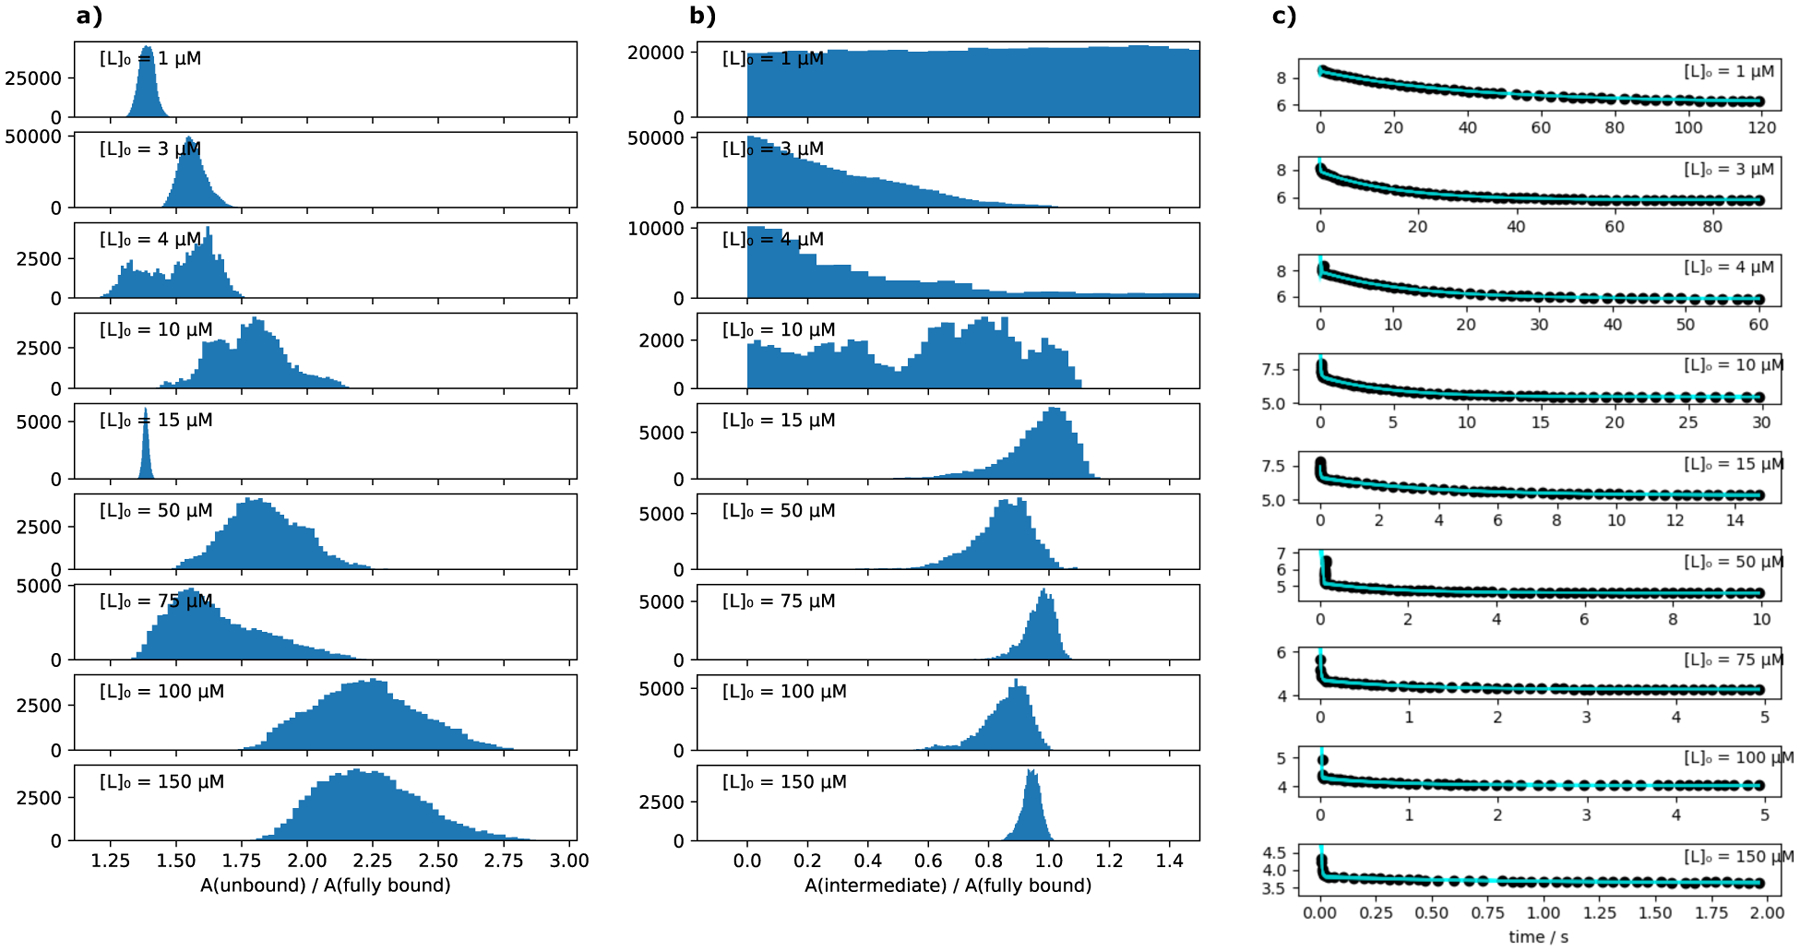
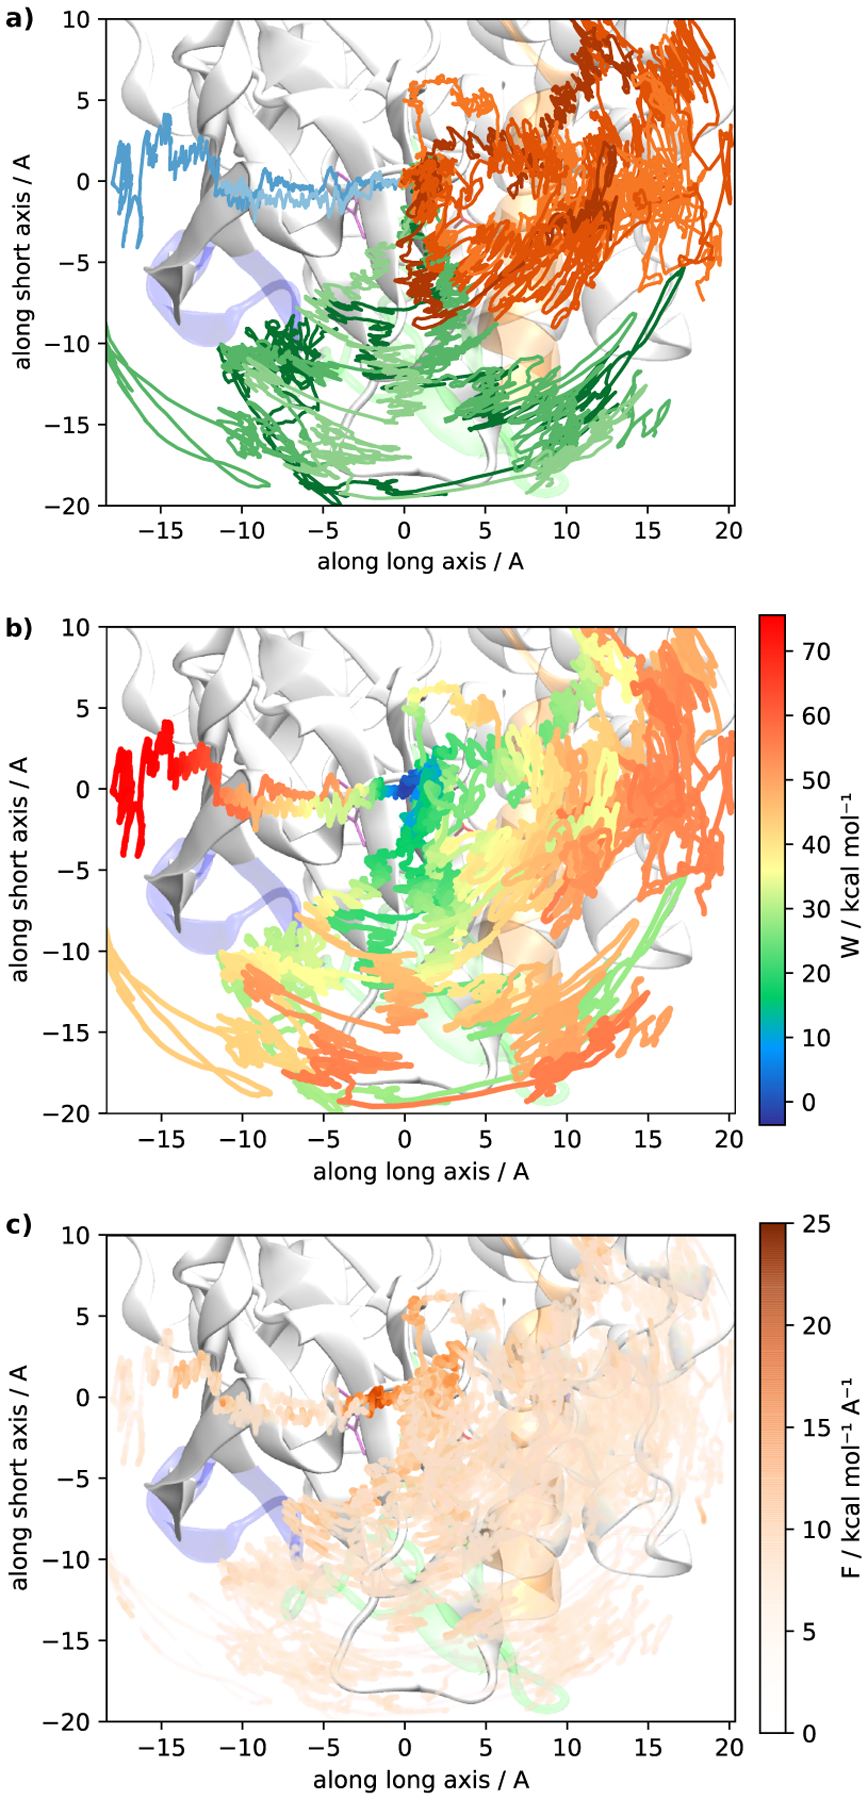
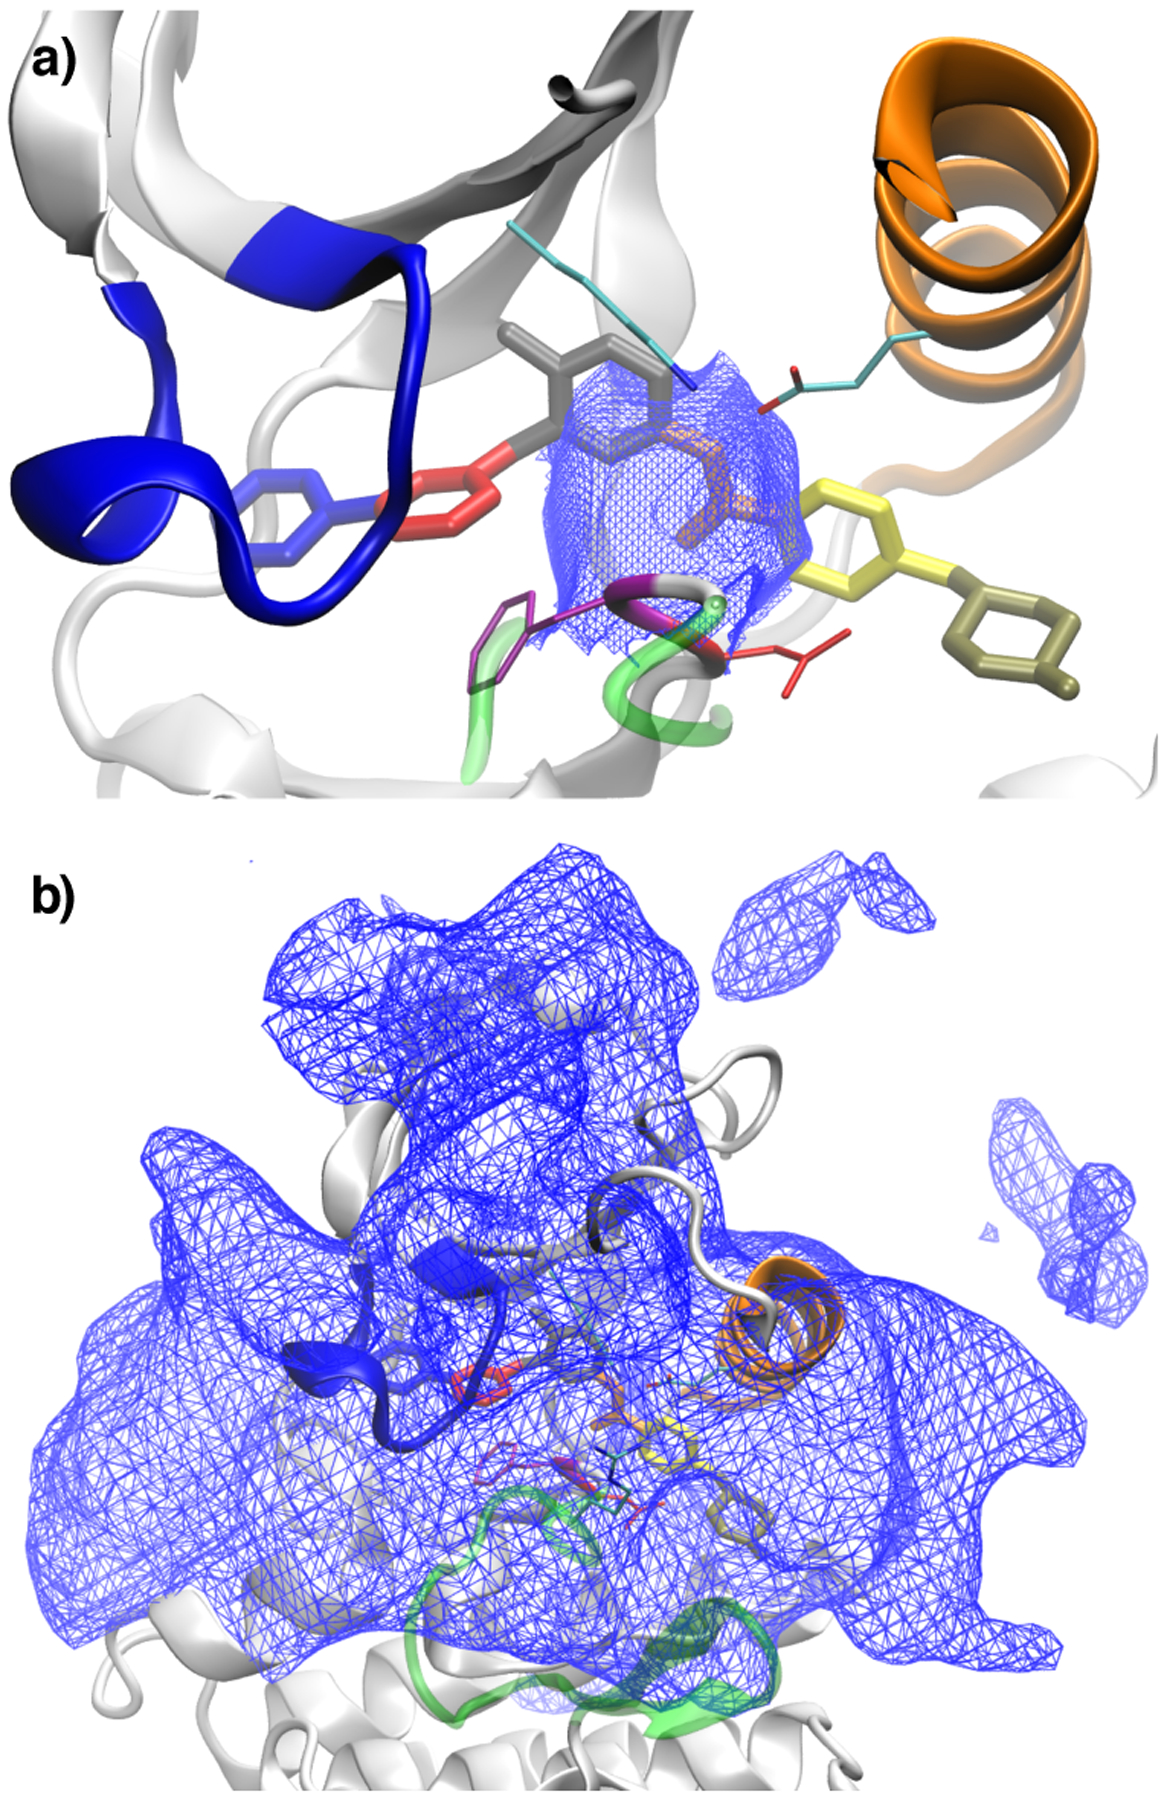
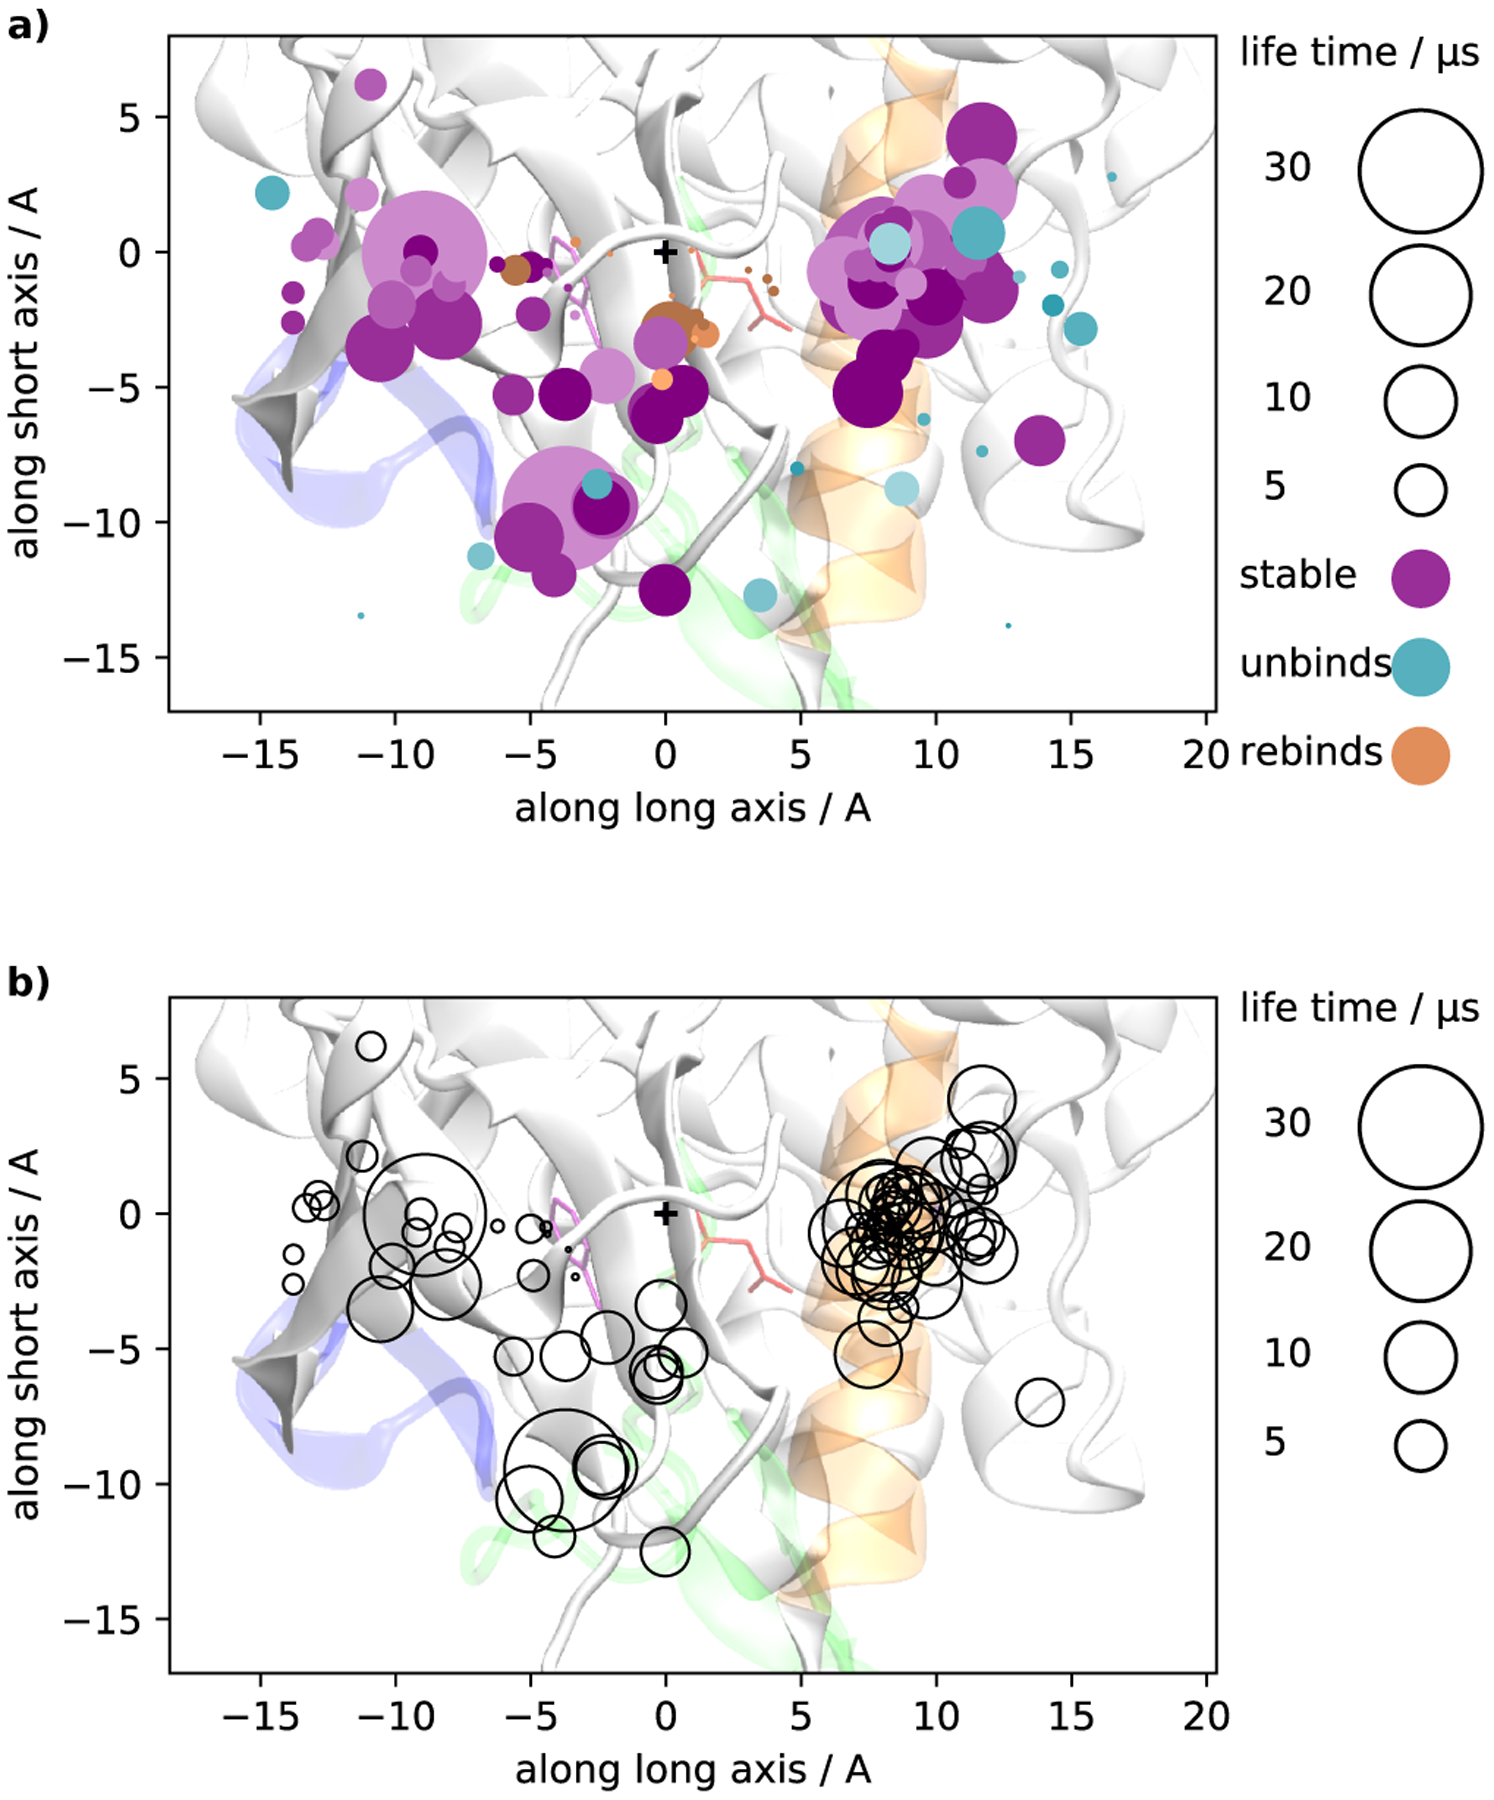
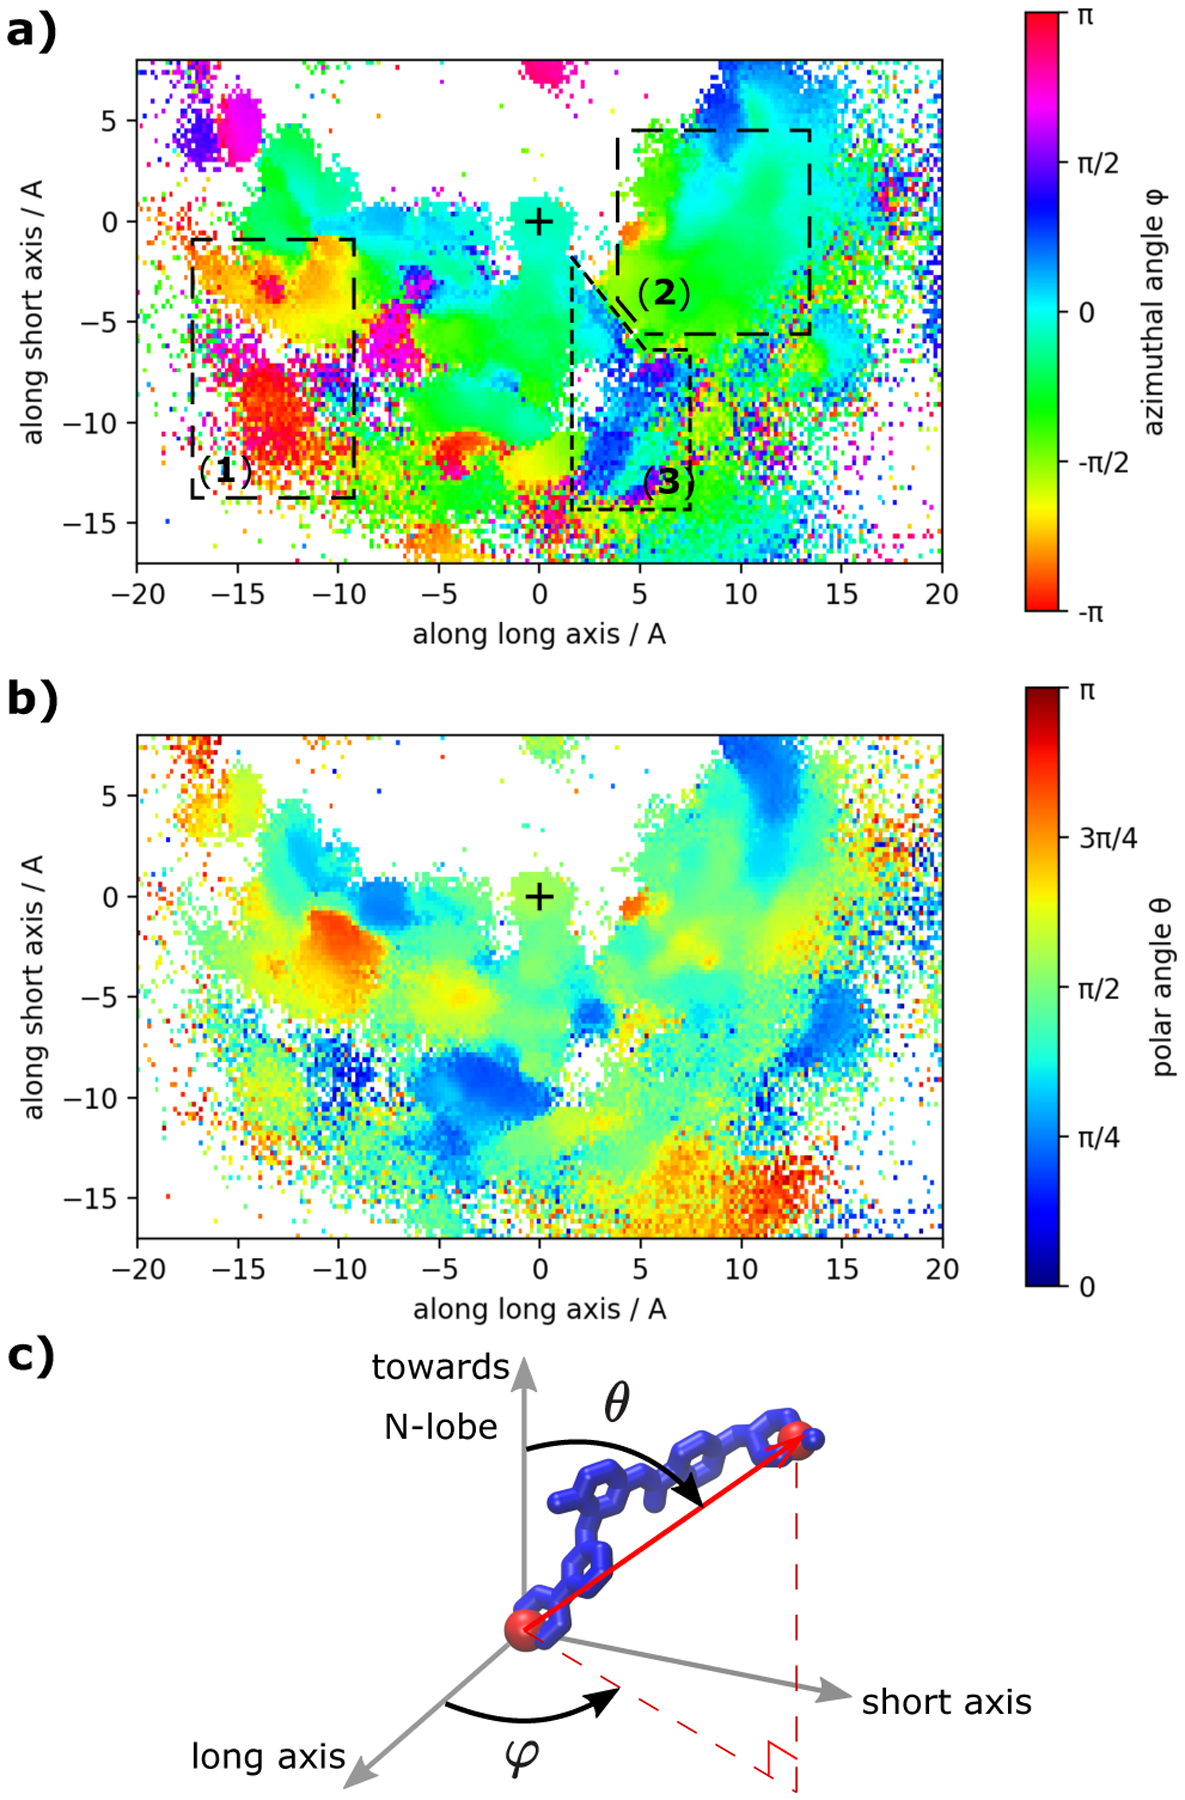
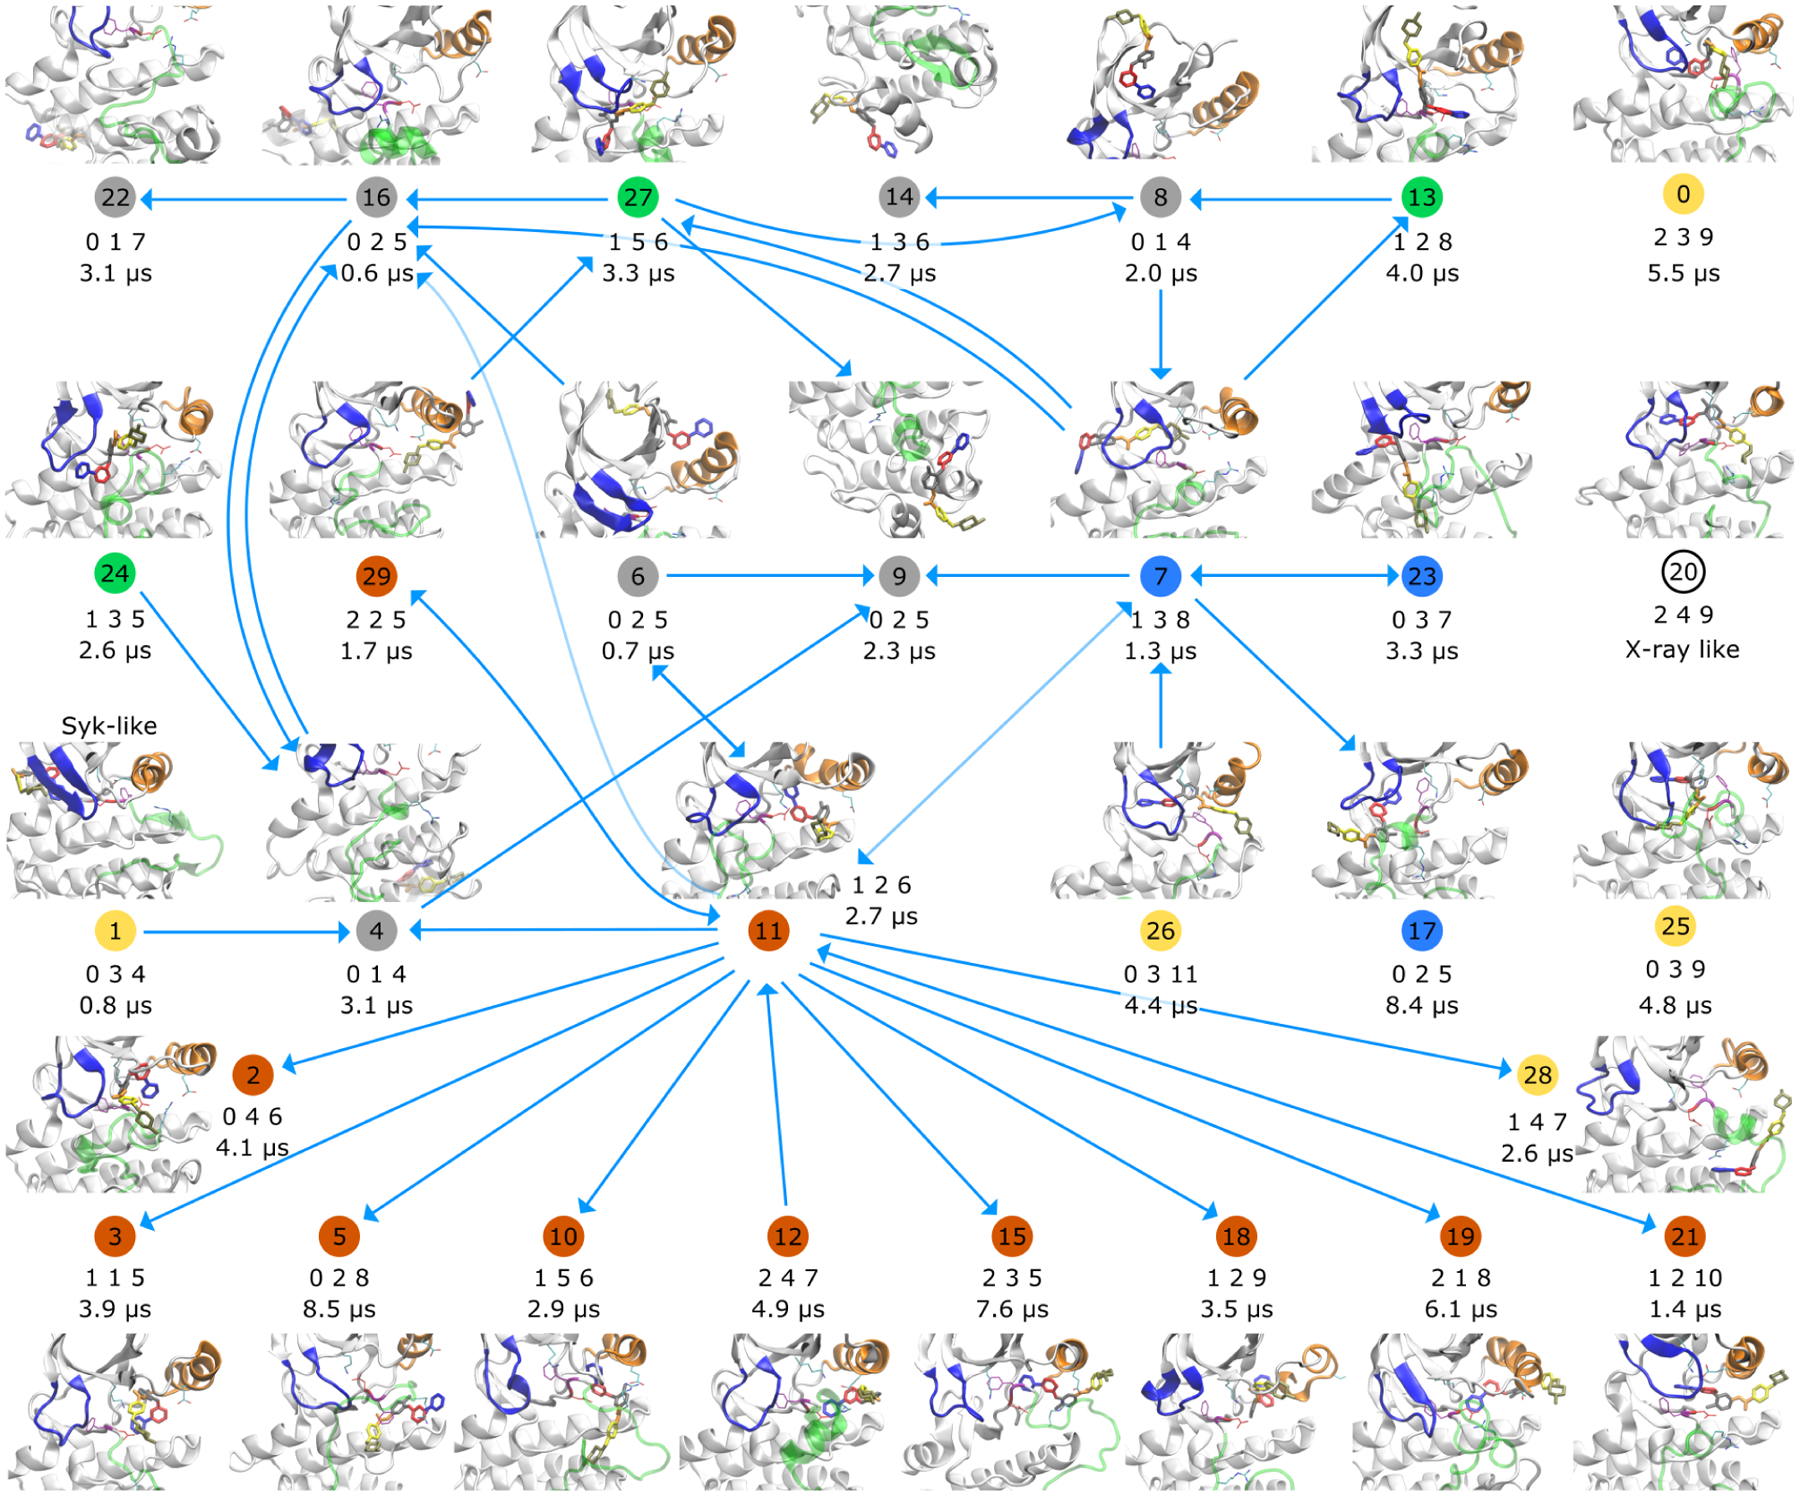
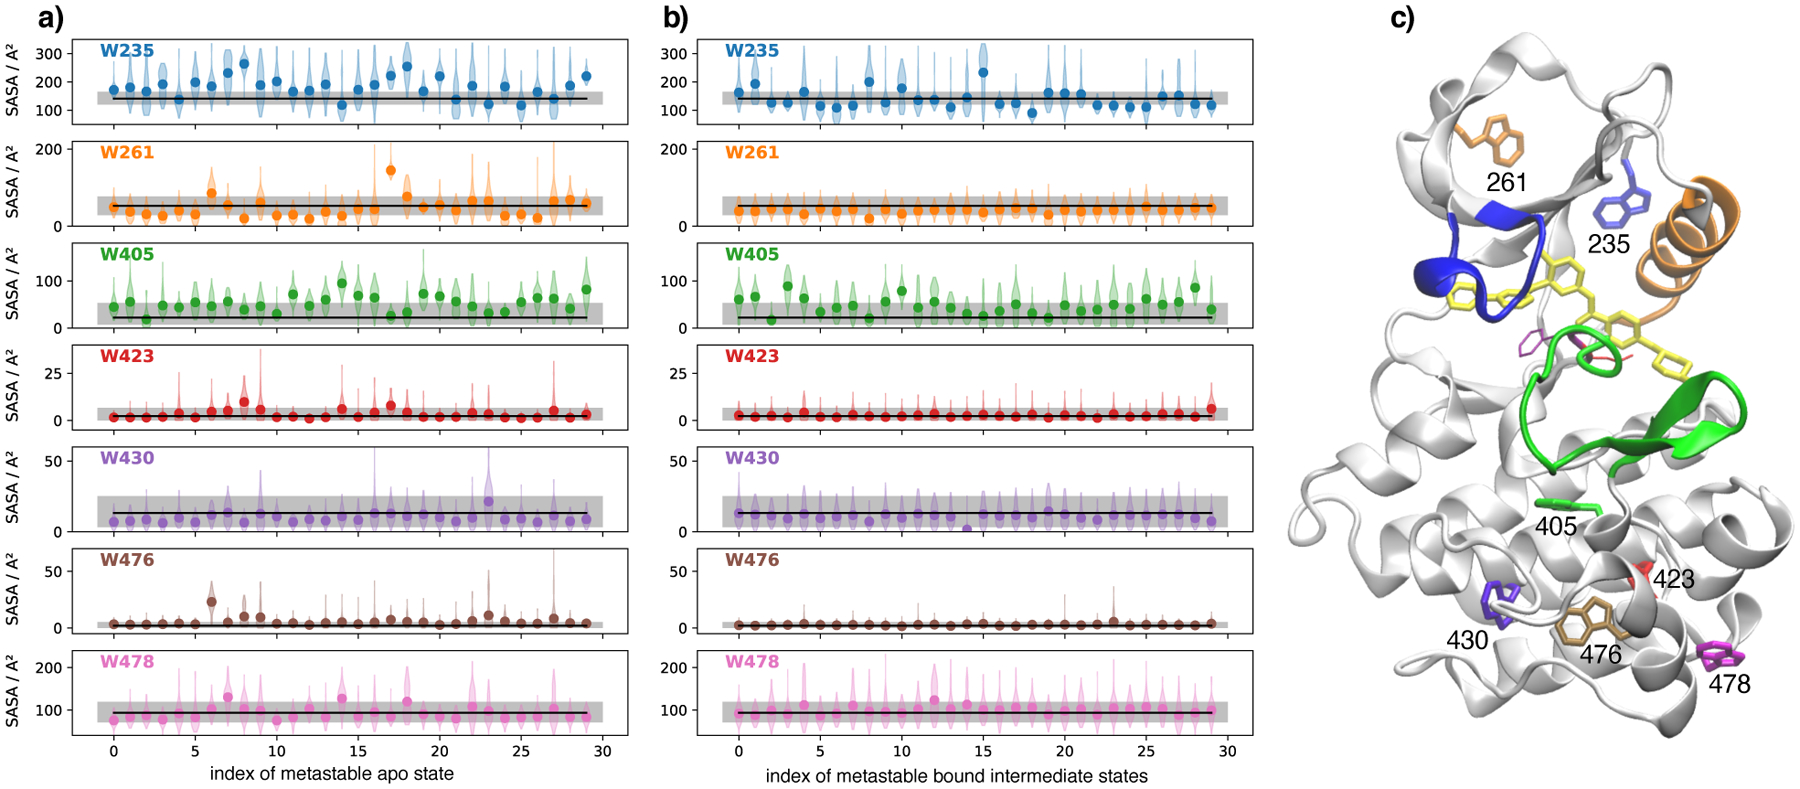
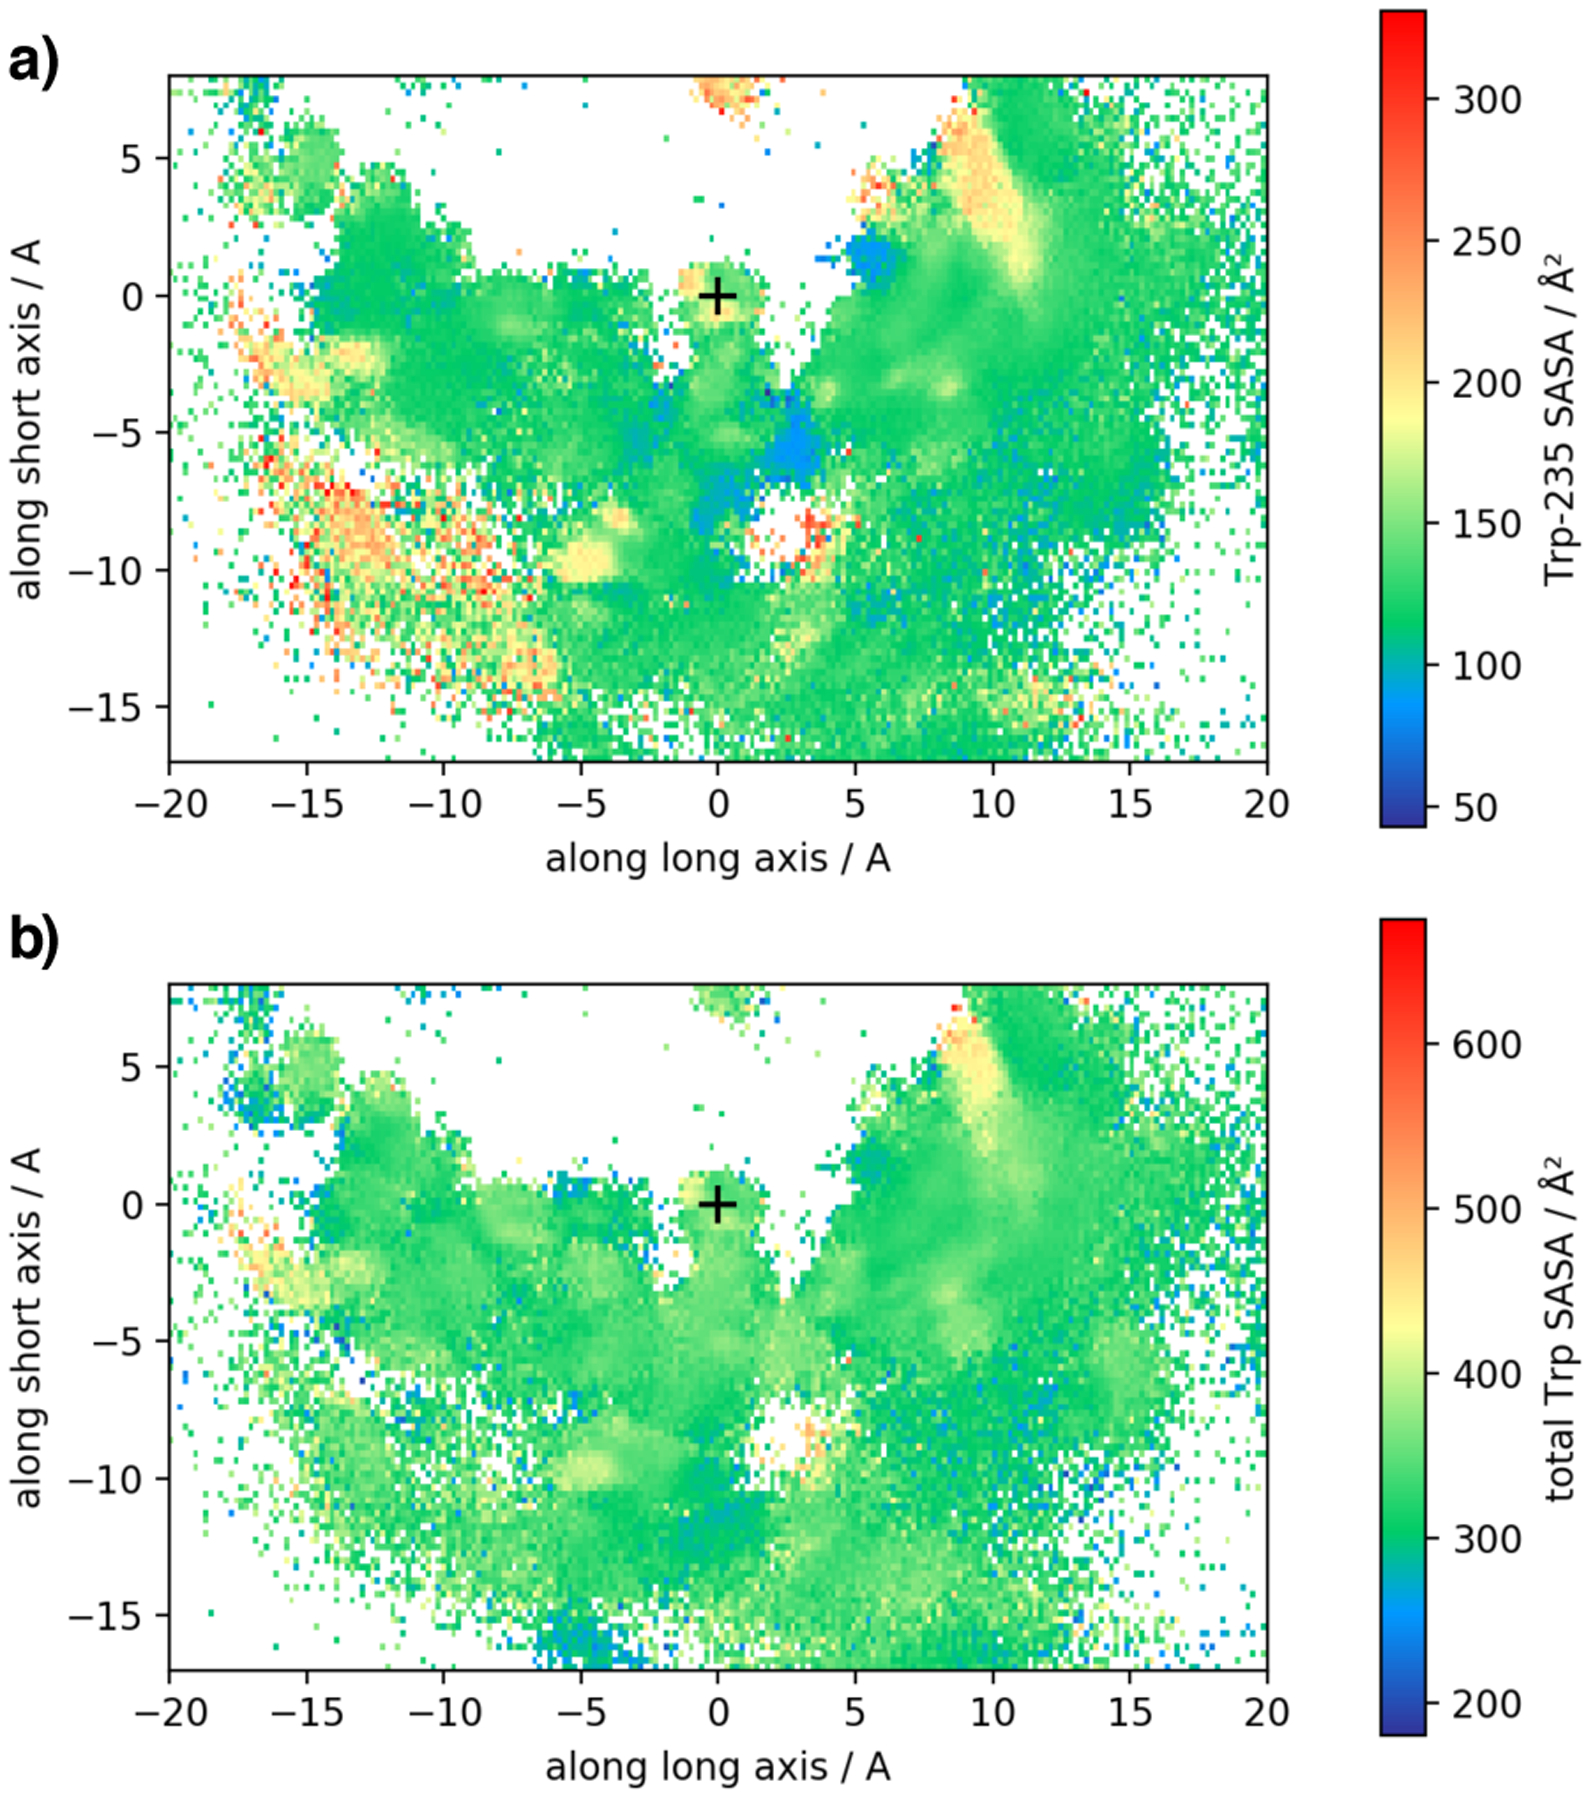
Imatinib, a drug used for the treatment of chronic myeloid leukemia and other cancers, works by blocking the catalytic site of pathological constitutively active Abl kinase. While the binding pose is known from X-ray crystallography, the different steps leading to the formation of the complex are not well understood. The results from extensive molecular dynamics simulations show that imatinib can primarily exit the known crystallographic binding pose through the cleft of the binding site or by sliding under the αC helix. Once displaced from the crystallographic binding pose, imatinib becomes trapped in intermediate states. These intermediates are characterized by a high diversity of ligand orientations and conformations, and relaxation timescales within this region may exceed 3-4 ms. Analysis indicates that the metastable intermediate states should be spectroscopically indistinguishable from the crystallographic binding pose, in agreement with tryptophan stopped-flow fluorescence experiments.


Figures

Figure 1:
Figure 1:
Crystallographic binding mode: imatinib (yellow) bound to the catalytic domain of Abl kinase (pdb id 1IEP). The phosphate-positioning loop or P-loop (blue) as well as salt bridges between the activation loop or A-loop (green) and bf αC helix (orange) cover the binding tunnel at the front. The DFG motif is shown with sticks. Salt bridges involve Asp381 in the DFG motif, Arg386 in the A-loop, Glu286 in the αC helix, and Lys271. The so-called “hydrophobic pocket” is located between the αC helix and the β-sheets in the N-lobe. Tryptophan residues used to monitor the kinetics of binding in fluorescence experiments are shown as sticks. The three arrows indicate the general direction in which imatinib can leave the binding site. In the following, the orange and green arrows are referred to as the long and short axis, respectively.
Figure 2:
Figure 2:
Illustration of variational approach for conformation dynamics: different functions that live in the conformational space are proposed (see (a) for good a example and (b) for a bad example). Functions are ranked by comparing the function’s value at the beginning of time propagation (top row) to the value at the end of the propagation (bottom row).
Figure 3:
Figure 3:
Results of a re-analysis of the tryptophan fluorescence stopped flow data from Agafonov et al. (a) shows in the form of histograms all values of AU/AX that are compatible with the experimental data from Agafonov et al. and contains multiple time traces that were measured at different ligand concentrations [L]0. We fit each time trace individually (see Modeling tryptophan fluorescence quenching in Theory and Methods for details). (b) shows the corresponding histograms for AI/AX. (c) shows the corresponding ensembles of fits to the data (all possible model curves that are compatible with the data).
Figure 4:
Figure 4:
Motion of the center of mass (COM) of the imatinib ligand during the pulling simulations. All three plots show the projection of the COM onto a plane that separates the N and C lobes of the Abl kinase domain along two main directions are referred to as a long and short axis (these two directions corresponding roughly the orange and green arrows in Figure 1, respectively). a) One can discern three clusters of pathways: trajectories where imatinib exits under the αC helix (orange), trajectories where imatinib exits through the cleft (green) and exit in the direction of the P-loop (blue). Blue trajectories were produced with directed pulling while the other trajectories were produced with undirected pulling and imatinib chose the pathway spontaneously. Trajectories were smoothed with a moving average filter with 1 ns window length. The colors in (b) represent the non-equilibrium work at every point along the pulling trajectories. Work was averaged along the path using the same moving average filter (1 ns or 6.25 · 10−2 Å) as the COM positions. (c) shows the pulling force (averaged with the same filter).
Figure 5:
Figure 5:
Dividing surfaces in (imatinib) center-of-mass feature space between different classes of trajectories: (a) shows the surface between trajectories that rebind to the crystallographic mode and trajectories that are trapped in intermediate states; (b) shows the dividing surface between trajectories trapped in intermediate states and trajectories that lead to full dissociation. The protein and ligand conformation shown in both figures corresponds to the crystal structure 2HYY. The two surfaces in (a) and (b) delineate the rugged and complex intermediate region of Abl kinase where are located several non-specific long-lived associated states of imatinib. See Theory and Method for additional details on how the surfaces were generated.
Figure 6:
Figure 6:
Committor-like analysis reporting the position of imatinib’s center of mass (COM) averaged over the length of each unbiased trajectory. The figure shows the projection of the COM onto a plane that separates the N and C lobes of the Abl kinase domain (same projection as in Figure 4). The plus symbol (+) marks the COM position of the crystallographic bound state. a) Colors indicate the fate of each trajectory: trajectories that reach the fully dissociated state are represented with a cyan disc. Trajectories that reach the X-ray pose are represented with orange discs. All other trajectories are shown as purple discs. Disc sizes represent the time to dissociation or rebinding to the X-ray pose for cyan and orange discs, respectively. In the trajectories that rebind to the X-ray pose, the rebinding time is very short compared to all other processes, therefore the orange discs in (a) are rendered with an area that is magnified by a factor of 10. For purple discs, size corresponds to trajectory length. b) Same as panel (a) showing only the trapped trajectories but without color.
Figure 7:
Figure 7:
Orientation of imatinib in the different binding poses. In (a) and (b) we visualize the azimuthal angle ϕ and the polar angle θ respectively of the vector through atoms C8 and N36 that are located at opposite ends of imatinib (red spheres in c). The coordinate system is fixed with respect to the protein and is identical to the system used in Figures. 4, 6). The X-ray like pose is characterized by ϕ ≈ 0 and θπ/2. The symbol + marks the location of imatinib’s COM in the crystallographic state (similar to pdb id 1HYY). The three main regions are indicated in panel (a).
Figure 8:
Figure 8:
Kinetic network summarizing the unbiased MD simulation data of the Abl-imatinib system. Representative conformations are shown for 30 metastable states, that were identified with a VAMPnet. States that are connected by a transition in the unbiased simulations are connected with an arrow in this plot. Circled numbers below the conformations are the state labels. The color of the disc encodes the broad category of imatinib binding: in orange states imatinib is bound in the hydrophobic pocket; in blue states imatinib is bound under the P-loop; in green states imatinib is bound in front of the cleft; yellow states are DFG-in; in gray states imatinib binds on the surface of Abl. The triple of integers below the state number consists of the number of salt bridges, hydrogen bonds and hydrophobic interactions (in that order) between imatinib and Abl as computed with PLIP. Below that, lifetimes or lower bounds on the lifetimes are reported in microseconds. For states that have an outgoing arrow that number is an estimate of the lifetime, otherwise it is a lower bound. Some connections between states (arrows) might be artifacts of the analysis, where VAMP might have merged conformations that should have been separated into different states. See Details of VAMPnet analysis in Theory and Methods for additional information. Magnified versions of all structures are shown in Suppl. Figs. 12 and 13.
Figure 9:
Figure 9:
Solvent accessible surface area (SASA) for each tryptophan residue. In (a) Trp-SASA is reported for the 30 metastable states of apo-Abl as defined in Paul et al.. In (b) the Trp-SASA is shown for each of the 30 metastable states of the Abl-imatinib complex that is studied in the current work. Distribution of the tryptophan SASA within each metastable state is show as a violin plot. Discs mark the means. The black line marks the mean Trp-SASA in a long simulation (1.6 μs) of the Abl-imatinib system started from crystal structure 2HYY. The gray shaded area marks the region between the 5th and 95th percentile of Trp-SASA computed from the same simulation of the crystal structure. (c) shows imatinib-bound Abl with all tryptophan residues labeled.
Figure 10:
Figure 10:
Trp-SASA depending on imatinib location computed from all unbiased trajectories. The coordinates are the same as in Figures 4,6 (imatinib COM in a coordinate system that is fixed w.r.t the protein. The plus (+) symbol marks the location of imatinib’s COM in the crystallographic state. (a) shows the SASA of Trp-235 that is located in the flexible N-terminal liker of the kinase domain. (b) shows the total SASA of all tryptophan side chain in the simulated construct. In agreement with experiment, Trp-SASA does not vary much as the binding pose of imatinib changes.

Similar articles

Cited by

References

    1. Druker BJ; Tamura S; Buchdunger E; Ohno S; Segal GM; Fanning S; Zimmermann J; Lydon NB Effects of a selective inhibitor of the Abl tyrosine kinase on the growth of Bcr-Abl positive cells. Nat. Med 1996, 2, 561–566. - PubMed
    1. Mauro MJ; Druker BJ STI571: targeting BCR-Abl as therapy for CML. Oncologist 2001, 6, 233–238. - PubMed
    1. Melo J The diversity of BCR-ABL fusion proteins and their relationship to leukemia phenotype. Blood 1996, 88, 2375–2384. - PubMed
    1. Nagar B; Bornmann WG; Pellicena P; Schindler T; Veach DR; Miller WT; Clarkson B; Kuriyan J Crystal Structures of the Kinase Domain of c-Abl in Complex with the Small Molecule Inhibitors PD173955 and Imatinib (STI-571). Cancer Res. 2002, 62, 4236–4243. - PubMed
    1. Roskoski R A historical overview of protein kinases and their targeted small molecule inhibitors. Pharmacol. Res 2015, 100, 1–23. - PubMed

MeSH terms

LinkOut - more resources