. 2021 Jul;55(7):821-829.
doi: 10.1177/1060028020970518. Epub 2020 Nov 4.

Economic Burden of Osteoporosis-Related Fractures in the US Medicare Population

Affiliations

Economic Burden of Osteoporosis-Related Fractures in the US Medicare Population

Setareh A Williams et al. Ann Pharmacother. 2021 Jul.

Abstract

Background: Osteoporosis-related fractures are an important public health burden.

Objective: To examine health care costs in Medicare patients with an osteoporosis-related fracture.

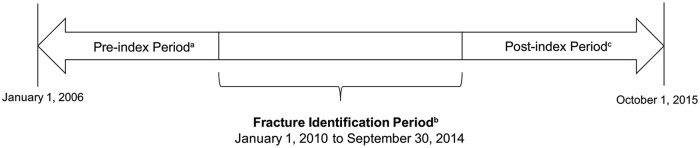
Methods: Medicare fee-for-service members with an osteoporosis-related fracture between January 1, 2010, to September 30, 2014 were included. A nonfracture comparator group was selected by propensity score matching. Generalized linear models using a gamma distribution were used to compare costs between fracture and nonfracture cohorts.

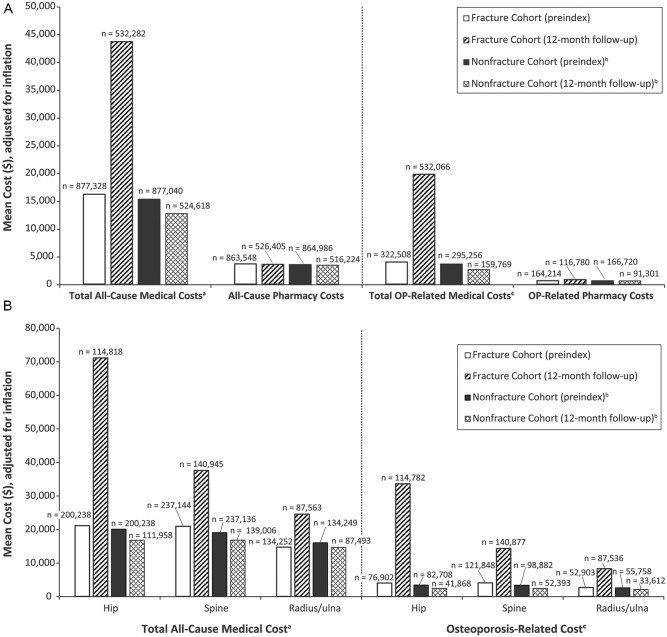
Results: A total of 885 676 Medicare beneficiaries had fracture(s) and met inclusion criteria. Average age was 80.5 (±8.4) years; 91% were White, and 94% female. Mean all-cause costs were greater in the fracture vs nonfracture cohort ($47 163.25 vs $16 034.61) overall and for men ($52 273.79 vs $17 352.68). The highest mean costs were for skilled nursing facility ($29 216), inpatient costs ($24 190.19), and hospice care ($20 996.83). The highest incremental costs versus the nonfracture cohort were for hip ($71 057.83 vs $16 807.74), spine ($37 543.87 vs $16 860.49), and radius/ulna ($24 505.27 vs $14 673.86). Total medical and pharmacy costs for patients who experienced a second fracture were higher compared with those who did not ($78 137.59 vs $44 467.47). Proportionally more patients in the fracture versus nonfracture cohort died (18% vs 9.3%), with higher death rates among men (20% vs 11%).

Conclusion and relevance: The current findings suggest a significant economic burden associated with fractures. Early identification and treatment of patients at high risk for fractures is of paramount importance for secondary prevention and reduced mortality.

Keywords: Medicare; cost; fracture; male; osteoporosis.


Conflict of interest statement

Declaration of Conflicting Interests: The authors declared the following potential conflicts of interest with respect to the research, authorship, and/or publication of this article: SAW, RW, and YW are employees of and own equity stock in Radius Health, Inc; SGD and TA are employees of the School of Public Health (UABMC), which received funding from Radius Health, Inc, for this work; JRC is a consultant for Radius Health, Inc, and Amgen; his institution (UABMC) received grants from Amgen, Lilly, and Radius Health, Inc.

Figures

Figure 1.
Figure 1.
Study design. a The preindex date is ≥1 year prior to index date (as early as January 1, 2006, for some patients) and is not the same for all patients. b Index date (date of fracture or comparable start of follow-up in the nonfracture cohort) could occur any time between January 1, 2010, and September 30, 2014, and is not the same for all patients. c Postindex period (follow-up time after index fracture or comparable start of follow-up in the nonfracture cohort) spans from the day after the index date up to 12 months postindex and is not the same for all patients.
Figure 2.
Figure 2.
Health care resource utilization, percentage of patients: A. Health care costs by cohort (preindex and 12-month follow-up). B. All-cause and osteoporosis-related cost by fracture type. Abbreviations: OP, Osteoporosis. a Total medical costs include carrier, durable medical equipment, home health, hospice, inpatient, outpatient, and skilled nursing facility. b The nonfracture cohort was selected by 1:1 propensity score matching for each index year during the identification period. c Costs were classified as osteoporosis-related if there was a diagnosis of osteoporosis or fracture in any position on the medical claim.

References

    1. Cosman F, de Beur SJ, LeBoff MS, et al.. Clinician’s guide to prevention and treatment of osteoporosis. Osteoporos Int. 2014;25:2359-2381. doi:10.1007/s00198-014-2794-2 - DOI - PMC - PubMed
    1. Wright NC, Looker AC, Saag KG, et al.. The recent prevalence of osteoporosis and low bone mass in the United States based on bone mineral density at the femoral neck or lumbar spine. J Bone Miner Res. 2014;29:2520-2526. doi:10.1002/jbmr.2269 - DOI - PMC - PubMed
    1. Lewiecki ME, Wright NC, Curtis JR, et al.. Hip fracture trends in the United States, 2002 to 2015. Osteoporos Int. 2018;29:717-722. doi:10.1007/s00198-017-4345-0 - DOI - PubMed
    1. Lewiecki EM, Chastek B, Sundquist K, et al.. Osteoporotic fracture trends in a population of US managed care enrollees: 2007-2017. Osteoporos Int. 2020;31:1299-1304. doi:10.1007/s00198-020-05334-y - DOI - PMC - PubMed
    1. Balasubramanian A, Tosi LL, Lane JM, Dirschl DR, Ho PR, O’Malley CD. Declining rates of osteoporosis management following fragility fractures in the US, 2000 through 2009. J Bone Joint Surg Am. 2014;96:e52. doi:10.2106/JBJS.L.01781 - DOI - PubMed

Publication types