

BrrICE1.1 is associated with putrescine synthesis through regulation of the arginine decarboxylase gene in freezing tolerance of turnip (Brassica rapa var. rapa)
- PMID: 33148172
- PMCID: PMC7641815
- DOI: 10.1186/s12870-020-02697-6
BrrICE1.1 is associated with putrescine synthesis through regulation of the arginine decarboxylase gene in freezing tolerance of turnip (Brassica rapa var. rapa)
Abstract
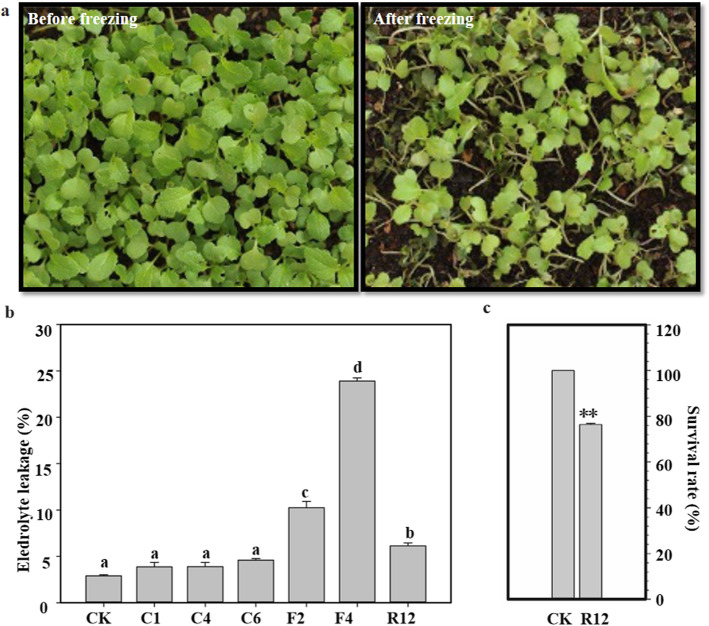
Background: In the agricultural areas of Qinghai-Tibet Plateau, temperature varies widely from day to night during the growing season, which makes the extreme temperature become one of the limiting factors of crop yield. Turnip (Brassica rapa var. rapa) is a traditional crop of Tibet grown in the Tibet Plateau, but its molecular and metabolic mechanisms of freezing tolerance are unclear.
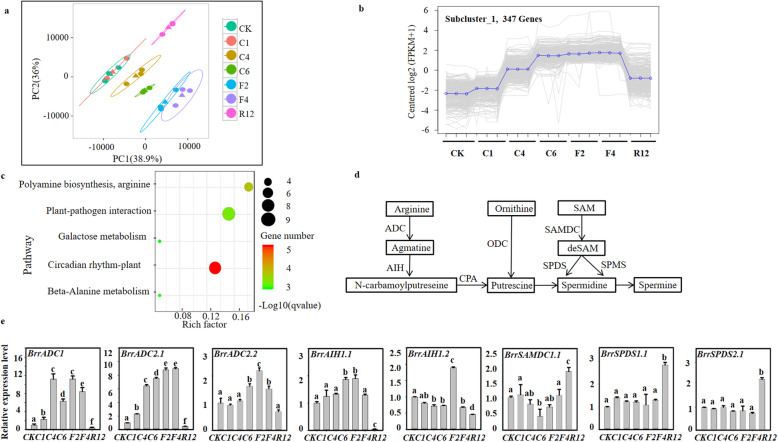
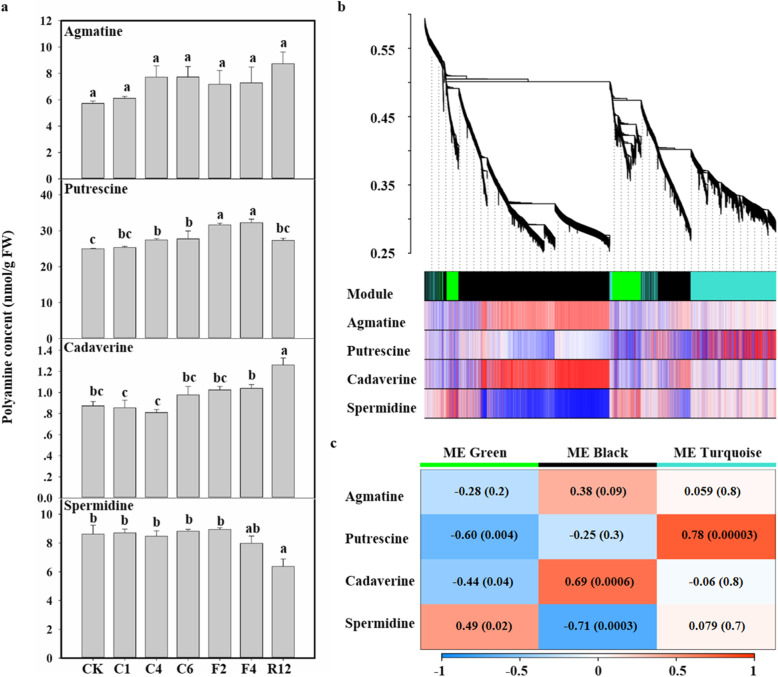
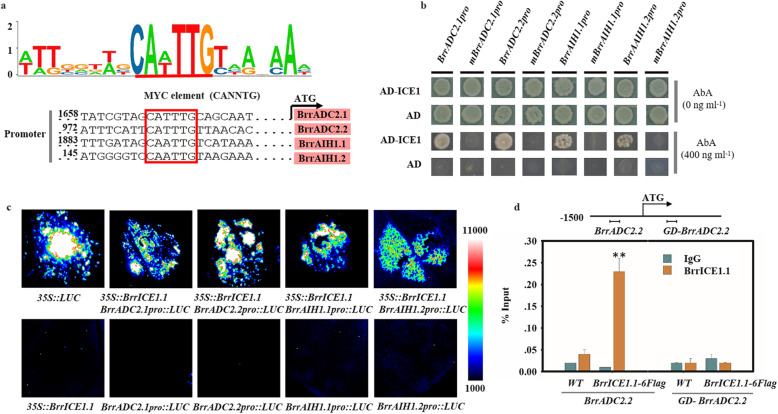
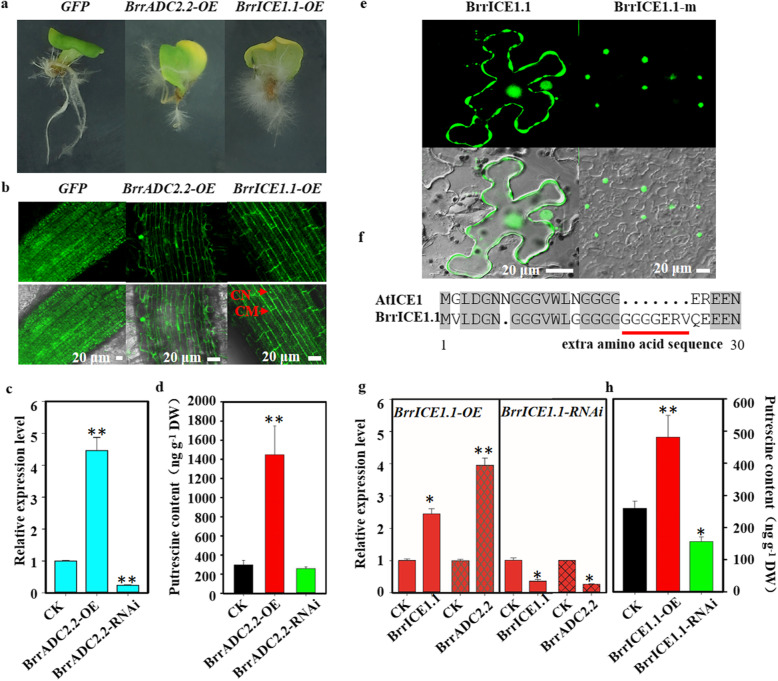
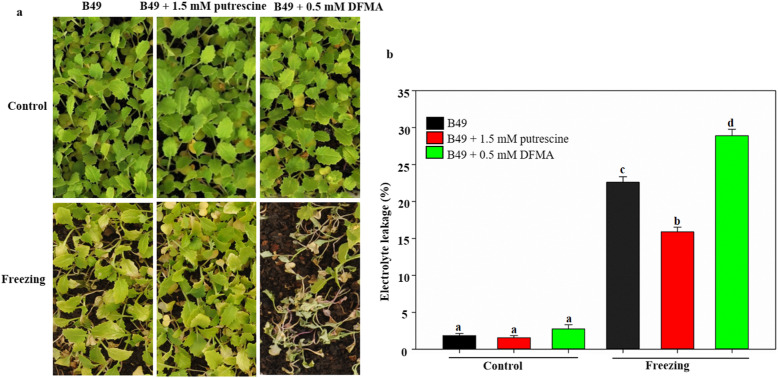
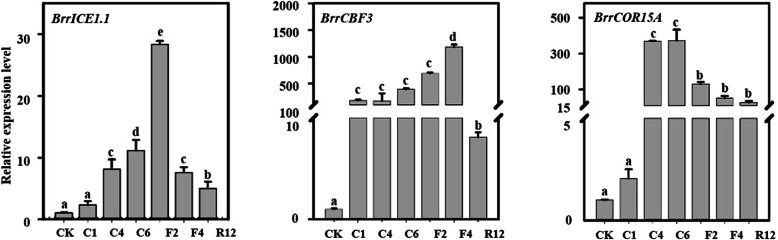
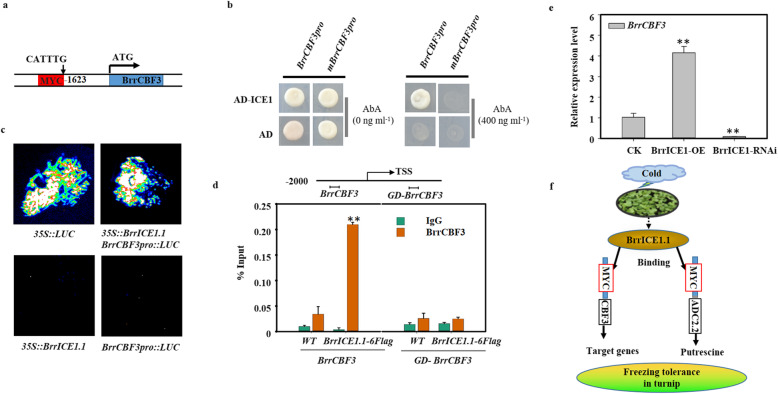
Results: Here, based on the changes in transcriptional and metabolic levels of Tibetan turnip under freezing treatment, the expression of the arginine decarboxylase gene BrrADC2.2 exhibited an accumulative pattern in accordance with putrescine content. Moreover, we demonstrated that BrrICE1.1 (Inducer of CBF Expression 1) could directly bind to the BrrADC2.2 promoter, activating BrrADC2.2 to promote the accumulation of putrescine, which was verified by RNAi and overexpression analyses for both BrrADC2.2 and BrrICE1.1 using transgenic hair root. The function of putrescine in turnip was further analyzed by exogenous application putrescine and its inhibitor DL-α-(Difluoromethyl) arginine (DFMA) under freezing tolerance. In addition, the BrrICE1.1 was found to be involved in the ICE1-CBF pathway to increase the freezing stress of turnip.
Conclusions: BrrICE1.1 could bind the promoter of BrrADC2.2 or CBFs to participate in freezing tolerance of turnip by transcriptomics and targeted metabolomics analyses. This study revealed the regulatory network of the freezing tolerance process in turnip and increased our understanding of the plateau crops response to extreme environments in Tibet.
Keywords: Brassica rapa var. rapa; Freezing tolerance; Metabolome; Putrescine; Transcriptome.
Conflict of interest statement
The authors declare that they have no competing interests.
Figures
Similar articles
-
The arginine decarboxylase gene ADC1, associated to the putrescine pathway, plays an important role in potato cold-acclimated freezing tolerance as revealed by transcriptome and metabolome analyses.Plant J. 2018 Dec;96(6):1283-1298. doi: 10.1111/tpj.14126. Epub 2018 Nov 27. Plant J. 2018. PMID: 30307077
-
iTRAQ-Based Comparative Proteomic Analysis of the Roots of TWO Winter Turnip Rapes (Brassica rapa L.) with Different Freezing-Tolerance.Int J Mol Sci. 2018 Dec 17;19(12):4077. doi: 10.3390/ijms19124077. Int J Mol Sci. 2018. PMID: 30562938 Free PMC article.
-
Expression profiles of glucosinolate biosynthetic genes in turnip (Brassica rapa var. rapa) at different developmental stages and effect of transformed flavin-containing monooxygenase genes on hairy root glucosinolate content.J Sci Food Agric. 2020 Feb;100(3):1064-1071. doi: 10.1002/jsfa.10111. Epub 2019 Dec 5. J Sci Food Agric. 2020. PMID: 31713870
-
Citrus sinensis CBF1 Functions in Cold Tolerance by Modulating Putrescine Biosynthesis through Regulation of Arginine Decarboxylase.Plant Cell Physiol. 2022 Jan 25;63(1):19-29. doi: 10.1093/pcp/pcab135. Plant Cell Physiol. 2022. PMID: 34478552
-
Gene co-expression network analysis reveals key pathways and hub genes in Chinese cabbage (Brassica rapa L.) during vernalization.BMC Genomics. 2021 Apr 6;22(1):236. doi: 10.1186/s12864-021-07510-8. BMC Genomics. 2021. PMID: 33823810 Free PMC article. Review.
Cited by
-
Combined Bulked Segregant Analysis-Sequencing and Transcriptome Analysis to Identify Candidate Genes Associated with Cold Stress in Brassica napus L.Int J Mol Sci. 2025 Jan 28;26(3):1148. doi: 10.3390/ijms26031148. Int J Mol Sci. 2025. PMID: 39940915 Free PMC article.
-
The network centered on ICEs play roles in plant cold tolerance, growth and development.Planta. 2022 Mar 6;255(4):81. doi: 10.1007/s00425-022-03858-7. Planta. 2022. PMID: 35249133 Review.
-
Response of distribution patterns of two closely related species in Taxus genus to climate change since last inter-glacial.Ecol Evol. 2022 Sep 14;12(9):e9302. doi: 10.1002/ece3.9302. eCollection 2022 Sep. Ecol Evol. 2022. PMID: 36177121 Free PMC article.
-
Adaptation of High-Altitude Plants to Plateau Abiotic Stresses: A Case Study of the Qinghai-Tibet Plateau.Int J Mol Sci. 2025 Mar 4;26(5):2292. doi: 10.3390/ijms26052292. Int J Mol Sci. 2025. PMID: 40076909 Free PMC article. Review.
-
The chromosome-scale genomes of two Tinospora species reveal differential regulation of the MEP pathway in terpenoid biosynthesis.BMC Biol. 2025 Mar 20;23(1):84. doi: 10.1186/s12915-025-02185-z. BMC Biol. 2025. PMID: 40114206 Free PMC article.
References
-
- Gupta K, Dey A, Gupta B. Plant polyamines in abiotic stress responses. Acta Physiol Plant. 2013;35(7):2015–2036. doi: 10.1007/s11738-013-1239-4. - DOI
-
- Tiburcio AF, Altabella T, Borrell A, Masgrau C. Polyamine metabolism and its regulation. Physiol Plant. 1997;100(3):664–674. doi: 10.1111/j.1399-3054.1997.tb03073.x. - DOI
-
- Valero D, Martínez-Romero D, Serrano Ma: The role of polyamines in the improvement of the shelf life of fruit. Trends Food Sci Technol 2002, 13(6–7):228–234.
-
- Bouchereau A, Aziz A, Larher F, Martin-Tanguy J. Polyamines and environmental challenges: recent development. Plant Sci. 1999;140(2):103–125. doi: 10.1016/S0168-9452(98)00218-0. - DOI
MeSH terms
Substances
LinkOut - more resources
Full Text Sources
