. 2020 Nov 4;12(1):167.
doi: 10.1186/s13148-020-00960-z.

Changes in DNA methylation profiles of myalgic encephalomyelitis/chronic fatigue syndrome patients reflect systemic dysfunctions

Affiliations

Changes in DNA methylation profiles of myalgic encephalomyelitis/chronic fatigue syndrome patients reflect systemic dysfunctions

A M Helliwell et al. Clin Epigenetics. .

Abstract

Background: Myalgic Encephalomyelitis/Chronic Fatigue Syndrome (ME/CFS) is a lifelong debilitating disease with a complex pathology not yet clearly defined. Susceptibility to ME/CFS involves genetic predisposition and exposure to environmental factors, suggesting an epigenetic association. Epigenetic studies with other ME/CFS cohorts have used array-based technology to identify differentially methylated individual sites. Changes in RNA quantities and protein abundance have been documented in our previous investigations with the same ME/CFS cohort used for this study.

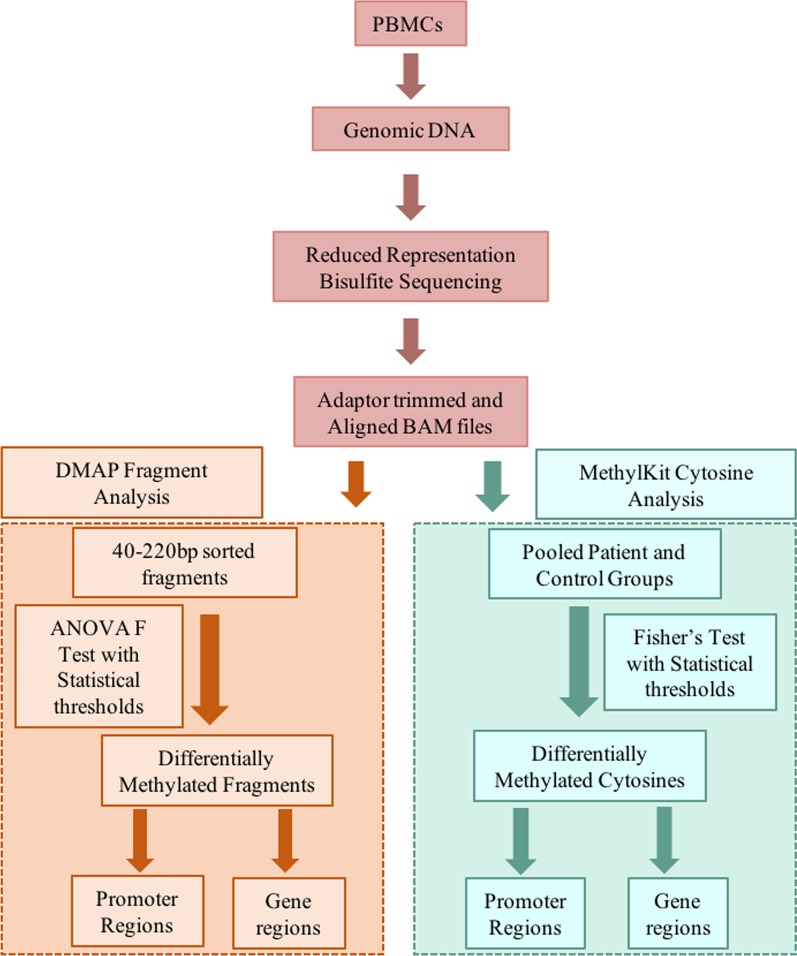
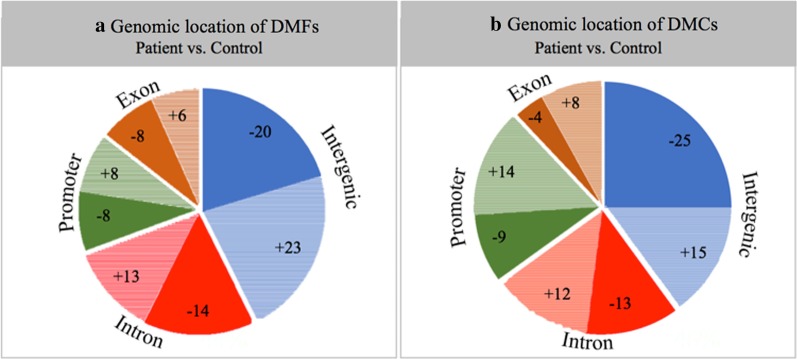
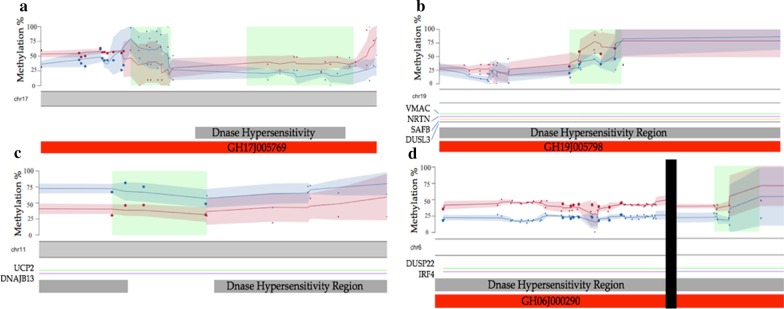
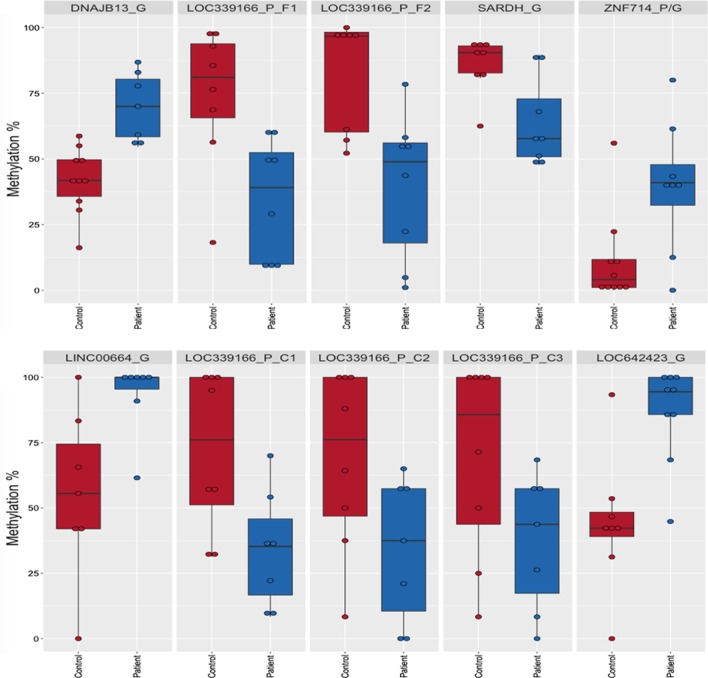
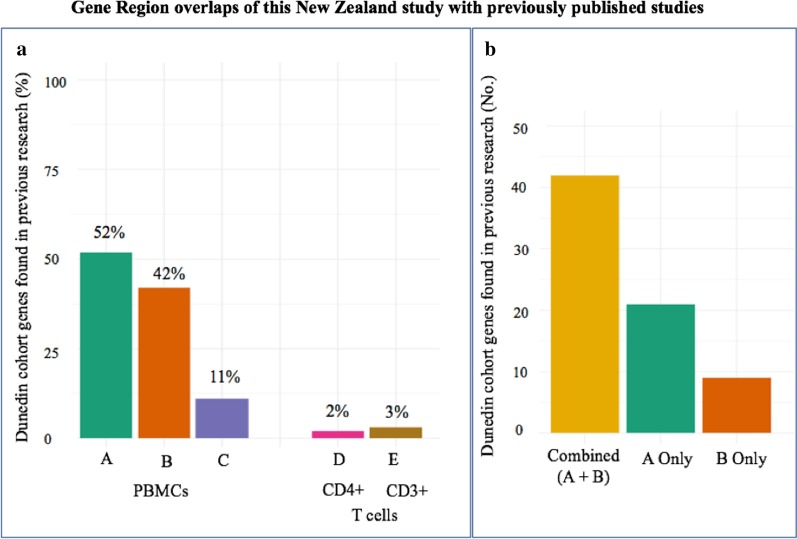
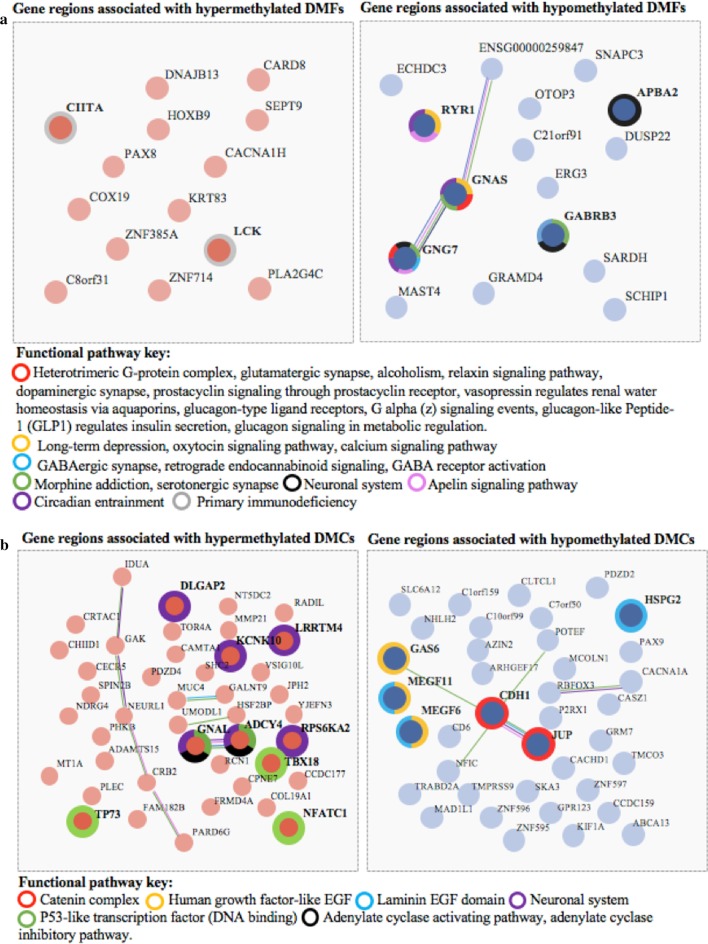
Results: DNA from a well-characterised New Zealand cohort of 10 ME/CFS patients and 10 age-/sex-matched healthy controls was isolated from peripheral blood mononuclear (PBMC) cells, and used to generate reduced genome-scale DNA methylation maps using reduced representation bisulphite sequencing (RRBS). The sequencing data were analysed utilising the DMAP analysis pipeline to identify differentially methylated fragments, and the MethylKit pipeline was used to quantify methylation differences at individual CpG sites. DMAP identified 76 differentially methylated fragments and Methylkit identified 394 differentially methylated cytosines that included both hyper- and hypo-methylation. Four clusters were identified where differentially methylated DNA fragments overlapped with or were within close proximity to multiple differentially methylated individual cytosines. These clusters identified regulatory regions for 17 protein encoding genes related to metabolic and immune activity. Analysis of differentially methylated gene bodies (exons/introns) identified 122 unique genes. Comparison with other studies on PBMCs from ME/CFS patients and controls with array technology showed 59% of the genes identified in this study were also found in one or more of these studies. Functional pathway enrichment analysis identified 30 associated pathways. These included immune, metabolic and neurological-related functions differentially regulated in ME/CFS patients compared to the matched healthy controls.

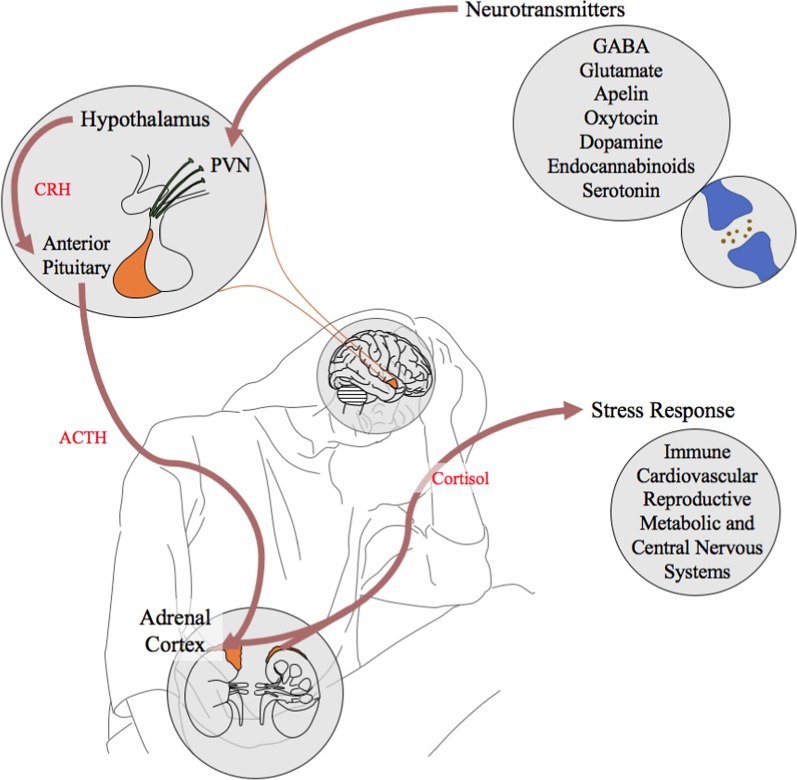
Conclusions: Major differences were identified in the DNA methylation patterns of ME/CFS patients that clearly distinguished them from the healthy controls. Over half found in gene bodies with RRBS in this study had been identified in other ME/CFS studies using the same cells but with array technology. Within the enriched functional immune, metabolic and neurological pathways, a number of enriched neurotransmitter and neuropeptide reactome pathways highlighted a disturbed neurological pathophysiology within the patient group.

Keywords: DMAP; DNA methylation; Epigenetics; ME/CFS; MethylKit; RRBS.


Conflict of interest statement

The authors declare they have no competing interests.

Figures

Fig. 1
Fig. 1
The study and analysis workflow for ME/CFS patients and age-matched healthy control methylome: DNA was isolated from the Peripheral blood mononuclear cells (PBMCs) of 10 ME/CFS patients and 10 age/sex matched healthy controls. DNA was processed to produce reduced representation bisulphite sequencing libraries. This DNA was then sequenced and the data aligned and trimmed using Bismark. The aligned RRBS sequence data were then analyzed using two parallel analyses pipelines: DMAP and MethylKit. DMAP utilised an ANOVA F test comparing patients and controls (requiring at least seven from each group to be present in each comparison between fragments). Associated promoter and gene regions were then identified. Methylkit analysis pooled the patient and control groups before comparison using a Fisher’s test to identify differentially methylated cytosines (requiring at least seven from each group to be present in the comparison between cytosines). Promoter and gene regions were then isolated and investigated
Fig. 2
Fig. 2
Pie charts showing proportional locations of differential methylation between patients and controls. a Genomic location of the differentially methylated fragments (DMFs) and b genomic location of the differentially methylated CpGs or DMCs. The differential methylation was mapped to annotated human genome data including; (1) exons (brown), (2) intergenic regions (blue), (3) introns (red) and (4) promoter regions (defined as 1500 bp upstream and 500 bp downstream from the TSS) (green). Proportions of hypo-methylated sites/fragments are indicated by the darker ‘solid’ coloured segments, and hyper-methylated proportions by the lighter ‘shaded’ segments. ‘−’ is hypo-methylated, and ‘+’ is hyper-methylated. The percentages in each segment are shown
Fig. 3
Fig. 3
Clusters of Differential Methylation across four chromosomes. Average methylation percentages are shown at cytosines for patients (blue) and control (pink) samples. The pink and blue lines show the rolling mean methylation score across the fragment length with associated shaded area indicating standard deviation. Larger points indicate sites of differential methylation with a FDR rate corrected Q value < 0.05. Smaller dots sites of differential methylation level of significance > 0.05. Green blocks indicate the detected DMAP fragments with differential methylation. DNase hypersensitivity regions are shown in gray with enhancers shown in red. Regions of enhancer and gene interactions are shown with labels indicating the associated gene. a A 400 bp section of chromosome 17 shows differential methylation overlapping with a DNase hypersensitivity region, an Enhancer (GeneHancer ID: GH17J005769). b A section of chromosome 19 showing the differential methylation falling within DNase hypersensitivity cluster, an enhancer (GeneHancer ID: GH19J005798) and four regulatory interactions. c A section of chromosome 11 showing the closely clustered differential methylation overlapping a DNase hypersensitivity and two regulatory interactions. d 1570 bp section of chromosome 6 showing differential methylation overlapping with DNase hypersensitivity clusters, an enhancer (GeneHancer ID: GH06J000290) and two regulatory interactions. Note in D there is a zoomed view of the chromosome for the individual cytosine cluster (250 bp) and fragment (250 bp) (split by black vertical bar—representing 450 bp)
Fig. 4
Fig. 4
Differential methylation of potential key genomic features. Box plots showing the range of methylation percentages for the patients and controls with the range of the boxes indicating the limits of the upper third and lower third quartile of the data, with the mean indicated by the horizontal line within the box. Individual methylation percentages are shown as single data points. a The top five differentially methylated fragments within promoter or gene regions, and b the top differentially methylated individual cytosines within promoter or gene regions. Gene regions are indicated with a ‘G’ and promoter regions with a ‘P’ in the feature ID. Multiple cytosines from the same feature are indicated with a ‘C’ and an identifying number. Multiple fragments from the same feature are indicated with a ‘F’. Control boxes and points are shown in red with patients in blue
Fig. 5
Fig. 5
Overlaps observed between the genes identified in this New Zealand study and previously published studies. a Bar plot showing the percentage of genes identified in the New Zealand study described here that overlap with previous published work that assessed the methylome of ME/CFS patients compared to healthy controls. a Bar A is the Trivedi et al. 2018 study [9], bar B is de Vega et al. [8], bar C is de Vega et al. [7], bar D is Brenu et al. [6], and bar E is Herrera et al. [10]. A summary of the genes found to be overlapping with each study is provided in Additional file 1: Excel file ‘Genelist_Overlaps’. b Bar plots showing the number of the 122 genes identified in the New Zealand study that overlapped with: ‘(A + B)’—both the Trivedi et al. [9] and de Vega et al. [8] studies; ‘A only’—Trivedi et al. [9], ‘B only’—de Vega et al. [8]. None of the overlaps between our New Zealand study and the de Vega et al. [7] (bar C in Fig. 5a) were unique to that study, but were also found in the other two studies [8, 9]
Fig. 6
Fig. 6
STRING diagrams showing functional relationships between hyper- and hypo-methylated DMFs within gene regions (a) and functional relationships between hyper- and hypo-methylated DMCs within gene regions (b). Colours highlighting specific genes indicate their presence within an overrepresented functional pathway determined through a STRING analysis. Functional pathways all have a FDR-corrected P value < 0.05. A full list of the functional pathways with associated P values and gene numbers in sets is included in Additional file 1: Excel file ‘DMAP_Pathways and ‘MethylKit_Pathways’
Fig. 7
Fig. 7
The HPA axis including the overrepresented neurotransmitter pathways in ME/CFS identified by this analysis. The pathways identified from the overrepresentation analysis and shown here are known to stimulate the HPA axis either directly through the paraventricular nucleus (PVN) with corticotropin releasing hormone (CRH)-producing cells or by an unknown mechanism linked to it. The activation of the CRH sensitive neuronal cells then triggers a downstream stimulation of the anterior pituitary causing the release of adrenocorticotropic hormone (ACTH). ACTH stimulates the adrenal cortex releasing glucocorticoids including cortisol into the body. Cortisol then has a role in the stimulation of a large number of downstream systems involved in a stress response

References

    1. Lim EJ, Ahn YC, Jang ES, Lee SW, Lee SH, Son CG. Systematic review and meta-analysis of the prevalence of chronic fatigue syndrome/myalgic encephalomyelitis (CFS/ME) J Transl Med. 2020;18:100. doi: 10.1186/s12967-020-02269-0. - DOI - PMC - PubMed
    1. Líndal E, Stefánsson JG, Bergmann S. The prevalence of chronic fatigue syndrome in Iceland—a national comparison by gender drawing on four different criteria. Nord J Psych. 2002;56:273–277. doi: 10.1080/08039480260242769. - DOI - PubMed
    1. Chu L, Valencia IJ, Garvert DW, Montoya JG. Onset patterns and course of myalgic encephalomyelitis/chronic fatigue syndrome. Front Pediatr. 2019;7:12. doi: 10.3389/fped.2019.00012. - DOI - PMC - PubMed
    1. Shepherd C. ME/CFS/PVFS: an exploration of the key clinical issues. Gawcott: ME Association; 2013. p. 52.
    1. Missailidis D, Annesley SJ, Allan CY, Sanislav O, Lidbury BA, Lewis DP, et al. An isolated Complex V inefficiency and dysregulated mitochondrial function in immortalized lymphocytes from ME/CFS patients. Int J Mol Sci. 2020;21:1074. doi: 10.3390/ijms21031074. - DOI - PMC - PubMed

Publication types

MeSH terms