

Effect of monitoring surgical outcomes using control charts to reduce major adverse events in patients: cluster randomised trial
- PMID: 33148601
- PMCID: PMC7610189
- DOI: 10.1136/bmj.m3840
Effect of monitoring surgical outcomes using control charts to reduce major adverse events in patients: cluster randomised trial
Abstract
Objective: To determine the effect of introducing prospective monitoring of outcomes using control charts and regular feedback on indicators to surgical teams on major adverse events in patients.
Design: National, parallel, cluster randomised trial embedding a difference-in-differences analysis.
Setting: 40 surgical departments of hospitals across France.
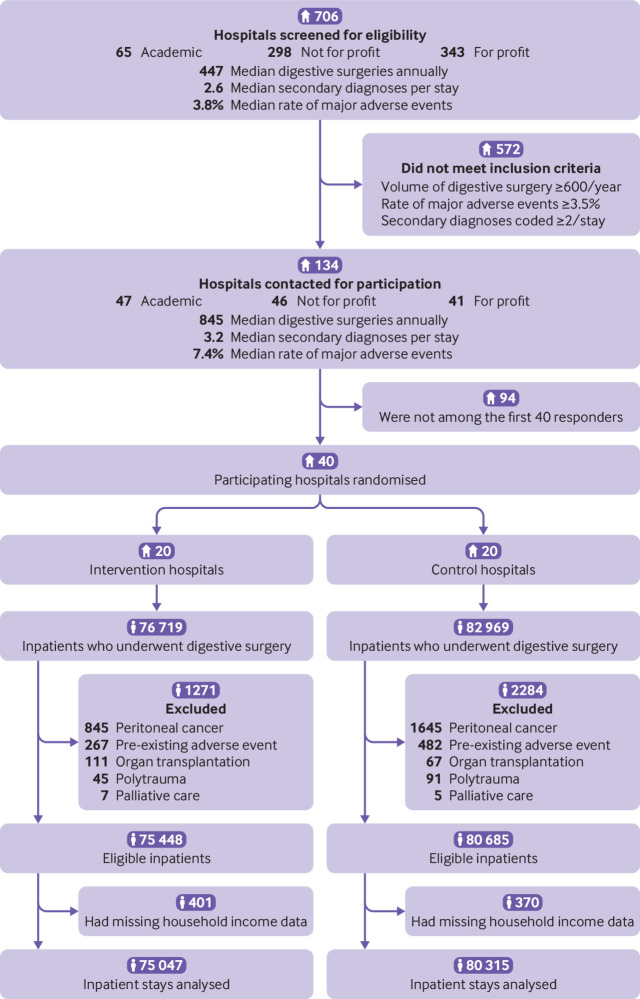
Participants: 155 362 adults who underwent digestive tract surgery. 20 of the surgical departments were randomised to prospective monitoring of outcomes using control charts with regular feedback on indicators (intervention group) and 20 to usual care only (control group).
Interventions: Prospective monitoring of outcomes using control charts, provided in sets quarterly, with regular feedback on indicators (intervention hospitals). To facilitate implementation of the programme, study champion partnerships were established at each site, comprising a surgeon and another member of the surgical team (surgeon, anaesthetist, or nurse), and were trained to conduct team meetings, display posters in operating rooms, maintain a logbook, and devise an improvement plan.
Main outcome measures: The primary outcome was a composite of major adverse events (inpatient death, intensive care stay, reoperation, and severe complications) within 30 days after surgery. Changes in surgical outcomes were compared before and after implementation of the programme between intervention and control hospitals, with adjustment for patient mix and clustering.
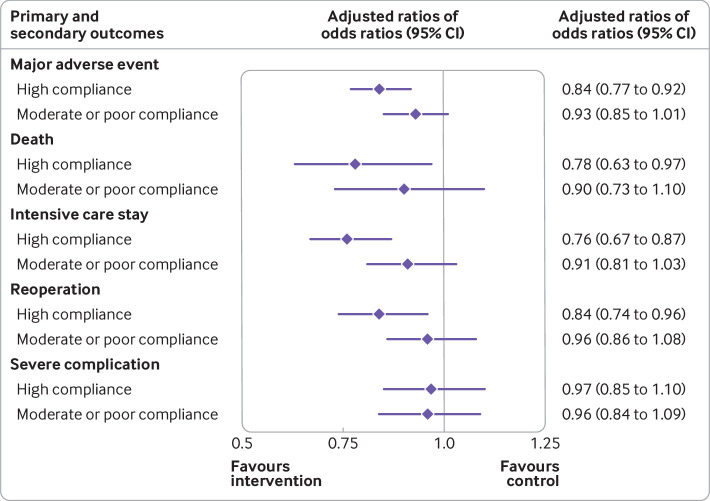
Results: 75 047 patients were analysed in the intervention hospitals (37 579 before and 37 468 after programme implementation) versus 80 315 in the control hospitals (41 548 and 38 767). After introduction of the control chart, the absolute risk of a major adverse event was reduced by 0.9% (95% confidence interval 0.4% to 1.4%) in intervention compared with control hospitals, corresponding to 114 patients (70 to 280) who needed to receive the intervention to prevent one major adverse event. A significant decrease in major adverse events (adjusted ratio of odds ratios 0.89, 95% confidence interval 0.83 to 0.96), patient death (0.84, 0.71 to 0.99), and intensive care stay (0.85, 0.76 to 0.94) was found in intervention compared with control hospitals. The same trend was observed for reoperation (0.91, 0.82 to 1.00), whereas severe complications remained unchanged (0.96, 0.87 to 1.07). Among the intervention hospitals, the effect size was proportional to the degree of control chart implementation witnessed. Highly compliant hospitals experienced a more important reduction in major adverse events (0.84, 0.77 to 0.92), patient death (0.78, 0.63 to 0.97), intensive care stay (0.76, 0.67 to 0.87), and reoperation (0.84, 0.74 to 0.96).
Conclusions: The implementation of control charts with feedback on indicators to surgical teams was associated with concomitant reductions in major adverse events in patients. Understanding variations in surgical outcomes and how to provide safe surgery is imperative for improvements.
Trial registration: ClinicalTrials.gov NCT02569450.
© Author(s) (or their employer(s)) 2019. Re-use permitted under CC BY-NC. No commercial re-use. See rights and permissions. Published by BMJ.
Conflict of interest statement
Competing interests: All authors have completed the ICMJE uniform disclosure form at www.icmje.org/coi_disclosure.pdf and declare: no support from any organisation for the submitted work beyond the grant funding; no financial relationships with any organisations that might have an interest in the submitted work in the previous three years; no other relationships or activities that could appear to have influenced the submitted work.
Figures
Comment in
-
Improving outcomes for surgical patients.BMJ. 2020 Nov 4;371:m3929. doi: 10.1136/bmj.m3929. BMJ. 2020. PMID: 33148633 No abstract available.
References
-
- Shewhart WA. Economic Control of Quality of Manufactured Product. Van Nostrand, 1931.
Publication types
MeSH terms
Associated data
LinkOut - more resources
Full Text Sources
Medical