. 2021 Jan;32(1):69-85.
doi: 10.1681/ASN.2020030362. Epub 2020 Nov 4.

Neutrophil-Macrophage Imbalance Drives the Development of Renal Scarring during Experimental Pyelonephritis

Affiliations

Neutrophil-Macrophage Imbalance Drives the Development of Renal Scarring during Experimental Pyelonephritis

Juan de Dios Ruiz-Rosado et al. J Am Soc Nephrol. 2021 Jan.

Abstract

Background: In children, the acute pyelonephritis that can result from urinary tract infections (UTIs), which commonly ascend from the bladder to the kidney, is a growing concern because it poses a risk of renal scarring and irreversible loss of kidney function. To date, the cellular mechanisms underlying acute pyelonephritis-driven renal scarring remain unknown.

Methods: We used a preclinical model of uropathogenic Escherichia coli-induced acute pyelonephritis to determine the contribution of neutrophils and monocytes to resolution of the condition and the subsequent development of kidney fibrosis. We used cell-specific monoclonal antibodies to eliminate neutrophils, monocytes, or both. Bacterial ascent and the cell dynamics of phagocytic cells were assessed by biophotonic imaging and flow cytometry, respectively. We used quantitative RT-PCR and histopathologic analyses to evaluate inflammation and renal scarring.

Results: We found that neutrophils are critical to control bacterial ascent, which is in line with previous studies suggesting a protective role for neutrophils during a UTI, whereas monocyte-derived macrophages orchestrate a strong, but ineffective, inflammatory response against uropathogenic, E. coli-induced, acute pyelonephritis. Experimental neutropenia during acute pyelonephritis resulted in a compensatory increase in the number of monocytes and heightened macrophage-dependent inflammation in the kidney. Exacerbated macrophage-mediated inflammatory responses promoted renal scarring and compromised renal function, as indicated by elevated serum creatinine, BUN, and potassium.

Conclusions: These findings reveal a previously unappreciated outcome for neutrophil-macrophage imbalance in promoting host susceptibility to acute pyelonephritis and the development of permanent renal damage. This suggests targeting dysregulated macrophage responses might be a therapeutic tool to prevent renal scarring during acute pyelonephritis.

Keywords: acute pyelonephritis; inflammation; macrophages; neutrophils; renal scarring; urinary tract infection.


Figures

None
Graphical abstract
Figure 1.
Figure 1.
Neutrophil depletion leads to an increased susceptibility during UPEC-driven APN. (A) Diagram of experimental induction of UPEC-mediated APN and Ab treatment in female C3H/HeOuJ mice. See Methods section for details. (B) Kinetics of the body-weight changes from infected animals treated with depleting Abs (anti-Ly6G, anti-GR1, and anti-CD115), isotype Ab, or PBS, as described in (A). Graphs show the mean±SEM of n=12–14 mice per group. Bacterial burden in (C) bladders and (D) kidneys collected from the different experimental groups of infected mice at 2 and 7 dpi. Graphs show the mean±SEM of n=10–16 mice per group. (E) Representative images of C3H/HeOuJ mice transurethrally infected with bioluminescent UPEC (CFT073 strain, Pem7-lux reporter, 1×10⁸ CFU/50 μl PBS) treated with Abs as described in Supplemental Figure 1G, at 12, 24, and 36 hpi. (F) Kinetics of bioluminescent UPEC dissemination within the bladder and kidney areas of the urinary tract. Graphs show the mean±SEM of n=5–6 mice per group. (G) Ex vivo imaging of bacterial infection in kidneys and bladders from the different experimental cohorts at 48 hpi. (H) Bar graphs representing the mean intensity of bioluminescence, indicative of bacterial distribution, within the kidneys and bladders at 48 hpi. Graphs represent the mean±SEM of n=5–7 mice per group. (B and F) Two-way ANOVA, with respect to infected isotype-treated mice. (C, D, and H) One-way ANOVA. *P<0.05, **P<0.01, ***P<0.001, ****P<0.0001.
Figure 2.
Figure 2.
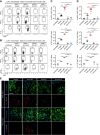
Neutrophil depletion in infected mice leads to increased accumulation of macrophages in the bladder and kidney. (A) Dot plots from the flow-cytometry analysis of Ly6G+ neutrophils (red circles), Ly6C+ macrophages (black squares), and (B) Ly6C macrophages (blue squares) in the kidney and bladder from UPEC-infected (7 dpi) and uninfected C3H/HeOuJ mice treated with depleting Abs or isotype Ab, as described in Figure 1A (see gating strategies in Supplemental Figure 2). (C) Kinetics of the absolute numbers of Ly6C+ macrophages, Ly6C macrophages, and Ly6G+ neutrophils per kidney pair from the different cohorts. (D) Absolute numbers of Ly6C+ macrophages, Ly6C macrophages, and Ly6G+ neutrophils per bladder from the different groups of infected and uninfected mice. Data are representative of two independent experiments of n=5–7 mice per condition, and are expressed as mean±SEM. (C and D) Two-way ANOVA, with respect to infected mice treated with isotype Ab. **P<0.01, ***P<0.001, ****P<0.0001. Macs. macrophages; MHC-II, major histocompatibility complex class II; Neu, neutrophils.
Figure 3.
Figure 3.
Experimental neutropenia leads to monocytosis during APN. (A) Dot plots from the flow-cytometric analysis of Ly6C+hi (black squares), Ly6C+low (green squares) monocytes and (B) Ly6G+ neutrophils (red squares) in the blood (ml) from UPEC-infected (7 dpi) and uninfected C3H/HeOuJ mice. (C) Kinetics of the absolute numbers of Ly6C+hi, Ly6C+low monocytes and Ly6G+ neutrophils per milliliter of blood in the different experimental groups. Data are representative of two independent experiments of n=5–7 mice per condition, and are expressed as mean±SEM. (C) Two-way ANOVA, with respect to infected mice treated with isotype Ab. *P<0.05, **P<0.01, ***P<0.001, ****P<0.0001. Mo, monocytes; Neu, neutrophils.
Figure 4.
Figure 4.
The accumulation of monocyte-derived macrophages in the infected kidney promotes renal pathology during APN. (A) Photomicrographs of kidney slides, stained with hemotoxylin and eosin, from UPEC-infected animals treated with depleting Abs or isotype Ab at 7 dpi (Figure 1A). Black squares in the renal pelvis of the entire kidneys in the first row are magnified (×20) in the second row. White squares in the renal cortex of kidneys are magnified in the third row, bottom part, of the figure. Scale bar in the first row, 1 mm. Scale bar in ×20 images of the renal pelvis and renal cortex, 100 μm. Representative graphs of the incidence of (B) renal pyelitis, (C) severe APN, (D) papillary necrosis, (E) renal abscess, and (F) thrombus in the kidneys from the different experimental groups. Data are representative of two independent experiments and are expressed as percentage of kidneys (n=24–28 kidneys) per group. *P<0.05, **P<0.01, ***P<0.001, ****P<0.0001, by Fisher exact test.
Figure 5.
Figure 5.
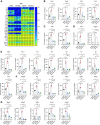
The early inflammatory response elicited during APN is compromised by depletion of monocytes. (A) Heat map showing the mRNA expression of inflammatory mediators in the kidney (2 dpi) among the groups of UPEC-infected mice described in Figure 1A. The color scale illustrates the relative mean levels of mRNA: blue, high induction; yellow, low induction. Bar graphs representative of the gene expression of (B) inflammatory chemokines, (C) growth factors, (D) kidney injury markers, (E) cytokines, (F) factors involved in the signaling pathway induced by UPEC, and (G) profibrotic markers in the kidneys from all of the experimental cohorts at 2 dpi. Gene expression was normalized to 18S ribosomal RNA. Data are expressed as fold changes relative to uninfected kidney cells. Data are representative of n=4 mice per condition and are expressed as mean±SEM. *P<0.05, **P<0.01, ***P<0.001, ****P<0.0001, one-way ANOVA.
Figure 6.
Figure 6.
Macrophages display a proinflammatory profile in the kidney during APN. Flow-cytometry analysis of (A) Ly6C+ and (B) Ly6C macrophages producing iNOS, TNF-α, or IL-1β in the kidney at 7 dpi. Numbers of (C) Ly6C+ and (D) Ly6C macrophages producing iNOS, TNF-α or IL-1β at 7 dpi. (E) Representative immunofluorescence pictures in the renal pelvis and renal cortex from infected mice treated with depleting Abs or isotype Ab at 7 dpi. The images show the stainings for F4/80+ macrophages (red), E. coli (white), plasma membrane (green), and nuclei (blue). The white arrows indicate the glomeruli. Scale bar, 100 μm. Data are representative of two independent experiments of n=3–5 mice per condition, and are expressed as mean±SEM. *P<0.05, **P<0.01, ***P<0.001, ****P<0.0001, one-way ANOVA. DAPI, 4′,6-diamidino-2-phenylindole; Macs, macrophages; WGA, wheat germ agglutinin.
Figure 7.
Figure 7.
Macrophage-dependent inflammation promotes the development of renal scarring during APN. (A) Experimental design of UPEC-induced APN and Ab treatment in female C3H/HeOuJ mice (see Methods for details). (B) Kinetics of the body weight from the different experimental groups of infected mice described in Figure 6A. (C) Representative images of kidney slides from all of the groups of uninfected and infected mice stained with Picro Sirius Red. Scale bar in full kidneys, 1 mm. Black squares in the renal cortex of entire kidneys are shown at higher magnifications: ×10 (top) and ×20 (below) in the second and third row, respectively. Scale bars in ×10 and ×20 magnifications, 200 μm and 100 μm, respectively. Incidence of (D) cortical scarring, (E) cortical abscesses, and (F) cortical necrosis in kidneys from the different groups of infected mice. Graphs show the percentage of kidneys (n=14) per group. (G) Bacterial burden in the kidneys from infected mice at 21 dpi. Data are representative of 7–8 mice per condition, and are expressed as mean±SEM. (B) Two-way ANOVA, (D–F) Fisher exact test, (G) one-way ANOVA. *P<0.05, **P<0.01.
Figure 8.
Figure 8.
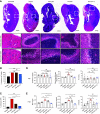
Monocytes and neutrophils have distinct roles in the development of renal pathology during APN. (A) Microscopic scans of kidneys stained with hematoxylin and eosin from uninfected and UPEC-infected C3H/HeOuJ mice at 21 dpi (Figure 7A). Scale bar in images of entire kidney, 1 mm. White squares in the renal cortex of the entire kidney are magnified at ×10 and ×20 in the second and third rows, respectively. Scale bar in the ×10 and ×20 magnifications of the renal cortex, 200 μm and 100 μm, respectively. Prevalence of (B) renal pyelitis and (C) severe APN in the different groups of infected mice. Graphs show the percentage of kidneys (n=14–16) per group. Levels of BUN, Cr, and K+ in the blood from the different groups of infected mice at (D) 7 dpi and (E) 21 dpi. Graphs are representative of two independent experiments, of 5–7 mice per condition, and are expressed as mean±SEM. (B and C) Fisher exact test. (D and E) One-way ANOVA. *P<0.05; **P<0.01; ***P<0.001, ****P<0.0001.

Similar articles

Cited by

References

    1. Freedman AL; Urologic Diseases in America Project: Urologic diseases in North America Project: Trends in resource utilization for urinary tract infections in children. J Urol 173: 949–954, 2005 - PubMed
    1. McLellan LK, Hunstad DA: Urinary tract infection: Pathogenesis and outlook. Trends Mol Med 22: 946–957, 2016 - PMC - PubMed
    1. Shaikh N, Ewing AL, Bhatnagar S, Hoberman A: Risk of renal scarring in children with a first urinary tract infection: A systematic review. Pediatrics 126: 1084–1091, 2010 - PubMed
    1. Shaikh N, Craig JC, Rovers MM, Da Dalt L, Gardikis S, Hoberman A, et al. .: Identification of children and adolescents at risk for renal scarring after a first urinary tract infection: A meta-analysis with individual patient data. JAMA Pediatr 168: 893–900, 2014 - PubMed
    1. Jakobsson B, Berg U, Svensson L: Renal scarring after acute pyelonephritis. Arch Dis Child 70: 111–115, 1994 - PMC - PubMed

Publication types

MeSH terms