. 2020 Nov 4;12(568):eaba0599.
doi: 10.1126/scitranslmed.aba0599.

Oligodendrocyte-derived extracellular vesicles as antigen-specific therapy for autoimmune neuroinflammation in mice

Affiliations

Oligodendrocyte-derived extracellular vesicles as antigen-specific therapy for autoimmune neuroinflammation in mice

Giacomo Casella et al. Sci Transl Med. .

Abstract

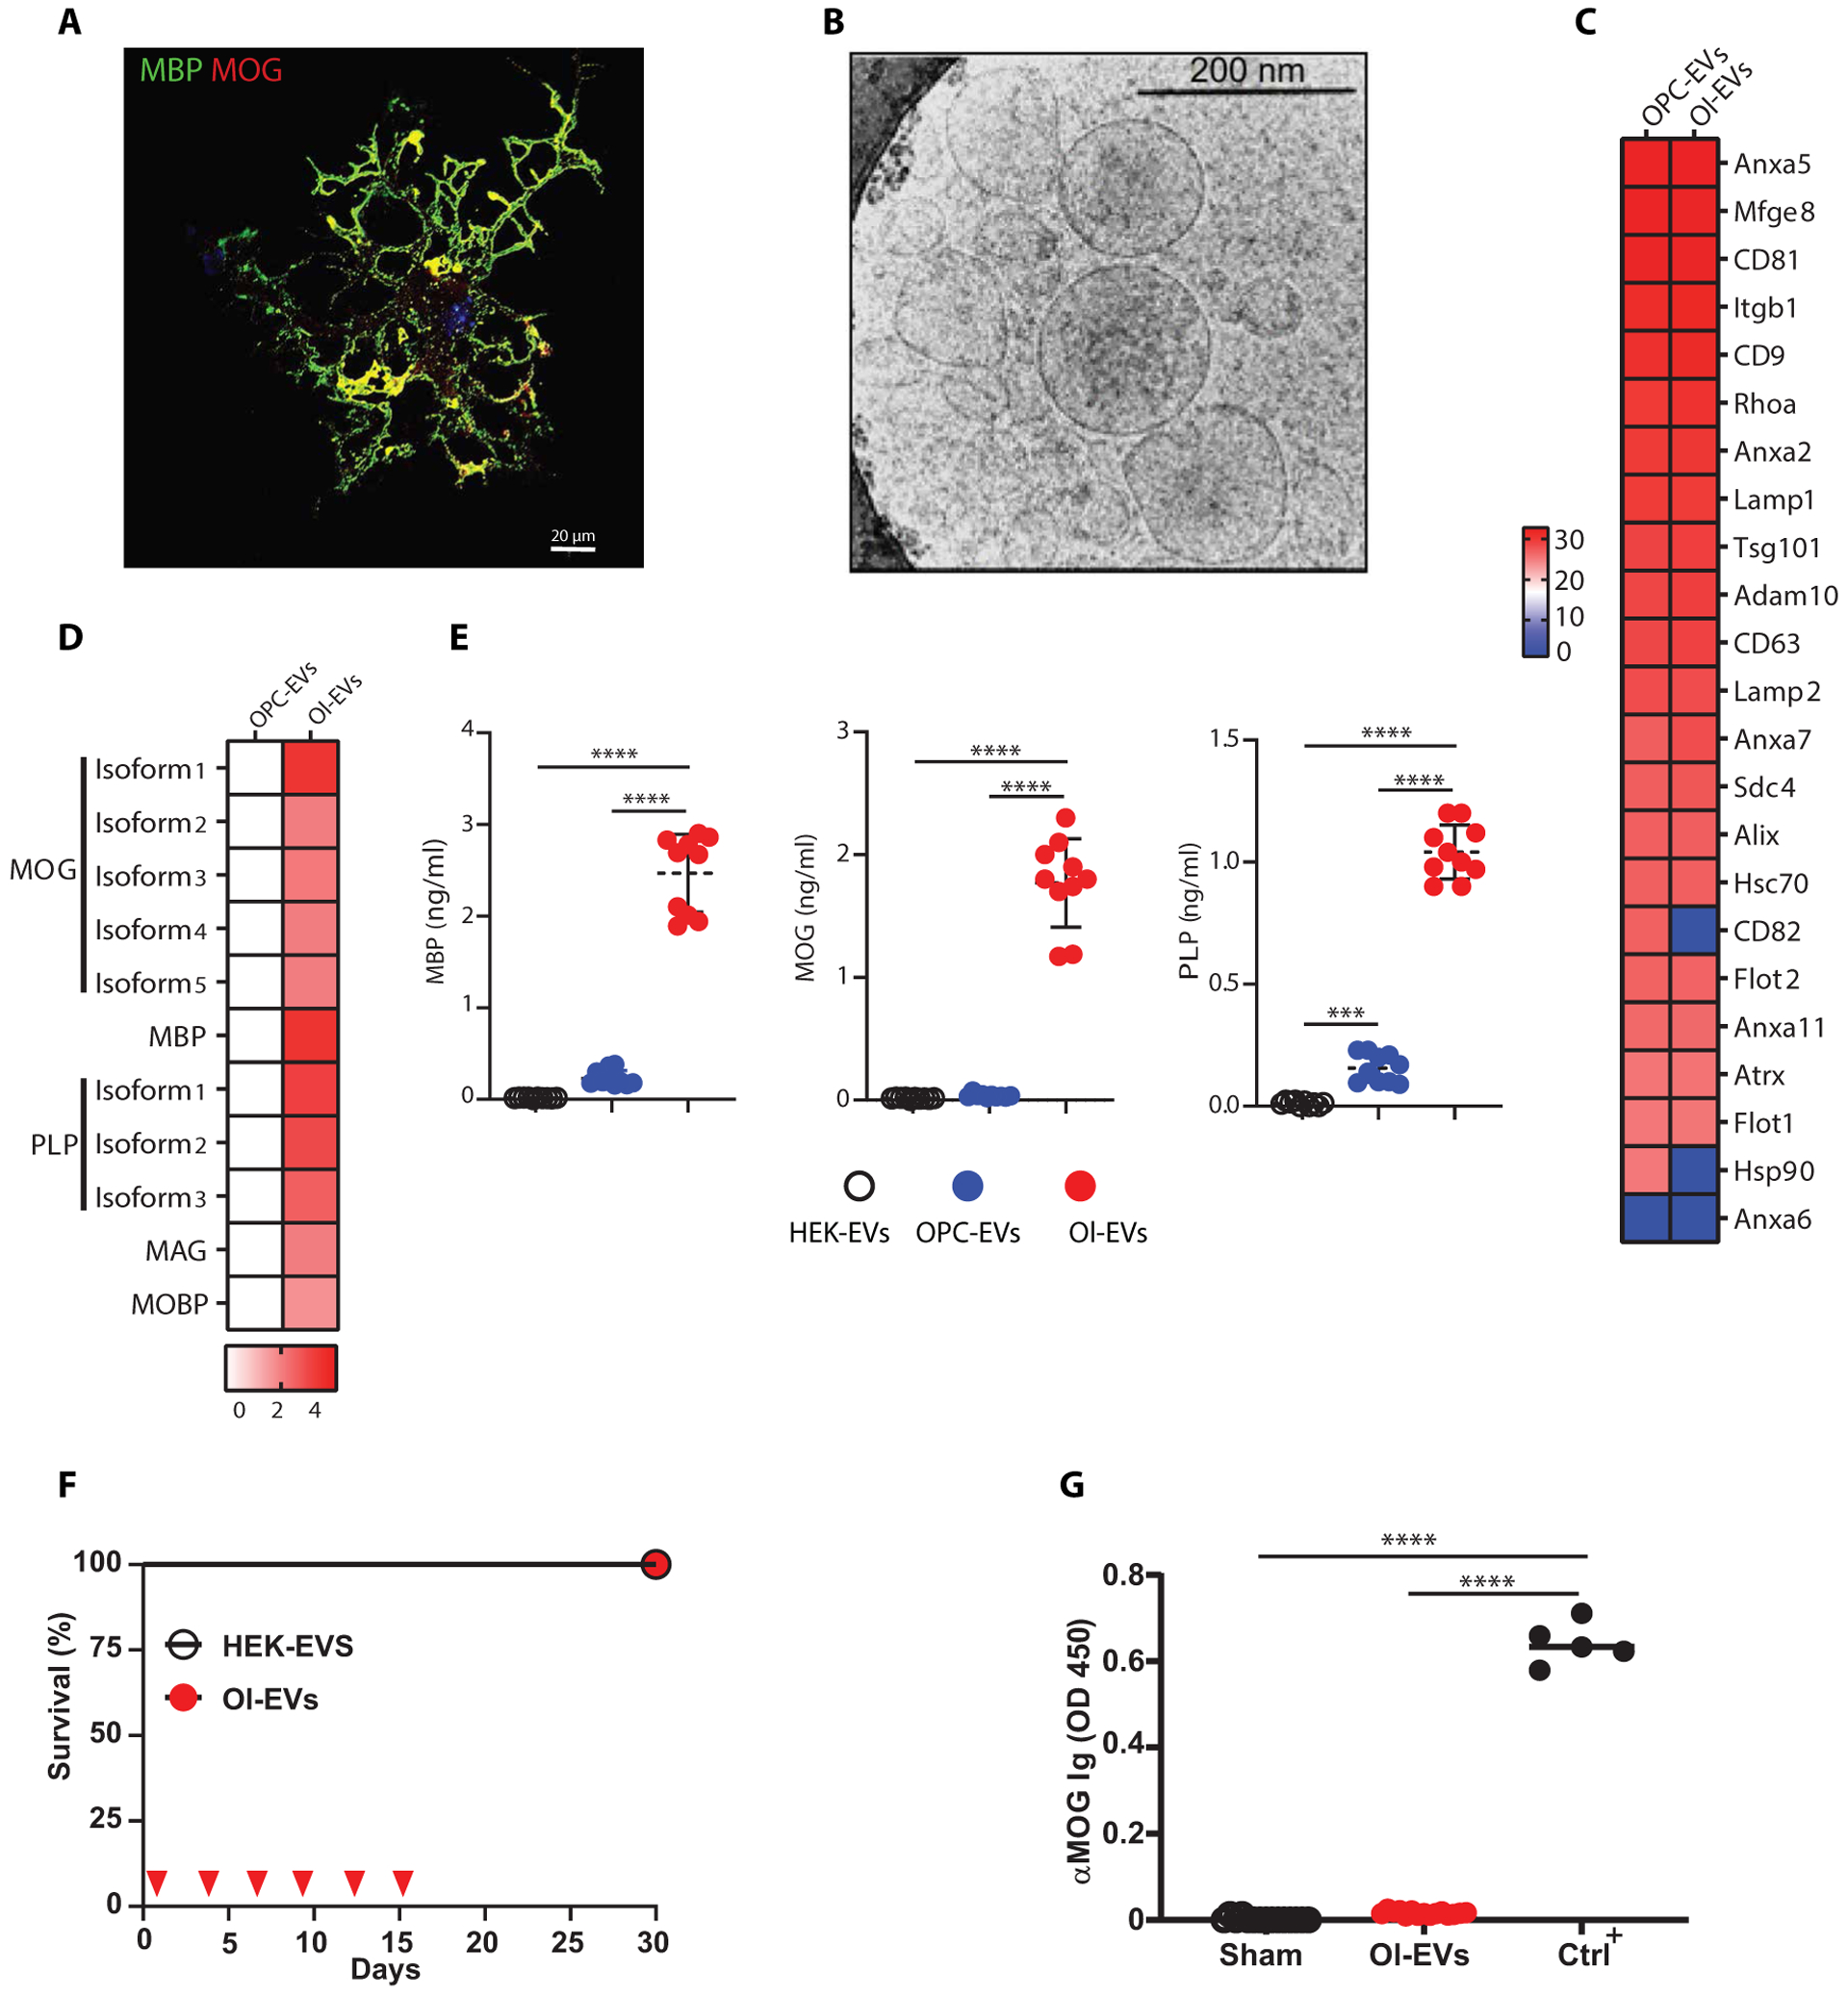
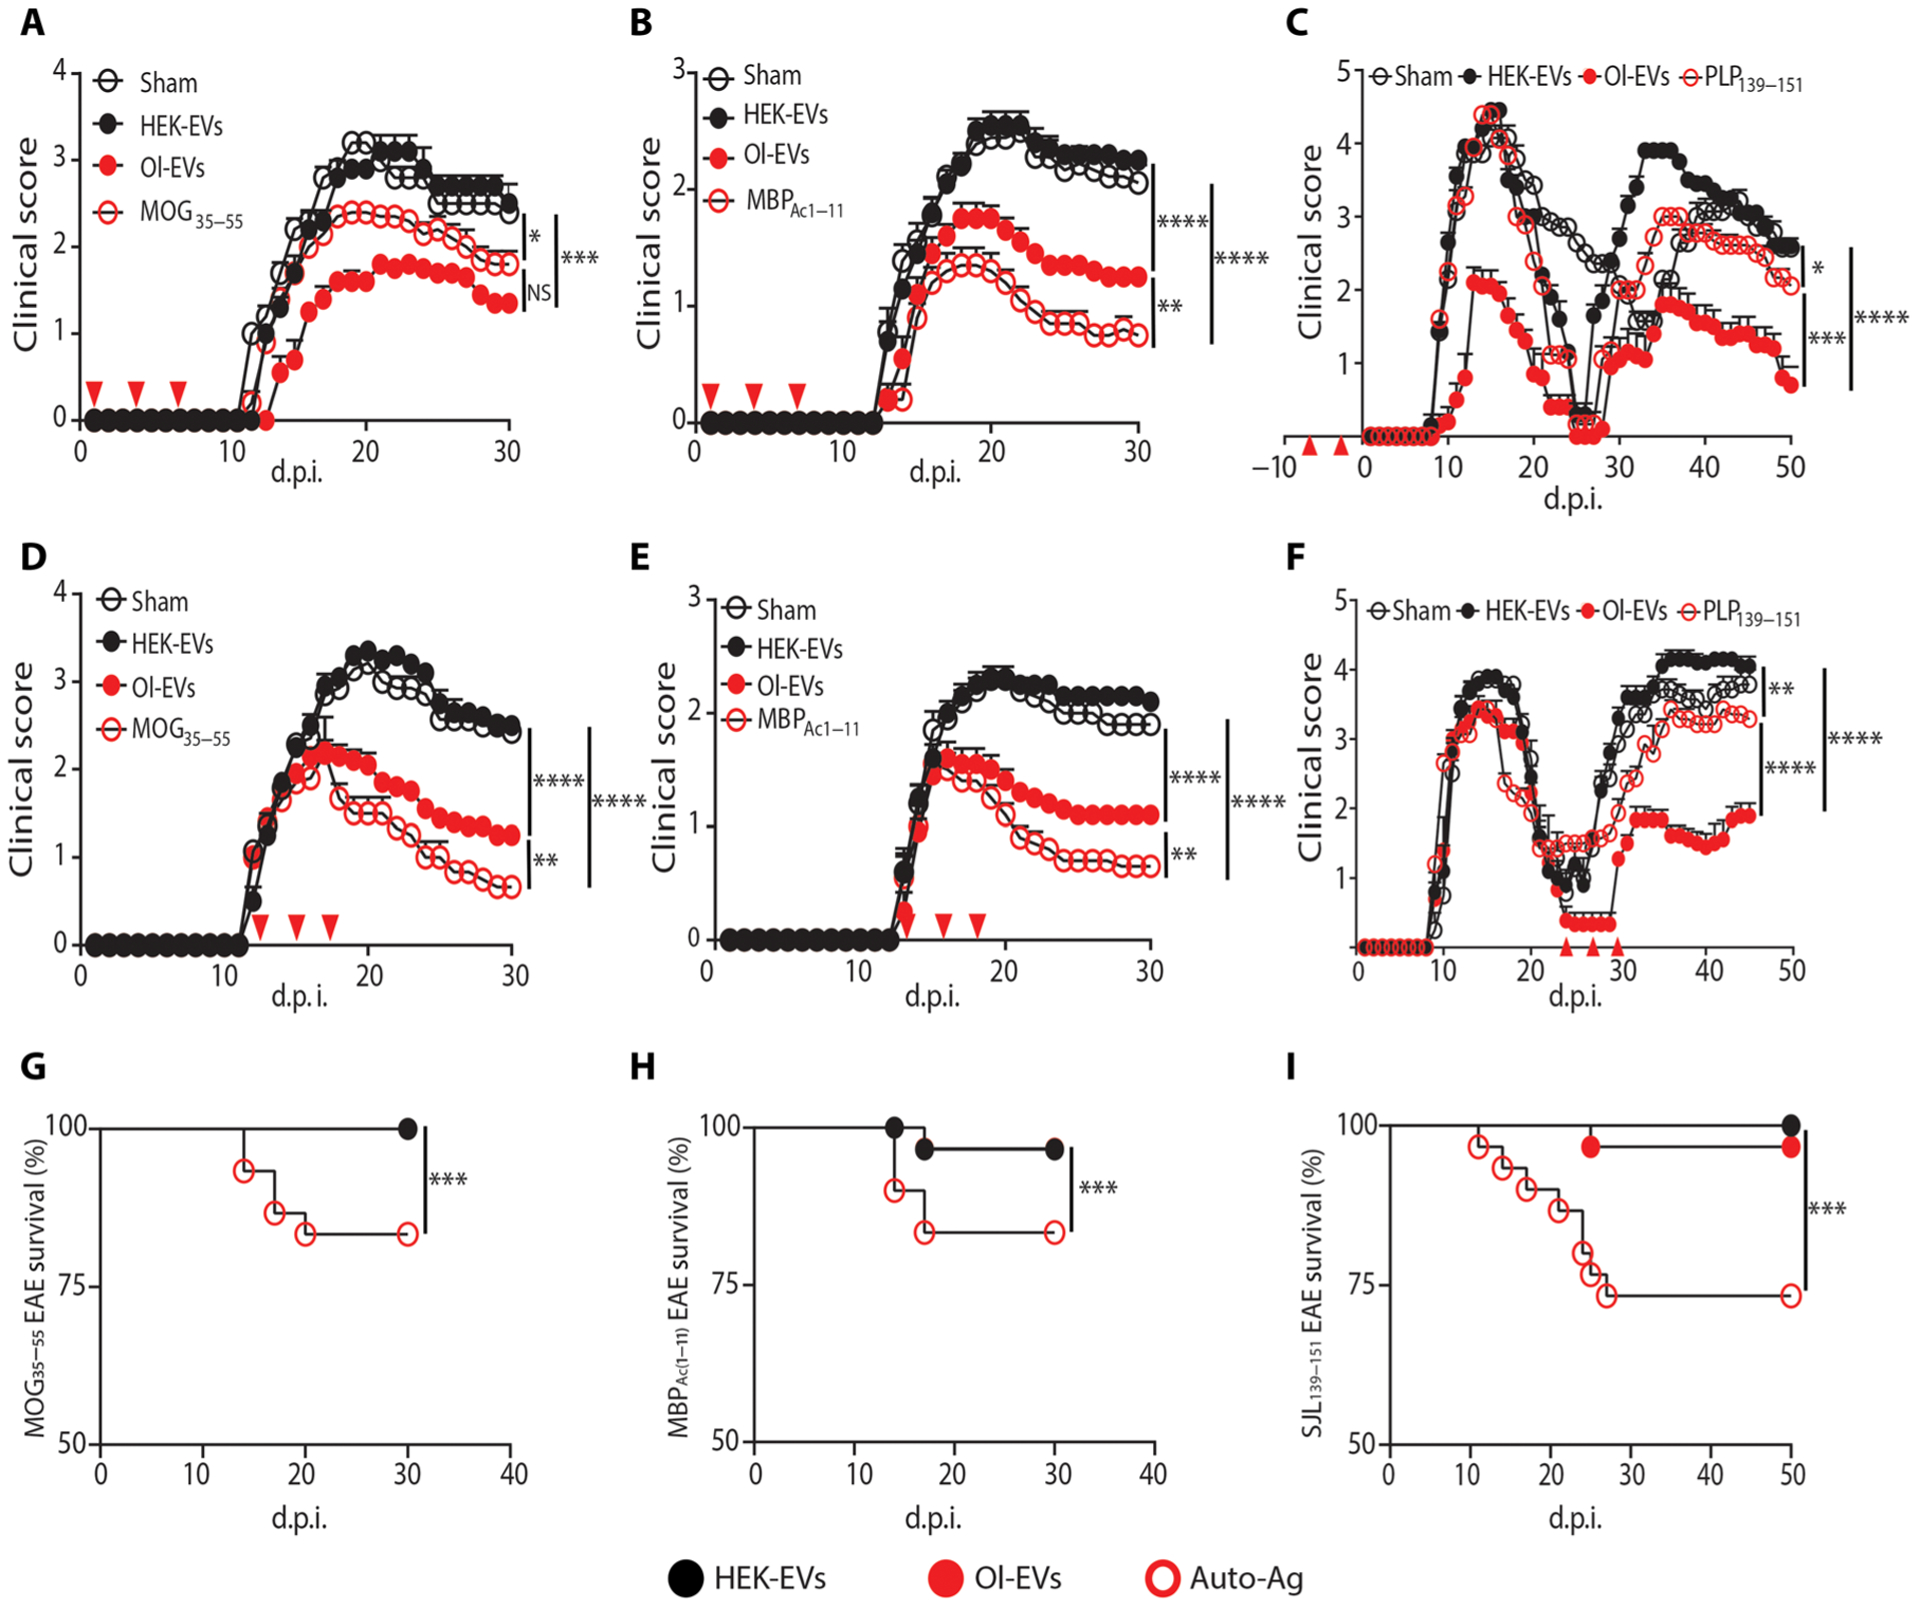
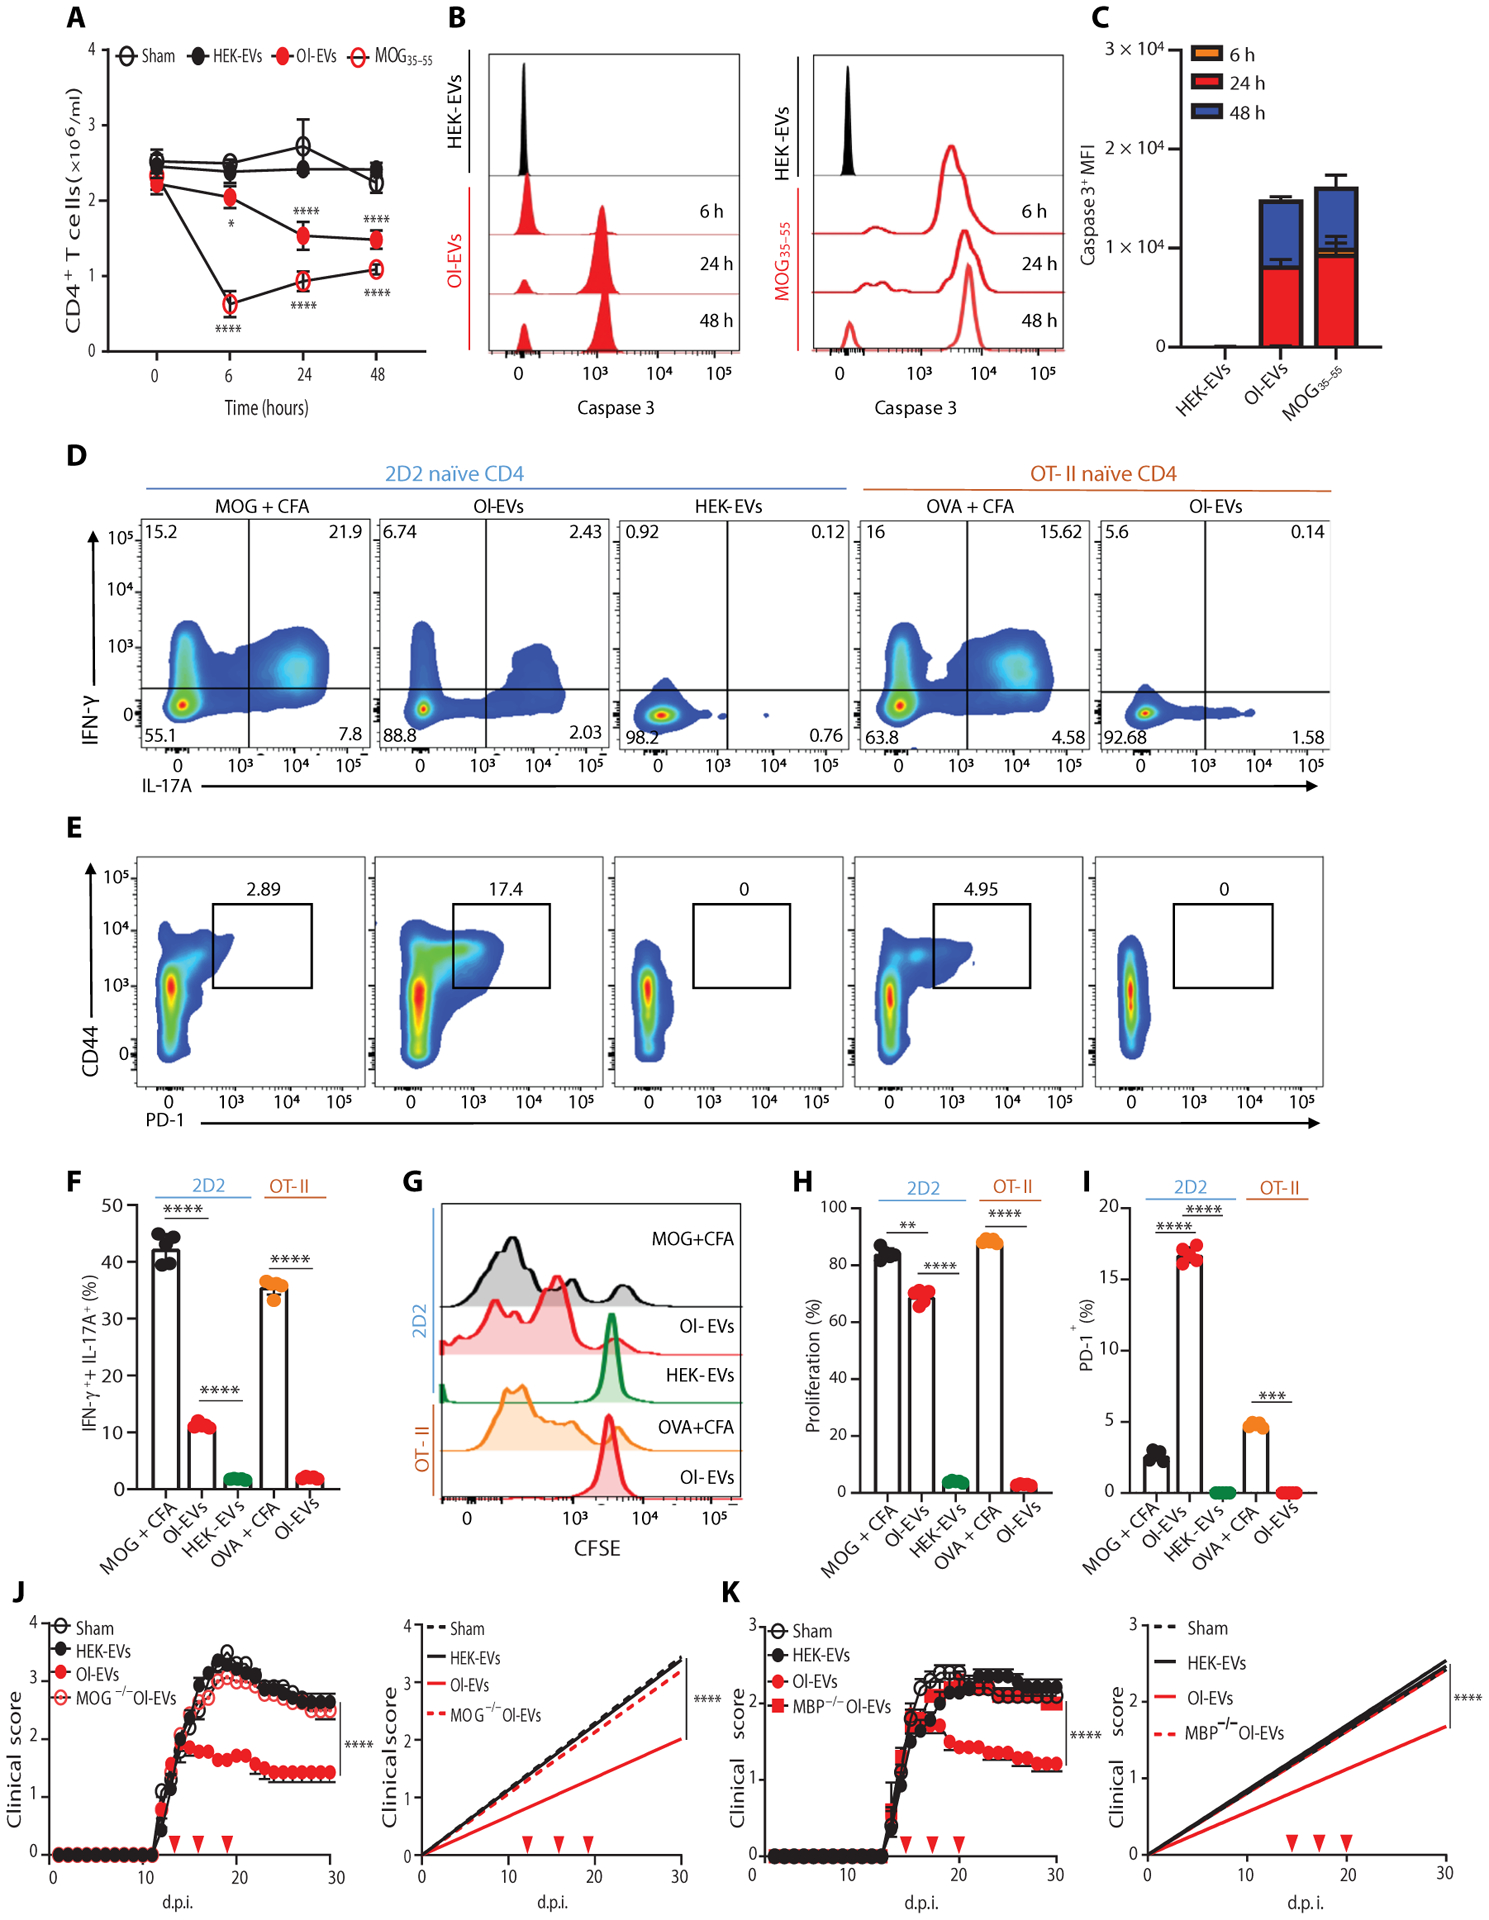
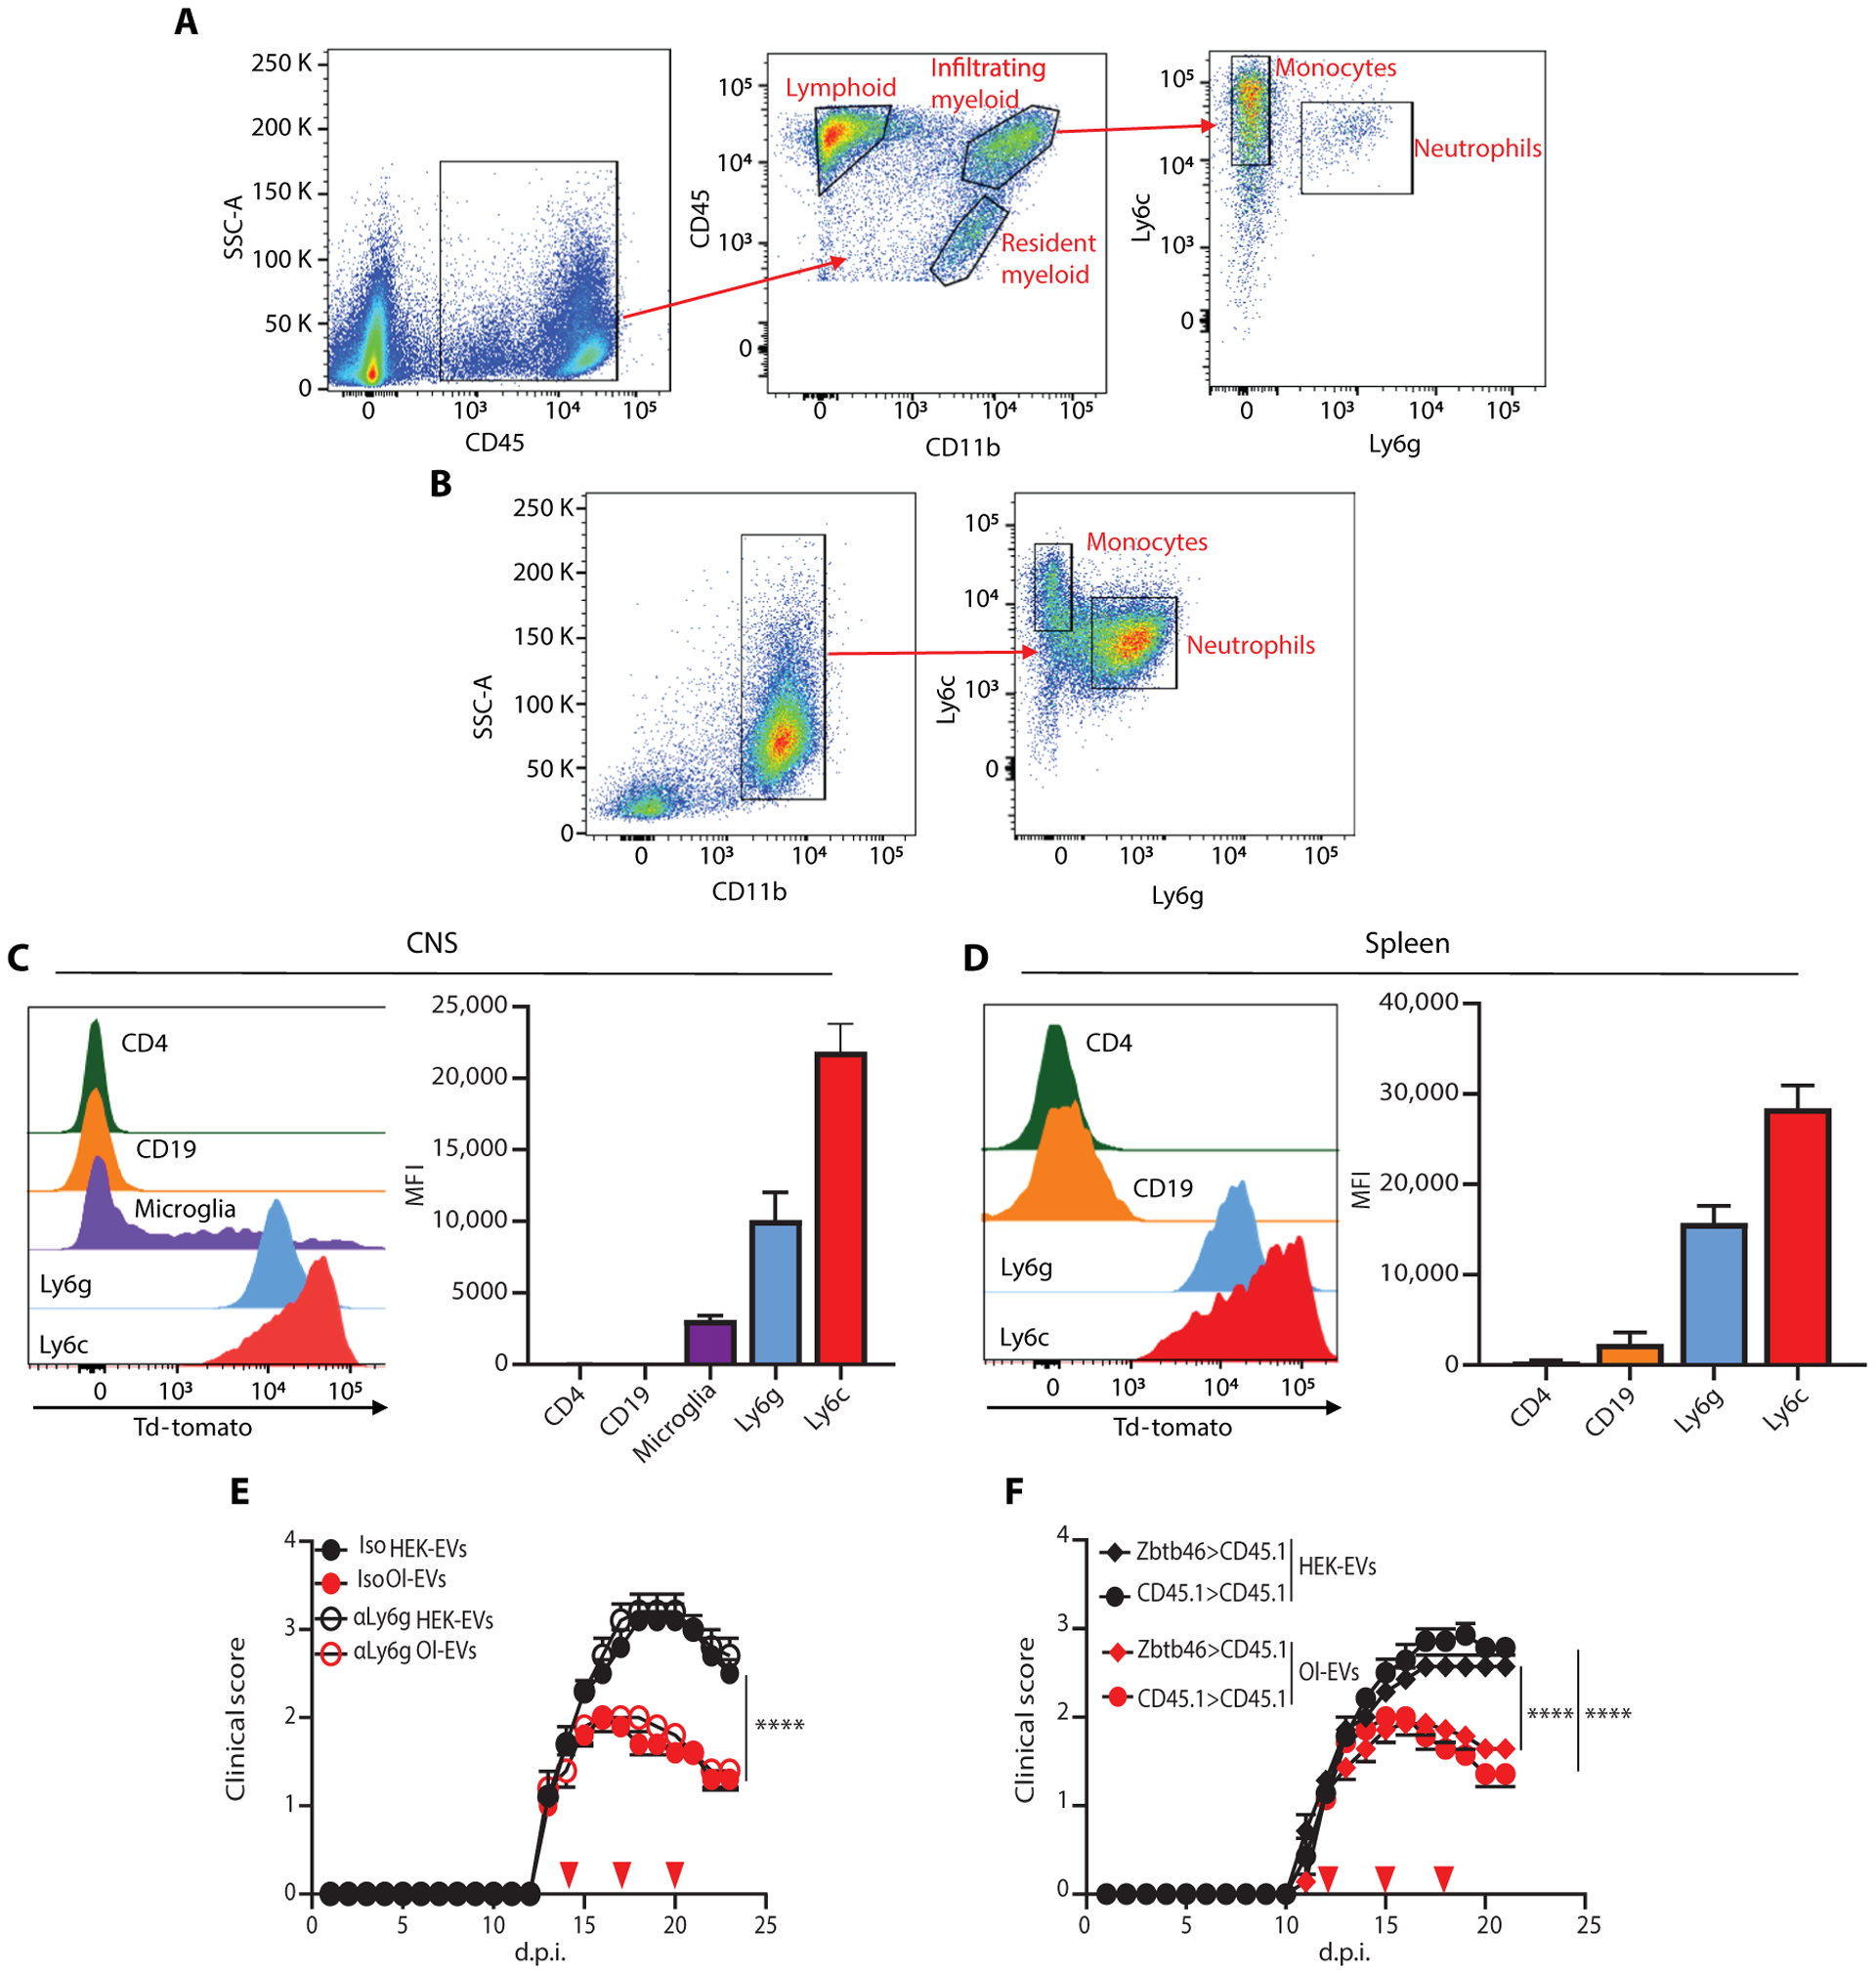
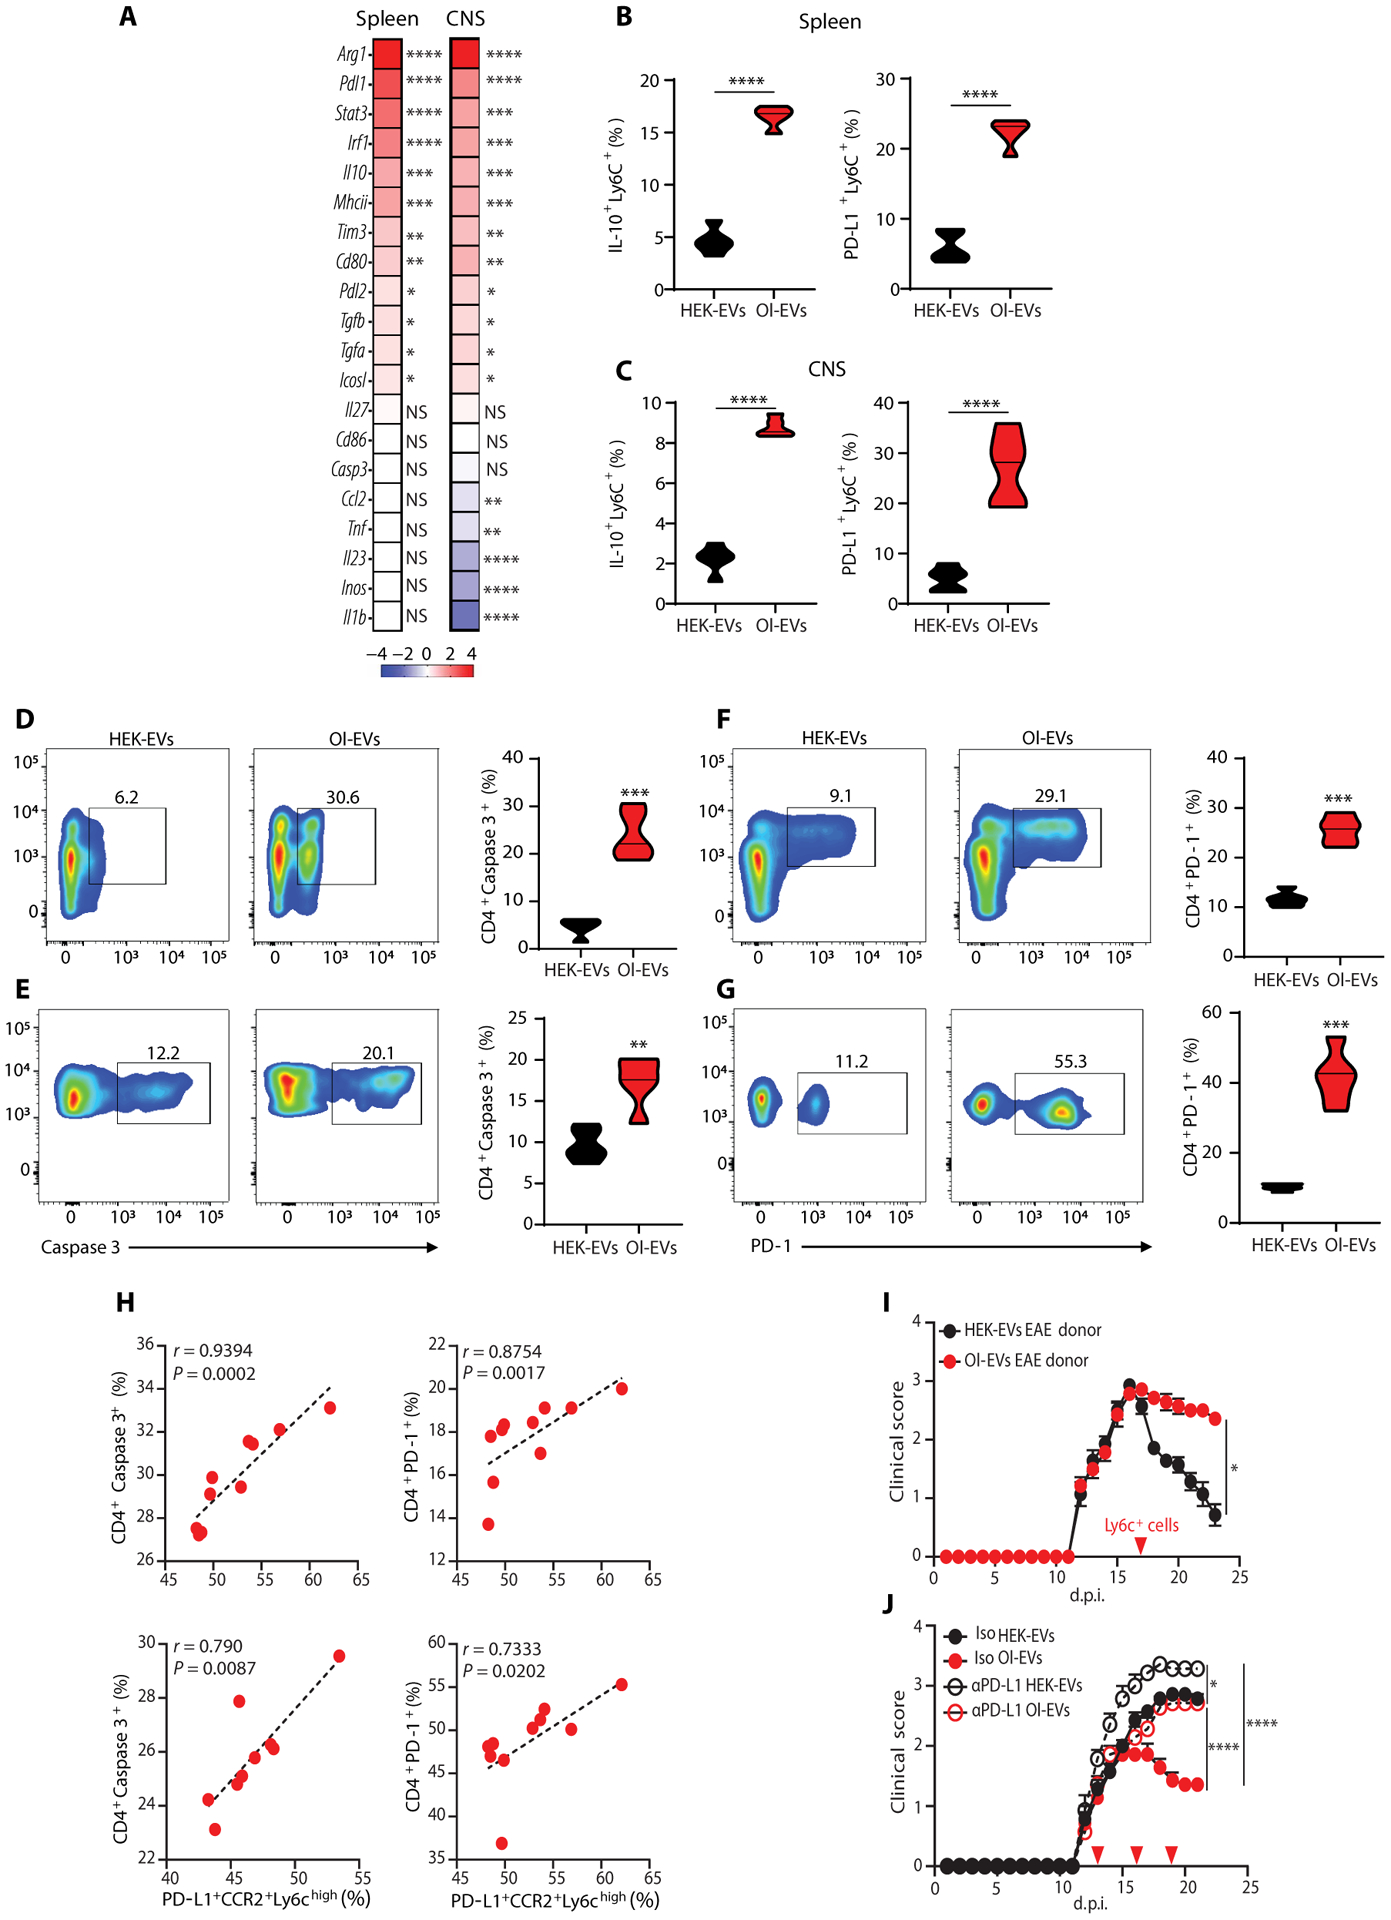
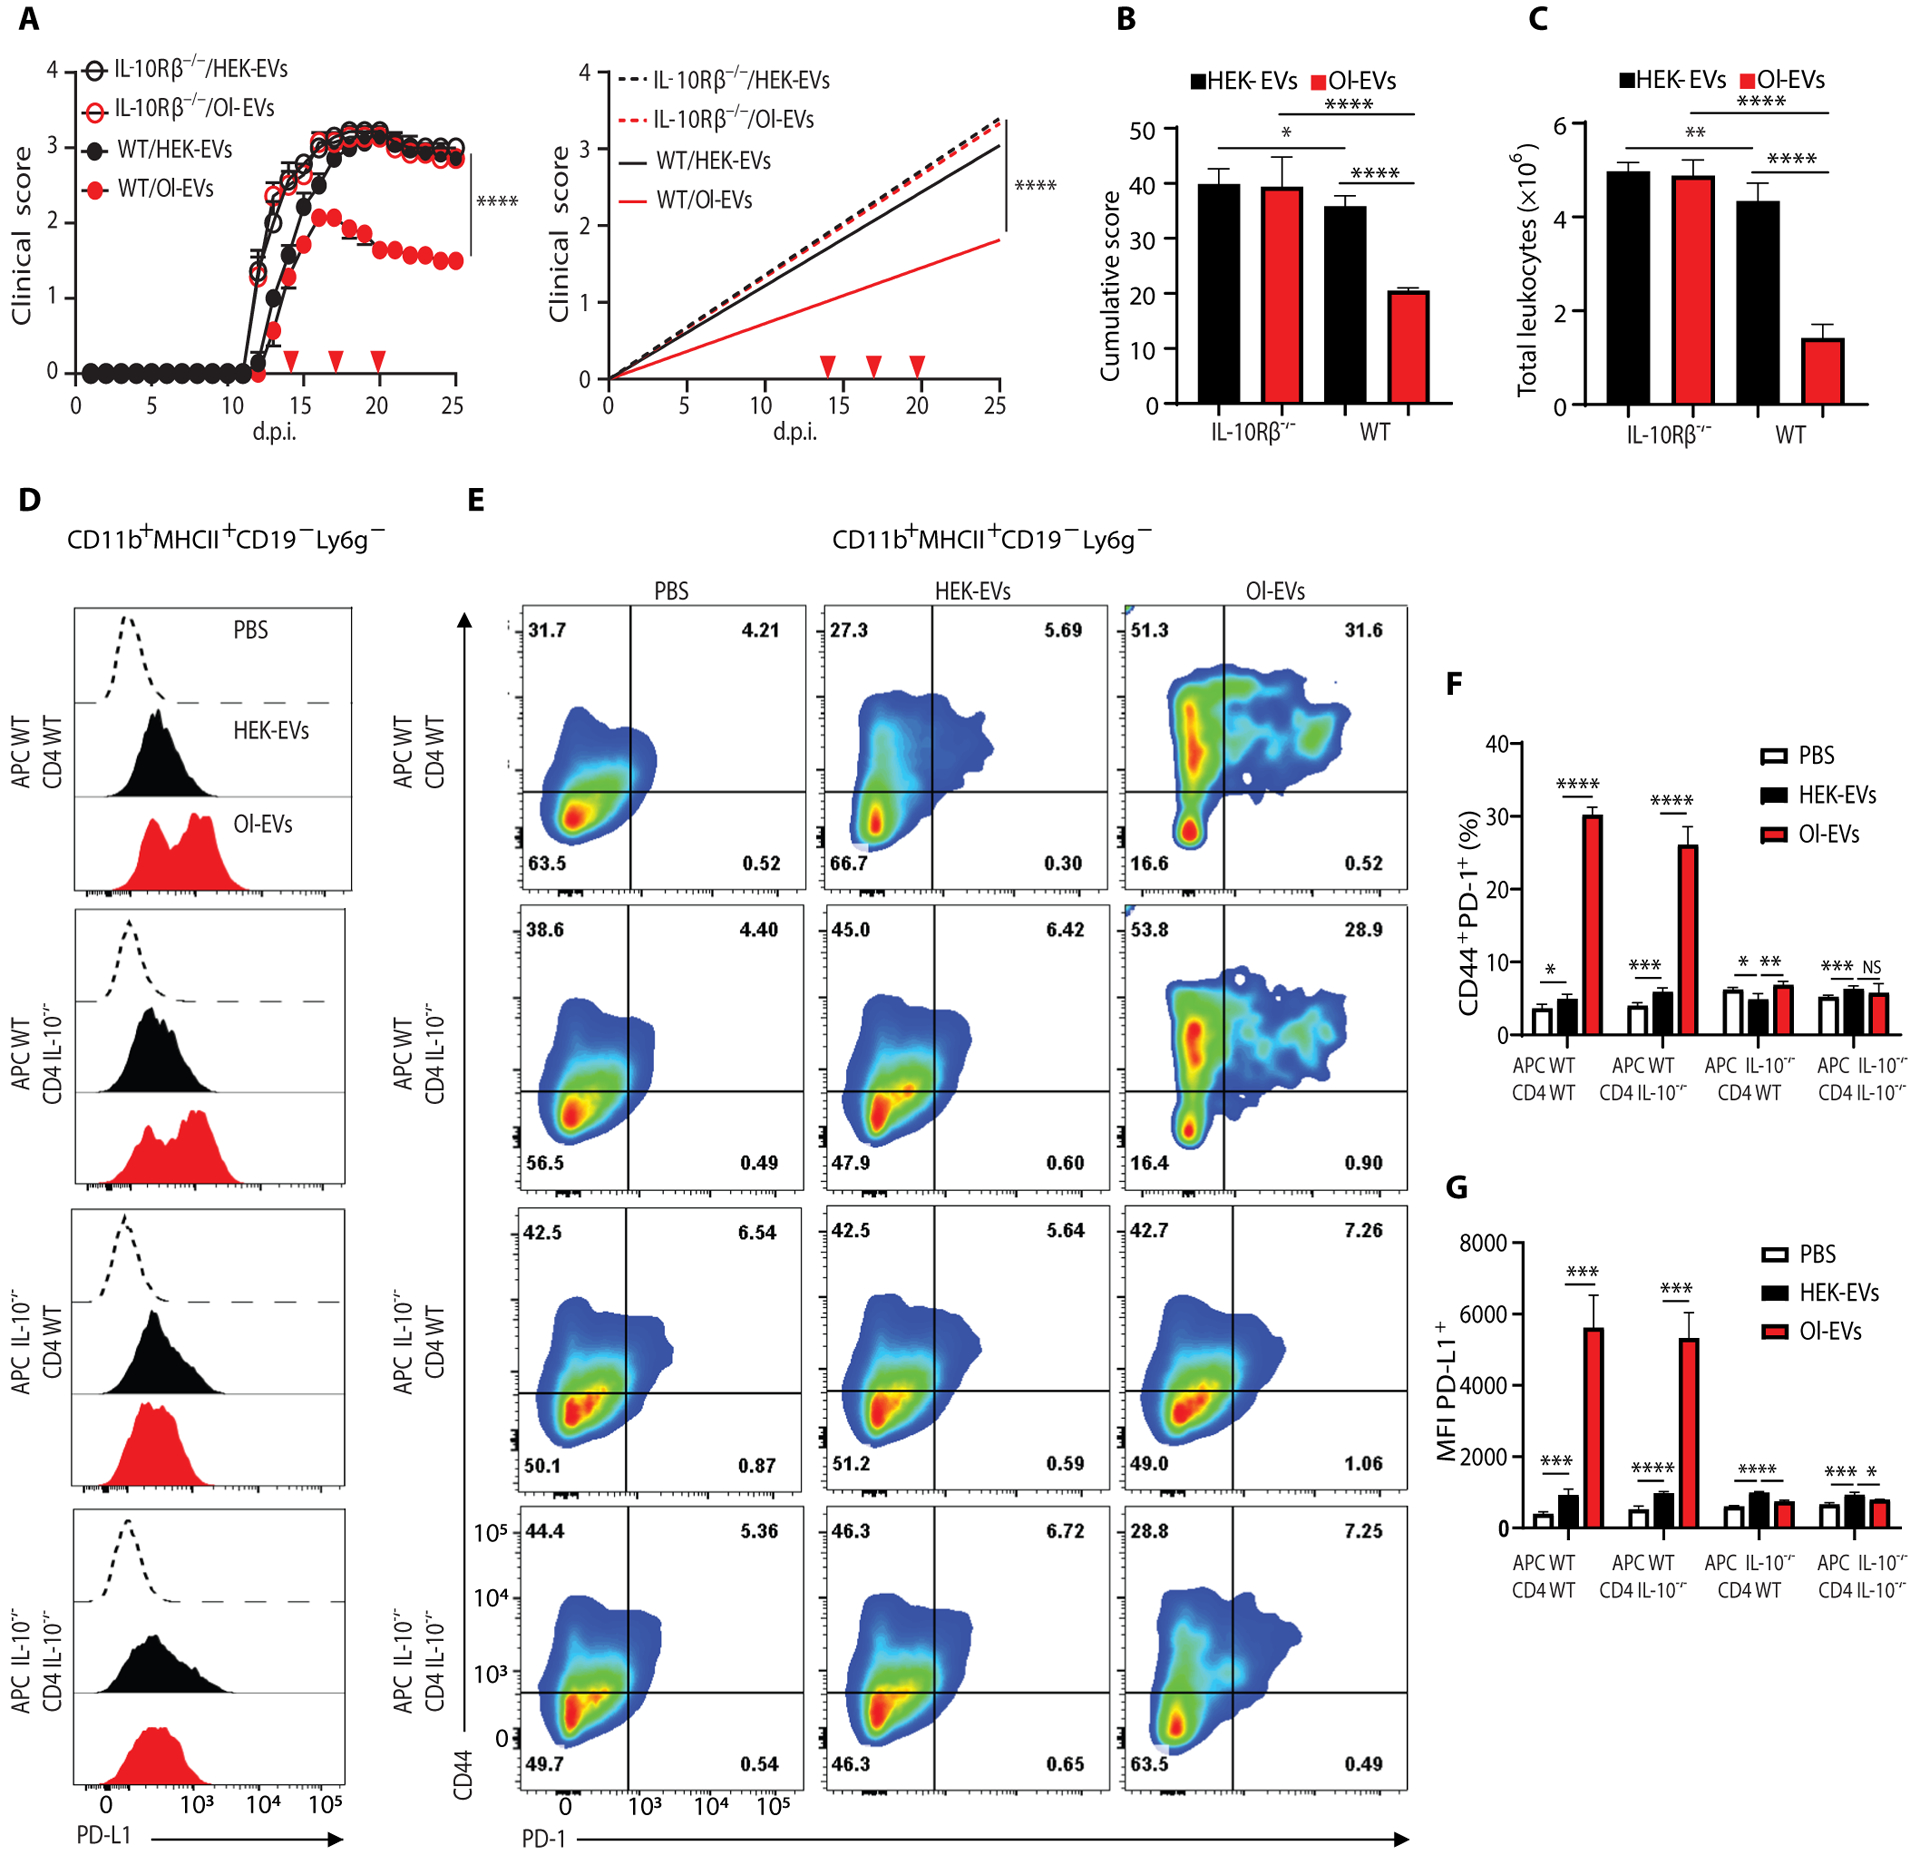
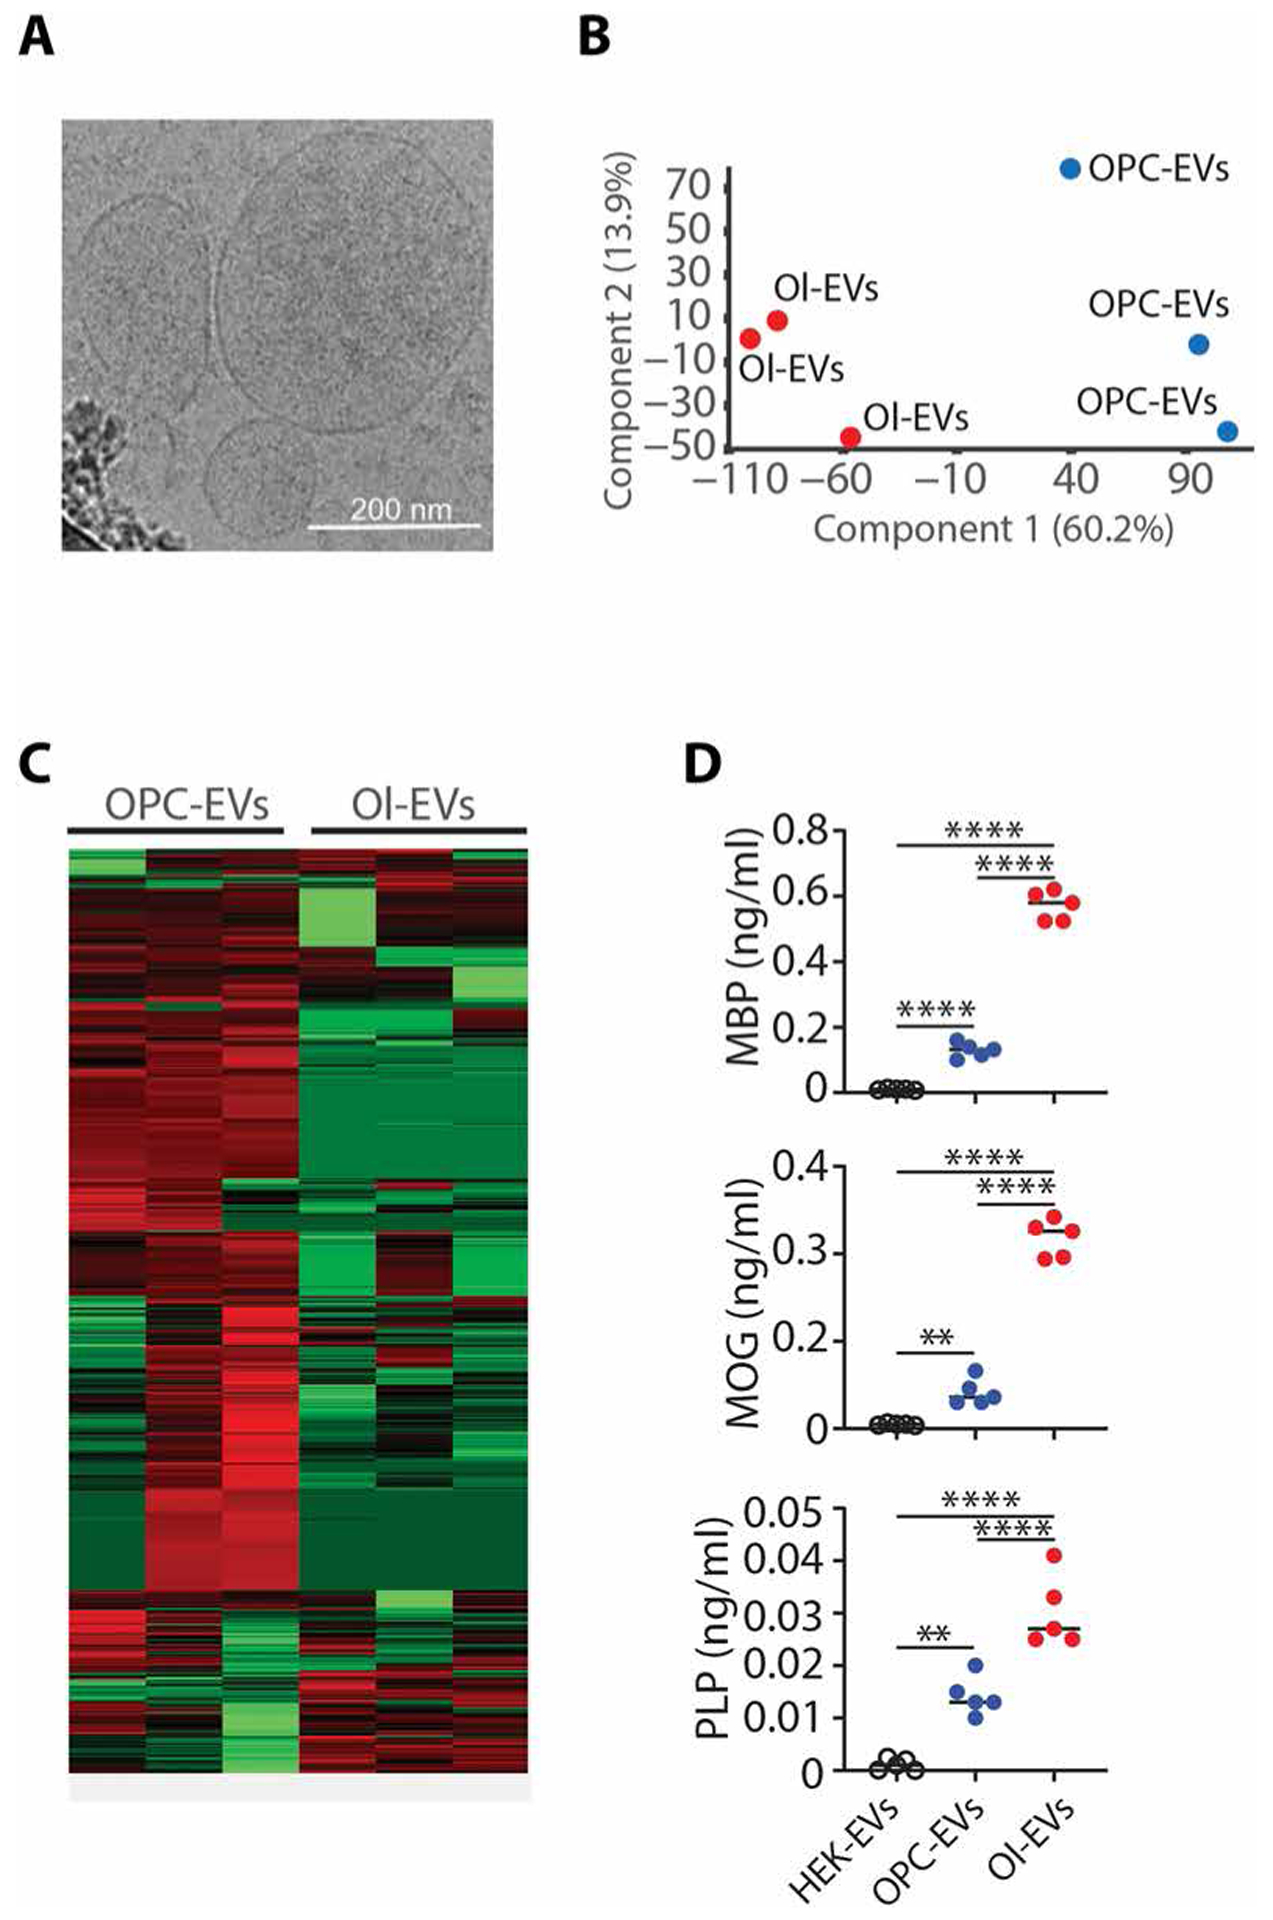
Autoimmune diseases such as multiple sclerosis (MS) develop because of failed peripheral immune tolerance for a specific self-antigen (Ag). Numerous approaches for Ag-specific suppression of autoimmune neuroinflammation have been proven effective in experimental autoimmune encephalomyelitis (EAE), an animal model of MS. One such approach is intravenous tolerance induction by injecting a myelin Ag used for triggering EAE. However, the translation of this and similar experimental strategies into therapy for MS has been hampered by uncertainty regarding relevant myelin Ags in MS patients. To address this issue, we developed a therapeutic strategy that relies on oligodendrocyte (Ol)-derived extracellular vesicles (Ol-EVs), which naturally contain multiple myelin Ags. Intravenous Ol-EV injection reduced disease pathophysiology in a myelin Ag-dependent manner, both prophylactically and therapeutically, in several EAE models. The treatment was safe and restored immune tolerance by inducing immunosuppressive monocytes and apoptosis of autoreactive CD4+ T cells. Furthermore, we showed that human Ols also released EVs containing most relevant myelin Ags, providing a basis for their use in MS therapy. These findings introduce an approach for suppressing central nervous system (CNS) autoimmunity in a myelin Ag-specific manner, without the need to identify the target Ag.


Conflict of interest statement

Competing interests: G.C., A.R., B.C., and G.-X.Z. are inventors on patent applications (62/857,182 and 62/953,257) submitted by Thomas Jefferson University that cover the use of oligodendrocyte-derived extracellular vesicles for therapy of multiple sclerosis.

Figures

Fig. 1.
Fig. 1.. Mature Ols release EVs containing myelin proteins.
(A) Representative immunofluorescence of mature Ol stained for MBP (green), MOG (red), and nuclei (blue). Scale bar, 20 μm; magnification, ×60. (B) Cryo-EM of purified Ol-EVs; scale bar, 200 nm. (C) Heatmap of significantly enriched proteins associated with EVs, according to the MISEV 2018 guideline, from quantitative mass spectrometry analysis. Expression is based on Z-scored label-free quantification and expressed as log2. The mean of three replicates for each condition is shown. (D) Relevant myelin protein content of Ol-EVs determined by mass spectrometry. The mean of three replicates for each condition is shown. Values were compared to OPC-derived EVs and shown as log2. (E) MBP, MOG, and PLP quantification by ELISA (mean ± SEM) in Ol-EV pellet (n = 10 per group). ***P < 0.0005 by one-way ANOVA with Bonferroni’s with post hoc test. (F) Survival curves of naïve C57BL/6 mice intravenously treated with Ol-EVs or HEK-EVs (n = 15 per group). (G) Anti-MOG immunoglobulin (Ig) concentrations in serum of naïve C57BL/6 mice injected with Ol-EVs (red dots) were determined by ELISA (mean ± SEM). Control sera were collected from naïve mice that were not injected (sham, open circles) or from EAE mice immunized with rMOG1–125 (Ctrl+, black dots) (n ≥ 5 per group). All experiments were conducted at least twice. (E and G) ****P < 0.00001 by one- way ANOVA with Bonferroni’s with post hoc test. OD, optical density.
Fig. 2.
Fig. 2.. Ol-EV/i.v. suppress active EAE, prophylactically and therapeutically.
(A to F) About 1010 syngeneic Ol-EVs or HEK-EVs were intravenously injected (red arrows) in C57BL/6, B10.PL, or SJL/J mice, immunized for EAE induction with MOG35–55, MBPAc1–11, or PLP139–151, respectively. Ol-EV treatment was prophylactic (A to C; 1, 4, and 7 day post immunization (d.p.i) in C57BL/6 and B10. PL EAE mice, or −7 and −2 d.p.i. in SJL/J EAE mice) or therapeutic (D to F; 11, 14, and 17 d.p.i. in C57BL/6 and B10.PL EAE mice, or 24, 27, and 30 d.p.i. in SJL/J EAE mice). The peptides MOG35–55 (200 μg per mouse), MBPAc1–11 (400 μg per mouse), and PLP139–151 (100 μg per mouse) were intravenously injected in parallel for comparison. The dose of each peptide/i.v. is the same as the dose used in immunization for EAE induction. These experiments were done at least twice and had similar outcomes (n = 10 mice per group in each experiment). Symbols depict daily mean ± SEM. Data were analyzed by two-way ANOVA with Bonferroni’s multiple comparison; NS (not significant); *P < 0.01; **P < 0.001; ***P < 0.0005; ****P < 0.00001. (G to I) Survival (%) of EAE mice treated as described in (D) to (F), respectively (n = 15 to 30 mice per group). Data were analyzed by Gehan-Breslow-Wilcoxon test, ***P < 0.0001.
Fig. 3.
Fig. 3.. Myelin Ag from Ol-EVs is presented to T cells in vivo, and EAE suppression by Ol-EVs is myelin Ag dependent.
(A) Time course (mean ± SEM) of circulating blood CD4+ T cells at 6, 24, and 48 hours after treating MOG-specific TCR-transgenic mice (2D2) intravenously with Ol-EVs, control HEK-EVs, or MOG35–55 peptide (100 μg) (n = 5 per group in each experiment). (B and C) Caspase 3 expression (mean ± SEM) in circulating blood CD4+ T cells from 2D2 mice injected with Ol-EVs. (D to I) 2D2 or OT-II naïve CD4+ T cells (5 × 10⁶) labeled with CFSE were injected into CD45.1+ recipient mice. After 48 hours, mice were subcutaneously immunized with an emulsion containing MOG35–55 + complete freund’s adjuvant (CFA) or OVA323–339 + CFA or in travenously injected with 1010 HEK-EVs or Ol-EVs. Seventy-two hours later, spleens were collected and CD45.2+ CD4+ T cells (2D2 and OT-II) were analyzed by flow cytometry. (D and F) Cytokine production (IFN-γ and IL-17A), PD-1 expression (E and I), and proliferation (CFSE dilution; G and H) by 2D2 and OT-II cells (mean ± SEM). These experiments were conducted twice with a similar outcome (n = 5 mice per group in each experiment). Data in (A), (F), (H), and (I) were analyzed by two-way ANOVA with Bonferroni’s post hoc test; *P < 0.05; **P < 0.001; ***P < 0.0005; ****P < 0.00001. Unpaired t test (for OT-II CD4+ T cell groups); ***P < 0.0001; P < 0.00001. (J) About 1010 Ol-EVs from MOG-deficient Ols, control Ols, HEK-EVs, or PBS (sham) were intravenously injected into MOG35–55-immunized C57BL/6 mice. Injections were given on d.p.i. indicated by red arrows in the figure. (K) Ol-EVs from either WT (MBP+/+) or MBP−/− (shiverer mice) B10.PL Ols were intravenously injected into B10.PL EAE mice immunized with MBPAc(1–11). Control mice were injected with HEK-EVs or PBS (sham). These experiments were conducted twice with similar outcomes (n = 5 to 7 mice per group in each experiment). Symbols depict daily mean ± SEM. Data were analyzed by two-way ANOVA with Bonferroni’s multiple comparison; ****P < 0.00001.
Fig. 4.
Fig. 4.. Ol-EVs are uptaken by monocytes, neutrophils, and cDCs, but the latter two are dispensable for EAE suppression by Ol-EVs.
(A and B) Gating strategy identifying Td-tomato+ CD11b+ neutrophils (Ly6g+Ly6c+) and monocytes (Ly6gLy6c+) from the CNS and spleen. These experiments were done twice with similar outcomes (n = 5 mice per group in each experiment). (C and D) Transgenic C57BL/6 Rosa26.stop.Td-tomato mice immunized with MOG35–55 were intravenously injected at disease onset with about 1010 Ol-EVs containing Cre recombinase or HEK-EVs also containing Cre. Two days later, spleen and CNS cells were analyzed by flow cytometry. Representative histogram of CD4+ T cells, B cells (CD19+), microglia (CD45low Ly6cCD11b+), neutrophils (Ly6g+), and monocytes (Ly6c+) expressing Td-tomato in the spleen (C) and CNS (D). The distribution of Td-tomato+ cells from mice injected with Cre+ HEK-EVs and Cre+ Ol-EVs (shown) was similar. MFI, mean fluorescence intensity. (E) C57BL/6 EAE mice were depleted of neutrophils by intraperitoneal injections of anti-Ly6g Ab (clone 1A8, 200 μg per mouse per injection) at disease onset (13 and 16 d.p.i.). Control mice were injected with isotype control Ab. Ol-EVs or HEK-EVs were intravenously injected 14, 17, and 20 d.p.i. (red arrows). Symbols depict daily mean ± SEM. (F) CD45.1+ mice were irradiated and transplanted with Zbtb46 iDTR or CD45.1+ bone marrow and immunized with MOG35–55. cDC depletion (Zbtb46+MHCII+CD11c+) was accomplished by intraperitoneally injecting DTX (20 ng/g) every third day after EAE onset. Ol-EVs or HEK-EVs were intravenously injected at 13, 15, and 18 d.p.i. (red arrows). Symbols depict daily mean ± SEM. All EAE experiments were conducted at least twice with similar outcomes (n = 5 to 7 mice per group). EAE experiments were analyzed by two-way ANOVA with Bonferroni’s multiple comparison; ****P < 0.00001.
Fig. 5.
Fig. 5.. Ol-EVs induce immunosuppressive moDCs.
(A) Splenic and CNS monocytes (CD45+CD11b+ Ly6chighCCR2+Ly6gTd-tomato+) were sorted from Rosa26.stop.Td-tomato EAE mice 2 days after Cre+HEK-EV or Cre+Ol-EV injection, and gene expression analysis was performed by quantitative PCR (qPCR). Values are normalized relative to monocytes of Cre+ HEK-EV-treated mice and shown as log2. Data were analyzed using unpaired t test; not significant (NS); *P < 0.05; **P < 0.001; ***P < 0.0005; ****P < 0.00001. (B and C) Percentages (mean ± SEM) of splenic and CNS IL-10+ and PD-L1+ monocytes from EAE mice that received HEK- or Ol-EVs (n = 5 mice per group in each experiment). Data were analyzed using unpaired t test; ****P < 0.00001. (D to G) Flow cytometry analysis for caspase 3 and PD-1 (mean ± SEM) in splenic and CNS CD4+ T cells of EAE mice injected with HEK- or Ol-EVs, three times, starting at disease onset. Data were analyzed using unpaired t test; **P < 0.001; ***P < 0.0005. These experiments were conducted twice with similar outcomes (n = 5 mice per group in each experiment). (H) Spearman’s r correlation analysis of splenic and CNS monocytes (PD-L1+ CCR2+Ly6c+) with caspase 3+ and PD-1+ CD4 T cells (n = 10). (I) C57BL/6 EAE mice were transplanted at the peak of disease with 2 × 10⁶ sorted Td-tomato+ moDCs (red arrow) from the CNS of EAE mice treated with Ol-EVs (red) or HEK-EVs (black). (J) C57BL/6 EAE mice were intraperitoneally injected with blocking anti-PD-L1 Ab (200 μg per mouse per injection; clone 10F.9G2), or isotype control Ab, on 12 and 15 d.p.i. HEK- or Ol-EVs were intravenously injected on 13, 16, and 19 d.p.i. (red arrows). Symbols depict daily mean ± SEM. All EAE experiments were conducted at least twice with similar outcomes (n = 7 mice per group). EAE experiments were analyzed in (I) by Mann-Whitney test; *P < 0.01. In (J), by two-way ANOVA with Bonferroni’s multiple comparison; *P < 0.01 and ****P < 0.00001.
Fig. 6.
Fig. 6.. Ol-EVs induce PD-L1 in an IL-10-dependent manner.
(A) Clinical course of WT and IL-10Rβ−/− EAE mice injected three times (red arrows) with about 1010 Ol-EVs or HEK-EVs. EAE experiments were conducted at least twice with similar outcomes (n = 7 mice per group). Data were analyzed by two-way ANOVA with Bonferroni’s multiple comparison; ****P < 0.00001. (B) Cumulative score of disease severity (mean ± SEM). (C) Mice were sacrificed at day 25 post immunization (p.i.), and numbers of CD45+ leukocytes obtained from the CNS were determined by flow cytometry and hemocytometer. Data are expressed as mean values ± SEM from n = 7 per group in each experiment. (D to G) APCs and total CD4+ T cells were isolated from the spleen and lymph nodes of MOG35–55-immunized WT and IL-10−/− mice at 10 d.p.i. Mismatched cell cocultures (WT APC + WT CD4+; WT APC + IL-10−/− CD4; IL-10−/− APC + WT CD4+; IL-10−/− APC + IL-10−/− CD4+) were treated for 3 days with Ol-EVs, HEK-EVs, or PBS. Flow cytometric analysis for PD-L1 expression in monocytes/dendritic cells (CD11b+MHCII+CD19Ly6g) (D and F) and for PD-1 in CD4+ T cells (E and G). These experiments were conducted twice with similar outcomes. Data are expressed as mean values ± SEM from n = 5 per group in each experiment. (B, C, F, and G) *P < 0.05; **P < 0.01; ***P < 0.0005; ****P < 0.00001 by two-way ANOVA with Bonferroni’s post hoc test.
Fig. 7.
Fig. 7.. hOls release EVs containing multiple myelin proteins.
(A) Cryo-EM of purified hOl-EVs; scale bar, 200 nm. (B) Principal components analysis of mass spectrometry data showing relatedness of OPC-EVs and Ol-EVs. (C) Heatmap showing expression quantity of proteins present in OPC and Ol-EVs. (D) Concentrations (mean ± SEM) of myelin proteins (MBP, MOG, and PLP) in HEK-, hOPC-, and hOl-EV pellets measured by ELISA. **P < 0.001; ****P < 0.00001 by one-way ANOVA with Bonferroni’s post hoc test.

Similar articles

Cited by

References

    1. Faissner S, Plemel JR, Gold R, Yong VW, Progressive multiple sclerosis: From pathophysiology to therapeutic strategies. Nat. Rev. Drug Discov 18, 905–922 (2019). - PubMed
    1. International Multiple Sclerosis Genetics Consortium, Multiple sclerosis genomic map implicates peripheral immune cells and microglia in susceptibility. Science 365, eaav7188 (2019). - PMC - PubMed
    1. Steinman L, Ho PP, Robinson WH, Utz PJ, Villoslada P, Antigen-specific tolerance to self-antigens in protein replacement therapy, gene therapy and autoimmunity. Curr. Opin. Immunol 61, 46–53 (2019). - PubMed
    1. Serra P, Santamaria P, Antigen-specific therapeutic approaches for autoimmunity. Nat. Biotechnol 37, 238–251 (2019). - PubMed
    1. Zwhang G-X, Yu S, Calida D, Zhao Z, Gran B, Kamoun M, Rostami A, Loss of the surface antigen 3G11 characterizes a distinct population of anergic/regulatory T cells in experimental autoimmune encephalomyelitis. J. Immunol 176, 3366–3373 (2006). - PubMed

Publication types

Substances