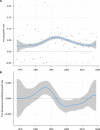
Violent encounters between social units hinder the growth of a high-density mountain gorilla population
- PMID: 33148636
- PMCID: PMC7673674
- DOI: 10.1126/sciadv.aba0724
Violent encounters between social units hinder the growth of a high-density mountain gorilla population
Abstract
Density-dependent processes such as competition for resources, migration, predation, and disease outbreaks limit the growth of natural populations. The analysis of 50 years of mountain gorilla data reveals that social behavior changes observed at high group density may also affect population growth in social species. A sudden increase in social group density observed in 2007 caused a threefold increase in the rate of violent encounters between social units (groups and solitary males). A fivefold increase in the rate of infanticide and seven cases of lethal fights among mature males were subsequently recorded, and the annual subpopulation growth rate declined by half between 2000 and 2017. The increase in infanticide alone explains 57% of this decline. These findings highlight the complex relationship between population density and growth in social species and hold important implications for the management of island populations.
Copyright © 2020 The Authors, some rights reserved; exclusive licensee American Association for the Advancement of Science. No claim to original U.S. Government Works. Distributed under a Creative Commons Attribution NonCommercial License 4.0 (CC BY-NC).
Figures


References
-
- Barlow J., Lennox G. D., Ferreira J., Berenguer E., Lees A. C., Nally R. M., Thomson J. R., Frosini de Barros Ferraz S., Louzada J., Oliveira V. H. F., Parry L., Ribeiro de Castro Solar R., Vieira I. C. G., Aragão L. E. O. C., Begotti R. A., Braga R. F., Cardoso T. M., Cosme de Oliveira R. Jr., Souza C. M. Jr., Moura N. G., Nunes S. S., Siqueira J. V., Pardini R., Silveira J. M., Vaz-de-Mello F. Z., Veiga R. C. S., Venturieri A., Gardner T. A., Anthropogenic disturbance in tropical forests can double biodiversity loss from deforestation. Nature 535, 144–147 (2016). - PubMed
-
- Chamaillé-Jammes S., Fritz H., Valeix M., Murindagomo F., Clobert J., Resource variability, aggregation and direct density dependence in an open context: The local regulation of an African elephant population. J. Anim. Ecol. 77, 135–144 (2008). - PubMed
-
- Simberloff D., The role of science in the preservation of forest biodiversity. For. Ecol. Manage. 115, 101–111 (1999).
-
- Wintle B. A., Kujala H., Whitehead A., Cameron A., Veloz S., Kukkala A., Moilanen A., Gordon A., Lentini P. E., Cadenhead N. C. R., Bekessy S. A., Global synthesis of conservation studies reveals the importance of small habitat patches for biodiversity. Proc. Natl. Acad. Sci. U.S.A. 116, 909–914 (2019). - PMC - PubMed
-
- Debinski D. M., Holt R. D., A survey and overview of habitat fragmentation experiments. Conserv. Biol. 14, 342–355 (2000).

