. 2020 Nov 4;6(45):eabb6030.
doi: 10.1126/sciadv.abb6030. Print 2020 Nov.

Spider silk self-assembly via modular liquid-liquid phase separation and nanofibrillation

Affiliations

Spider silk self-assembly via modular liquid-liquid phase separation and nanofibrillation

Ali D Malay et al. Sci Adv. .

Abstract

Spider silk fiber rapidly assembles from spidroin protein in soluble state via an incompletely understood mechanism. Here, we present an integrated model for silk formation that incorporates the effects of multiple chemical and physical gradients on the different spidroin functional domains. Central to the process is liquid-liquid phase separation (LLPS) that occurs in response to multivalent anions such as phosphate, mediated by the carboxyl-terminal and repetitive domains. Acidification coupled with LLPS triggers the swift self-assembly of nanofibril networks, facilitated by dimerization of the amino-terminal domain, and leads to a liquid-to-solid phase transition. Mechanical stress applied to the fibril structures yields macroscopic fibers with hierarchical organization and enriched for β-sheet conformations. Studies using native silk gland material corroborate our findings on spidroin phase separation. Our results suggest an intriguing parallel between silk assembly and other LLPS-mediated mechanisms, such as found in intracellular membraneless organelles and protein aggregation disorders.


Figures

Fig. 1
Fig. 1. Rational design of biomimetic MaSp2 constructs.
(A) Strategy for iterated expansion of tandem repeat domains. R1 and R2 correspond to repeat modules encoding identical amino acid sequences but with differing nucleotide sequences. The inset shows sequences relevant to the cloning method, including Bam HI and Fba I restriction sites and Gly-Ser (GS) coding regions flanking the repeats. (B) Expression of recombinant MaSp2 for constructs bearing 1 to 12 repeats, visualized by SDS-PAGE. The overexpressed band in each lane corresponds to MaSp2. Molecular weights are indicated in kDa. (C) Amino acid sequence analysis of recombinant MaSp2. The primary structure of N-R6-C is illustrated on the left, with the overall architecture depicted on top, consisting of the NTD (green), repeat units (dotted line), and the CTD (yellow). The predicted α-helical regions in the terminal domains are depicted as solid blocks. The distribution of cationic (blue) and anionic residues (red) is shown, and an asterisk indicates the Cys residue in the CTD involved in disulfide bonding. Below are plots depicting the hydropathy (blue), predicted disordered regions via IUPred2 (green), and predicted prion-like regions using PLAAC (orange). Pie charts on the right depict the relative abundance of amino acids for the entire N-R6-C sequence (top) and for the 29-residue repeat module (bottom), demonstrating the low diversity of residue types.
Fig. 2
Fig. 2. Multivalent anions induce LLPS in MaSp2.
(A) Purified MaSp2 [85 μM N-R6-C in 20 mM tris-HCl (pH 7.5), 150 mM NaCl] became turbid upon adding KPi, pH 7.3 (to 0.4 M), with the turbidity varying with temperature. Upon centrifugation, sample separated into LDP and HDP (inset). (B) SDS-PAGE of 1-μl aliquots from LDP and HDP in (A) shows the partitioning of MaSp2 into the HDP, with HDP:LDP ratio above 100:1. (C) Microscopic droplets formed immediately in a mixture of N-R6-C (4.5 mg/ml) and 1.0 M KPi (pH 7); scale bar, 20 μm. (D) Phase separation maps as a function of MaSp2 and KPi (pH 7.5) concentration, for the different domain constructs. All measurements were taken at 23°C against a background of 0.1 M NaCl. Two-phase conditions (LLPS) are on the upper-right section of each curve (illustrated with shading for N-R6-C). (E) Ion dependence of LLPS induction. Each sample contained N-R12-C (25 mg/ml) and 0.4 M of different salts as indicated. Samples were mixed and centrifuged, and the protein concentration in the upper surface (corresponding to LDP in case of LLPS) was measured by OD280. Columns are colored by anion species. (F and G) LLPS transitions in N-R12-C (25 μM) with KPi, pH 7.5, were measured by temperature-dependent turbidity shifts. (F) LCST-type behavior of MaSp2, showing high sensitivity to KPi concentration (indicated). Light blue line shows measurements in the absence of KPi. (G) Samples were subjected to two heating cycles (with intermittent cooling), at either 4° to 40°C (blue) or 4° to 50°C (green), in 0.3 M KPi. Samples subjected to 4° to 40°C cycling displayed reversible LLPS, whereas heating to 50°C destroyed this reversibility (H) Scanning electron microscopy image showing solidified LLPS aggregates upon heating the MaSp2/KPi mixture to 70°C for 10 min. Scale bar, 10 μm.
Fig. 3
Fig. 3. Acidification triggers rapid self-assembly of MaSp2 nanofibrils.
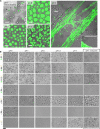
(A) N-R12-C labeled with DyLight 488 (10 to 20 mg ml−1 final concentration) was mixed into 0.5 M KPi at the indicated pH values and visualized by confocal laser scanning microscopy. Upon mixing of the components, MaSp2 rapidly separated from the aqueous fraction (green structures), eventually settling on the glass surface. At pH 7 and 8, the MaSp2 condensates appear as LLPS droplets undergoing dynamic fusion, while at pH 6, the resultant structures are static with a semisolid appearance. The reaction at pH 5 leads to rapid self-assembly of MaSp2 into frequently aligned, extended fibril networks. The inset shows an individual fibril at pH 5 with a diameter of ~100 nm. Scale bars, 10 μm. (B) Different MaSp2 constructs were assessed for their ability to undergo phosphate-induced LLPS and pH-induced fibril self-assembly. Purified MaSp2 (150 μM final concentration) was mixed into a drop of 0.5 M KPi at the indicated pH values on a glass slide. All images in the unboxed region (left) were taken within 30 s of mixing. The boxed region on the right shows the end point of the pH 5 reactions, taken 30 min after initiation. All images were taken at the same scale; scale bar, 10 μm.
Fig. 4
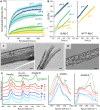
Fig. 4. Probing material state changes in MaSp2 condensates.
(A) FRAP of MaSp2 condensates formed by mixing labeled N-R12-C in 0.15 M NaCl with 1.0 M KPi at the indicated pH values. Normalized fluorescence intensities are plotted against time elapsed after photobleaching, with the SDs depicted as shaded regions. The dotted line indicates mean intensity before bleaching. (B) Viscoelastic creep measurements as a function of pH. Creep compliance values, J(t), were measured against time for wild-type N-R6-C (left) and NA72R-R6-C (right) in 1.0 M KPi at the indicated pH values. (C and D) Light micrographs of MaSp2 fibers produced via biomimetic methods. Fibers were immersed in Milli-Q water before imaging, which produced some swelling. Scale bars, 10 μm. (C) Hierarchical structure of N-R12-C fibers, showing nanofibrils aligned along the longitudinal axis of the fiber, with a fracture surface shown in the right image. (D) Fibers generated from NA72R-R12-C lacked a hierarchically aligned structure, with an interior appearing to consist of solidified LLPS droplets. (E) Representative Raman spectra for N-R1-C and N-R12-C structures under three conditions: (i) LLPS droplets (in 0.5 M KPi, pH 7), (ii) fibril networks (in 0.5 M KPi, pH 5), and (iii) biomimetic fibers prepared as in (C). Dragline silk fiber from T. clavata (green) is included as a reference. Right: Close-up views of the amide I and III regions. In the N-R12-C fiber, the shift in the amide I peak with a shoulder at ~1662 cm−1 and the amide III peak at ~1242 cm−1 signals the emergence of β-sheet structures (asterisks); similar but more modest peak shifts were observed for N-R1-C, which harbors a single repeat domain. The spectra were normalized and displaced along the y axis for ease of viewing. a.u., arbitrary units.
Fig. 5
Fig. 5. Native spidroins undergo phosphate-dependent LLPS and fibril assembly.
(A and B) Efficient sequestration of native spidroins from the aqueous phase was induced by the addition of KPi. (A) Harvested T. clavata MA gland material was mixed with KPi, pH 7 (at 0.3 M final concentration), leading to sample turbidity, which upon centrifugation separated into LDP and HDP fractions. SDS-PAGE revealed a sharp distinction between the constituents of the two fractions. Prominent bands (numbered 1 to 11) were selected for subsequent analysis. Molecular weights are indicated in kDa. (B) Protein composition in the LDP and HDP fractions. Gel slices from (A) were subjected to protein sequence identification and quantification via MS/MS and MASCOT analysis. The results are plotted as relative abundance of proteins in each of the 11 bands, grouped according to their general function. Details of the analysis are supplied in data file S1. Notably, the HDP was highly enriched for spidroins and comprise a number of different spidroin types beside MaSp1 and MaSp2, including homologs of MaSp-e, MaSp-g, and Sp-74867 as recently described (29). In contrast, the LDP was populated mostly with proteins involved in cytoskeletal functions, protein homeostasis (amino acid metabolism, protein synthesis, and degradation, etc.), as well as hemocyanin (the latter possibly a contaminant carried over from the spider hemolymph). (C and D) Morphological changes in concentrated MA gland material upon addition of 0.5 M KPi at pH 8 (C), showing liquid droplet formation, while addition of 0.5 M KPi at pH 4.5 (D) resulted in self-assembly of fibril networks. Scale bars, 10 μm.
Fig. 6
Fig. 6. Insights into sequence-based phase separation of MaSp2 toward silk assembly.
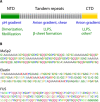
(A) Division of labor encoded within the modular architecture of MaSp2. A representation of the different spidroin domains is shown above, while the specific external stimuli each domain responds to during fiber self-assembly (blue) and the corresponding changes in protein organization (green) are shown below. In the case of CTD, a structural change in response to pH decrease has also been proposed (10). The formation of native-like hierarchical silk fibers depends on cooperative action between the different modular units. (B) Sequence comparison between MaSp2 tandem repeats and two archetypal IDPs with LLPS functions. Representative sections of the MaSp2 tandem repeats from T. clavipes (UniProt code P46804), human elastin (UniProt code P15502), and the low-complexity region of human FUS RNA binding protein (UniProt code P35637) are shown.

References

    1. Rising A., Johansson J., Toward spinning artificial spider silk. Nat. Chem. Biol. 11, 309–315 (2015). - PubMed
    1. Vollrath F., Knight D. P., Liquid crystalline spinning of spider silk. Nature 410, 541–548 (2001). - PubMed
    1. Heim M., Keerl D., Scheibel T., Spider silk: From soluble protein to extraordinary fiber. Angew. Chem. Int. Ed. Engl. 48, 3584–3596 (2009). - PubMed
    1. Yarger J. L., Cherry B. R., Van Der Vaart A., Uncovering the structure–function relationship in spider silk. Nat. Rev. Mater. 3, 1–11 (2018).
    1. Hijirida D. H., Do K. G., Michal C., Wong S., Zax D., Jelinski L. W., 13C NMR of Nephila clavipes major ampullate silk gland. Biophys. J. 71, 3442–3447 (1996). - PMC - PubMed

Publication types