. 2020 Nov 4;6(45):eabb6376.
doi: 10.1126/sciadv.abb6376. Print 2020 Nov.

Nonlinear landscape and cultural response to sea-level rise

Affiliations

Nonlinear landscape and cultural response to sea-level rise

Robert L Barnett et al. Sci Adv. .

Abstract

Rising sea levels have been associated with human migration and behavioral shifts throughout prehistory, often with an emphasis on landscape submergence and consequent societal collapse. However, the assumption that future sea-level rise will drive similar adaptive responses is overly simplistic. While the change from land to sea represents a dramatic and permanent shift for preexisting human populations, the process of change is driven by a complex set of physical and cultural processes with long transitional phases of landscape and socioeconomic change. Here, we use reconstructions of prehistoric sea-level rise, paleogeographies, terrestrial landscape change, and human population dynamics to show how the gradual inundation of an island archipelago resulted in decidedly nonlinear landscape and cultural responses to rising sea levels. Interpretation of past and future responses to sea-level change requires a better understanding of local physical and societal contexts to assess plausible human response patterns in the future.


Figures

Fig. 1
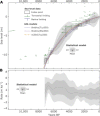
Fig. 1. Holocene sea-level change.
Reconstructed and modeled sea level and rates of sea-level change at Scilly. (A) Proxy sea-level data from dated sediments as precise data points (black boxes) with 2σ dating (horizontal) and reconstruction (vertical) uncertainties as well as limiting data points for sea-level maxima (green) and minima (blue) also with 2σ dating (horizontal) uncertainties. Gray shading is a statistical regression of the proxy data to provide a probabilistic sea-level envelope with mean (gray line), 1σ (dark gray), and 2σ (light gray) distributions. Colored dashed lines are relative sea-level outputs from a selection of the best-performing glacial isostatic adjustment models used in the study to extend the sea-level record beyond 7 ka. (B) Rates of sea-level change calculated from the statistical regression of the proxy data with mean (gray line), 1σ (dark gray), and 2σ (light gray) distributions. Years BP, years before present.
Fig. 2
Fig. 2. Holocene paleogeographies of Scilly.
Changes in topography (green), bathymetry (blue), and intertidal area (yellow) modeled from the present-day values and extended back in time using relative sea- and land-level adjustments from the Bradley(71p350) glacial isostatic adjustment model and corrected for changes in tidal range.
Fig. 3
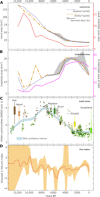
Fig. 3. Environmental and landscape change.
Landscape changes over the past 13,000 years. (A) Decline in total land area (defined as area in km2 above mean high water spring tides) and (B) change in area of the intertidal zone, determined from observational sea-level changes (gray shading) and relative sea-level outputs from glacial isostatic adjustment models (dashed lines). The changing ratio of land area to intertidal area (A) and the intertidal area as a percentage of the total area above mean low water spring tides (B) are also shown on secondary axes. (C) Vegetation cover index based on the first nMDS axis of the screened (intertidal and coastal samples removed) pollen data (filled circles) that has also been classified into community clusters (circle colors; fig. S1). (D) Fire index derived from counts of macro (>50 μm) charcoal from pollen samples from 17 of the sediment cores and monoliths from Scilly that were used to develop a composite charcoal curve.
Fig. 4
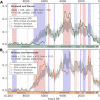
Fig. 4. Regional population demographics.
Population demography estimated using SPDs of archeological radiocarbon dates. Radiocarbon SPD curves for Devon and Cornwall (A) and Brittany and Normandy (B) shown as solid colored curves. Iterations of random permutations (n = 1000) of the global (Devon and Cornwall plus Brittany and Normandy) radiocarbon dataset are used to develop a theoretical global trend with 95% critical thresholds (gray shading). Departures of local SPD curves above (red shading) and below (blue shading) this theoretical global model are shown to denote regionally specific and significant population trends.

References

    1. M. Oppenheimer, B. C. Glavovic, J. Hinkel, R. van de Wal, A. K. Magnan, A. Abd-Elgawad, R. Cai, M. Cifuentes-Jara, R. M. DeConto, T. Ghosh, J. Hay, F. Isla, B. Marzeion, B. Meyssignac, Z. Sebesvari, in IPCC Special Report on the Ocean and Cryosphere in a Changing Climate, H. -O. Pörtner, D. C. Roberts, V. Masson-Delmotte, P. Zhai, M. Tignor, E. Poloczanska, K. Mintenbeck, A. Alegría, M. Nicolai, A. Okem, J. Petzold, B. Rama, N. M. Weyer, Eds. (In press), pp. 321–447.
    1. Kopp R. E., Kemp A. C., Bittermann K., Horton B. P., Donnelly J. P., Gehrels W. R., Hay C. C., Mitrovica J. X., Morrow E. D., Rahmstorf S., Temperature-driven global sea-level variability in the Common Era. Proc. Natl. Acad. Sci. U.S.A. 113, 1434–1441 (2016). - PMC - PubMed
    1. Slangen A. B. A., Carson M., Katsman C. A., van de Wal R. S. W., Köhl A., Vermeersen L. L. A., Stammer D., Projecting twenty-first century regional sea-level changes. Clim. Chang. 124, 317–332 (2014).
    1. Nicholls R. J., Cazenave A., Sea-level rise and its impact on coastal zones. Science 328, 1517–1520 (2010). - PubMed
    1. Vousdoukas M. I., Mentaschi L., Voukouvalas E., Verlaan M., Jevrejeva S., Jackson L. P., Feyen L., Global probabilistic projections of extreme sea levels show intensification of coastal flood hazard. Nat. Commun. 9, 2360 (2018). - PMC - PubMed

Publication types