. 2021 Jan 15;81(2):268-281.
doi: 10.1158/0008-5472.CAN-20-0696. Epub 2020 Nov 4.

Single-Cell Transcriptomic Heterogeneity in Invasive Ductal and Lobular Breast Cancer Cells

Affiliations

Single-Cell Transcriptomic Heterogeneity in Invasive Ductal and Lobular Breast Cancer Cells

Fangyuan Chen et al. Cancer Res. .

Erratum in

Abstract

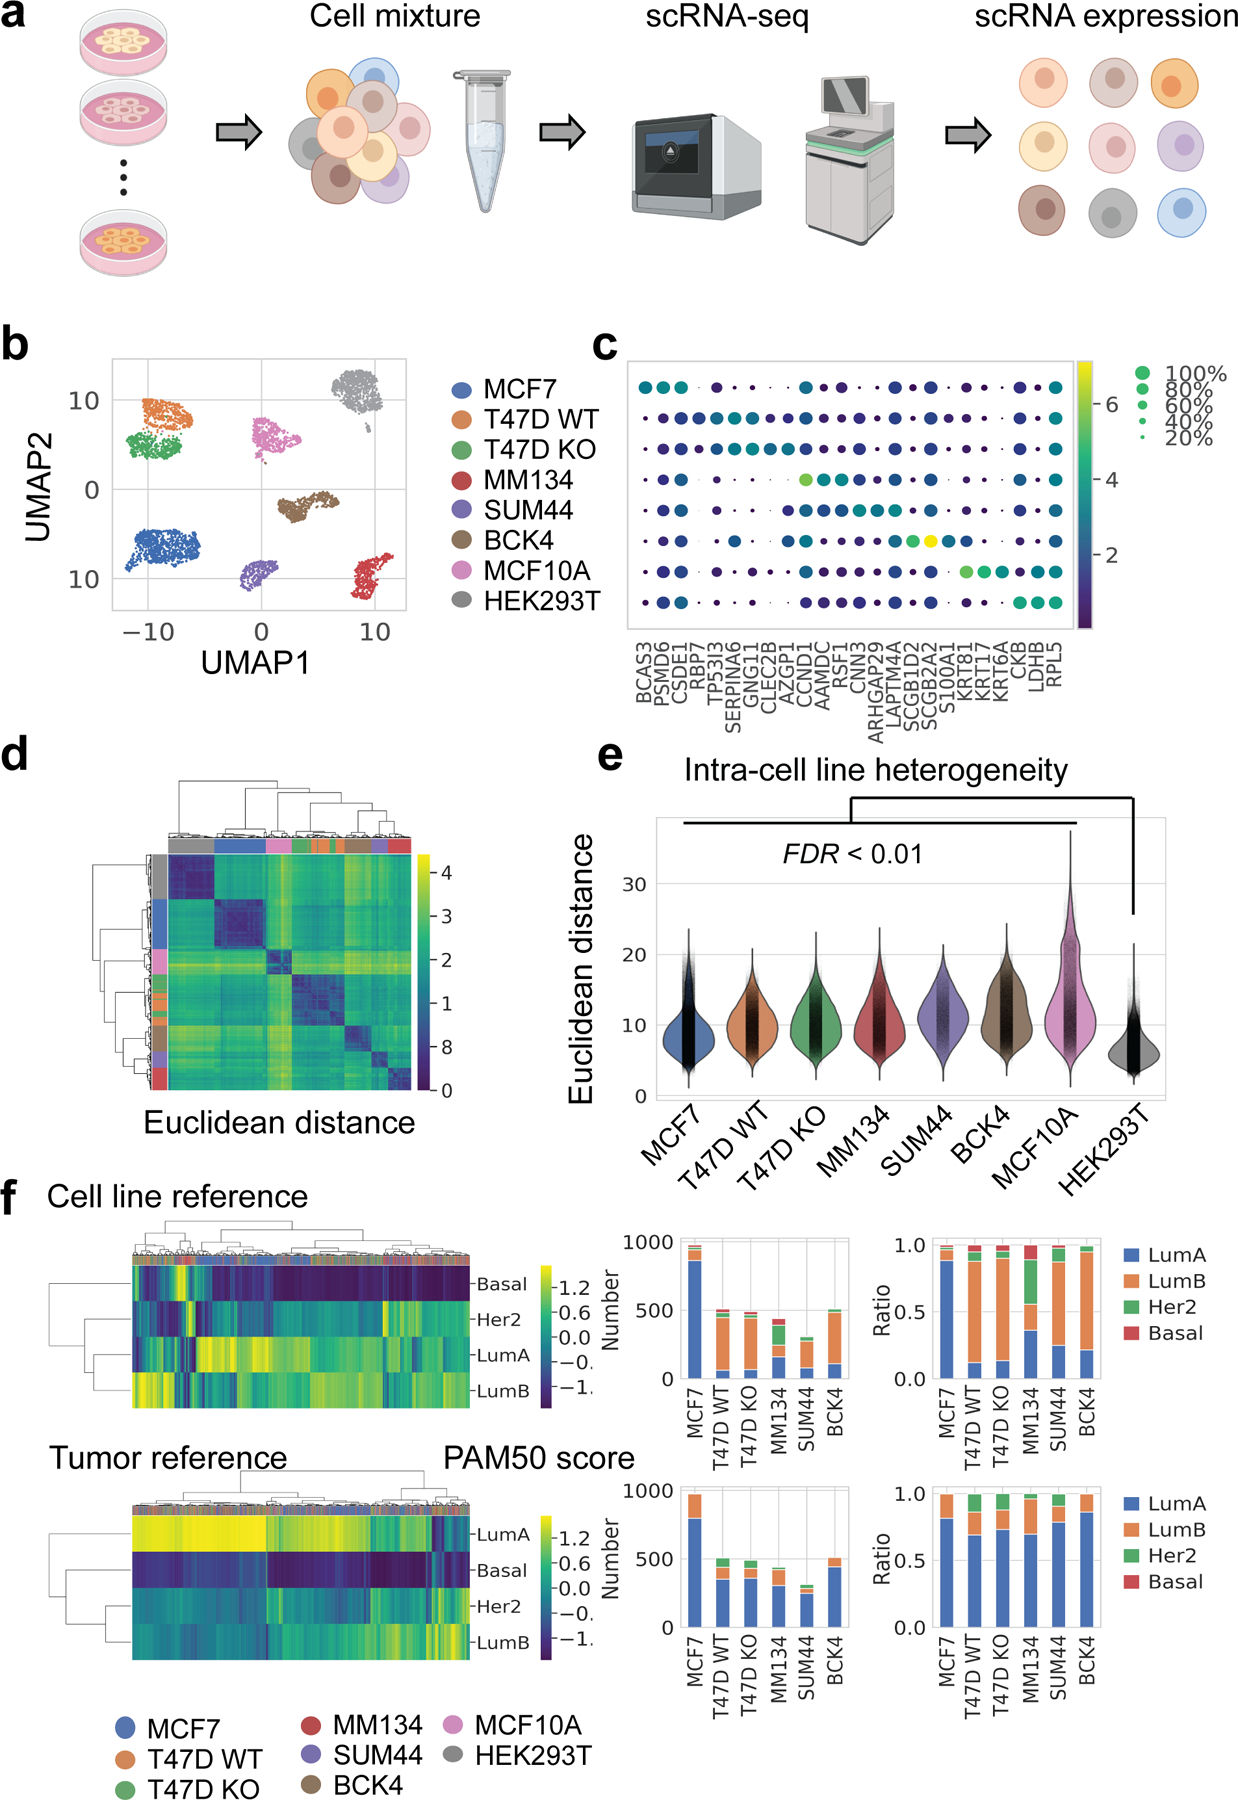
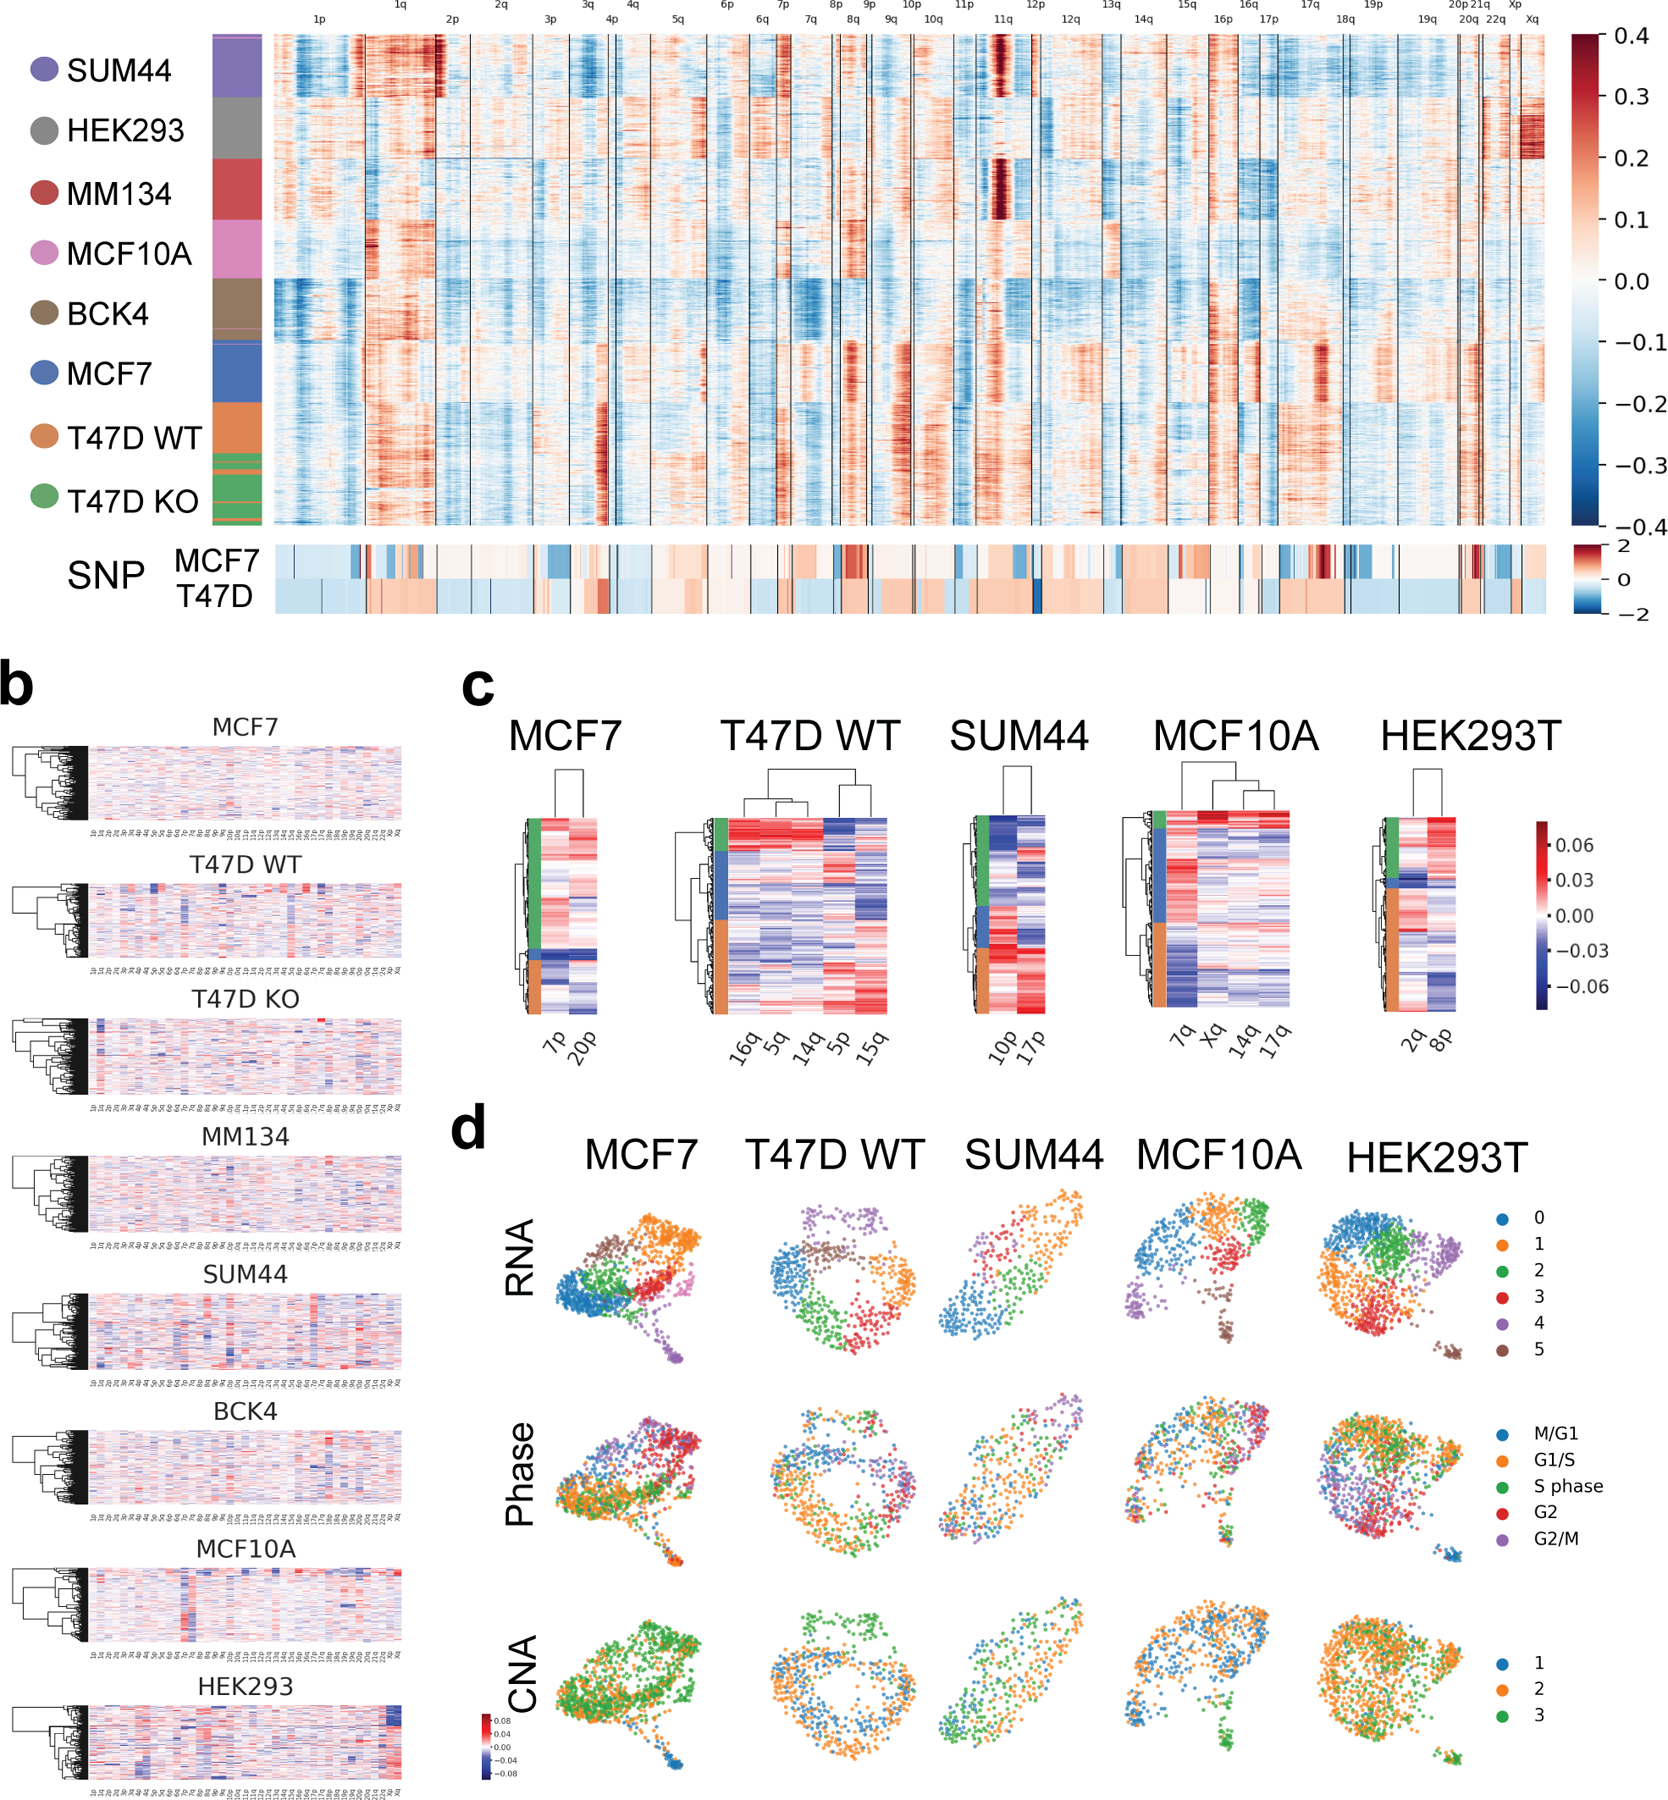
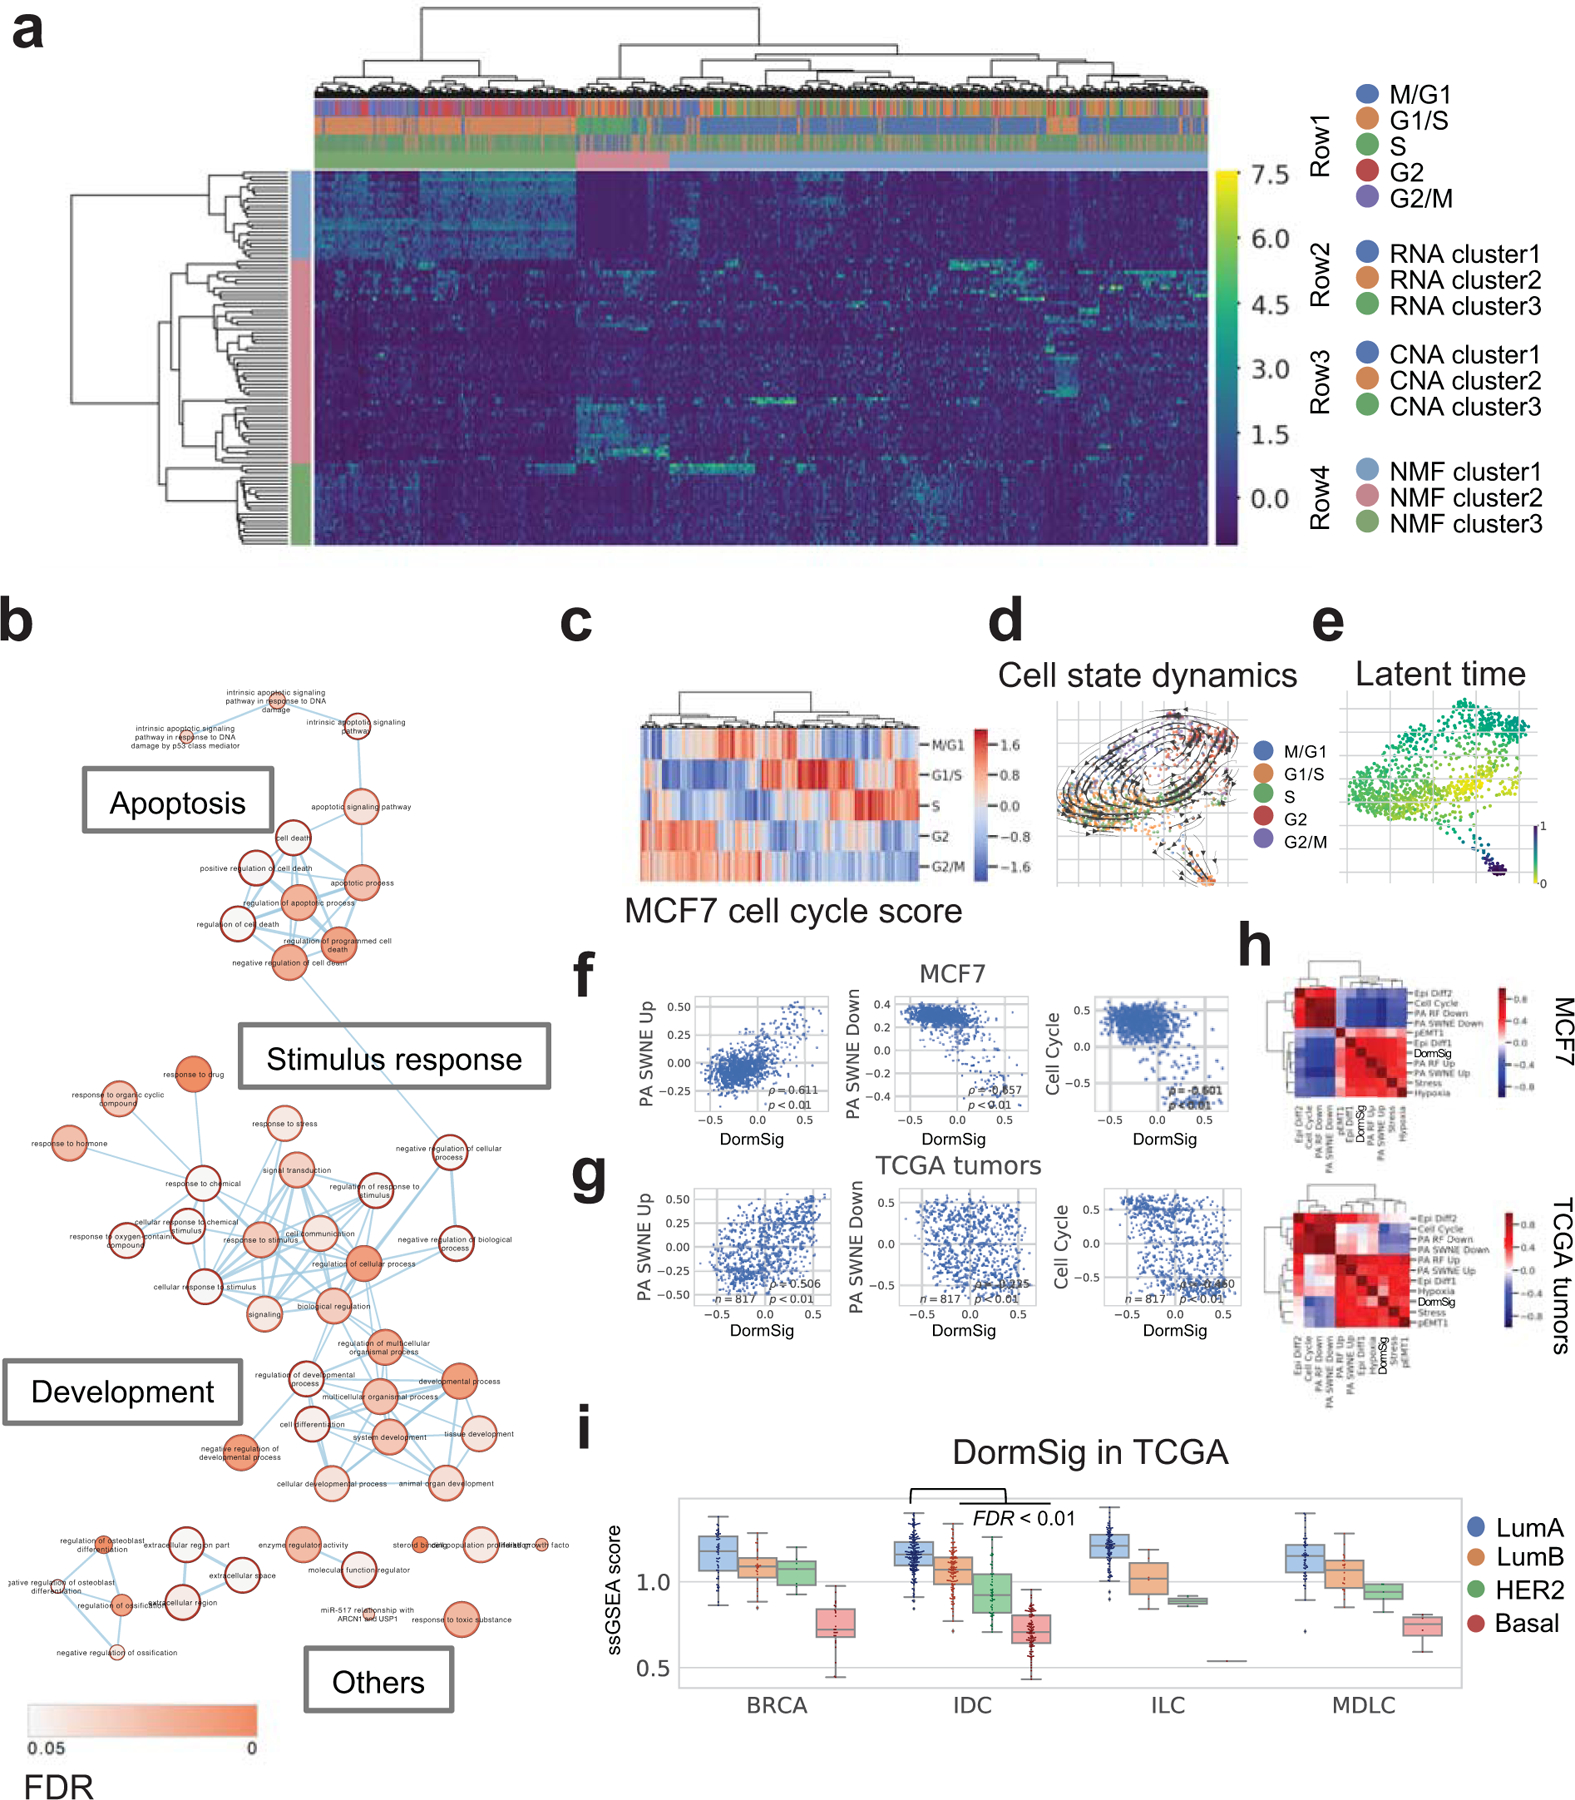
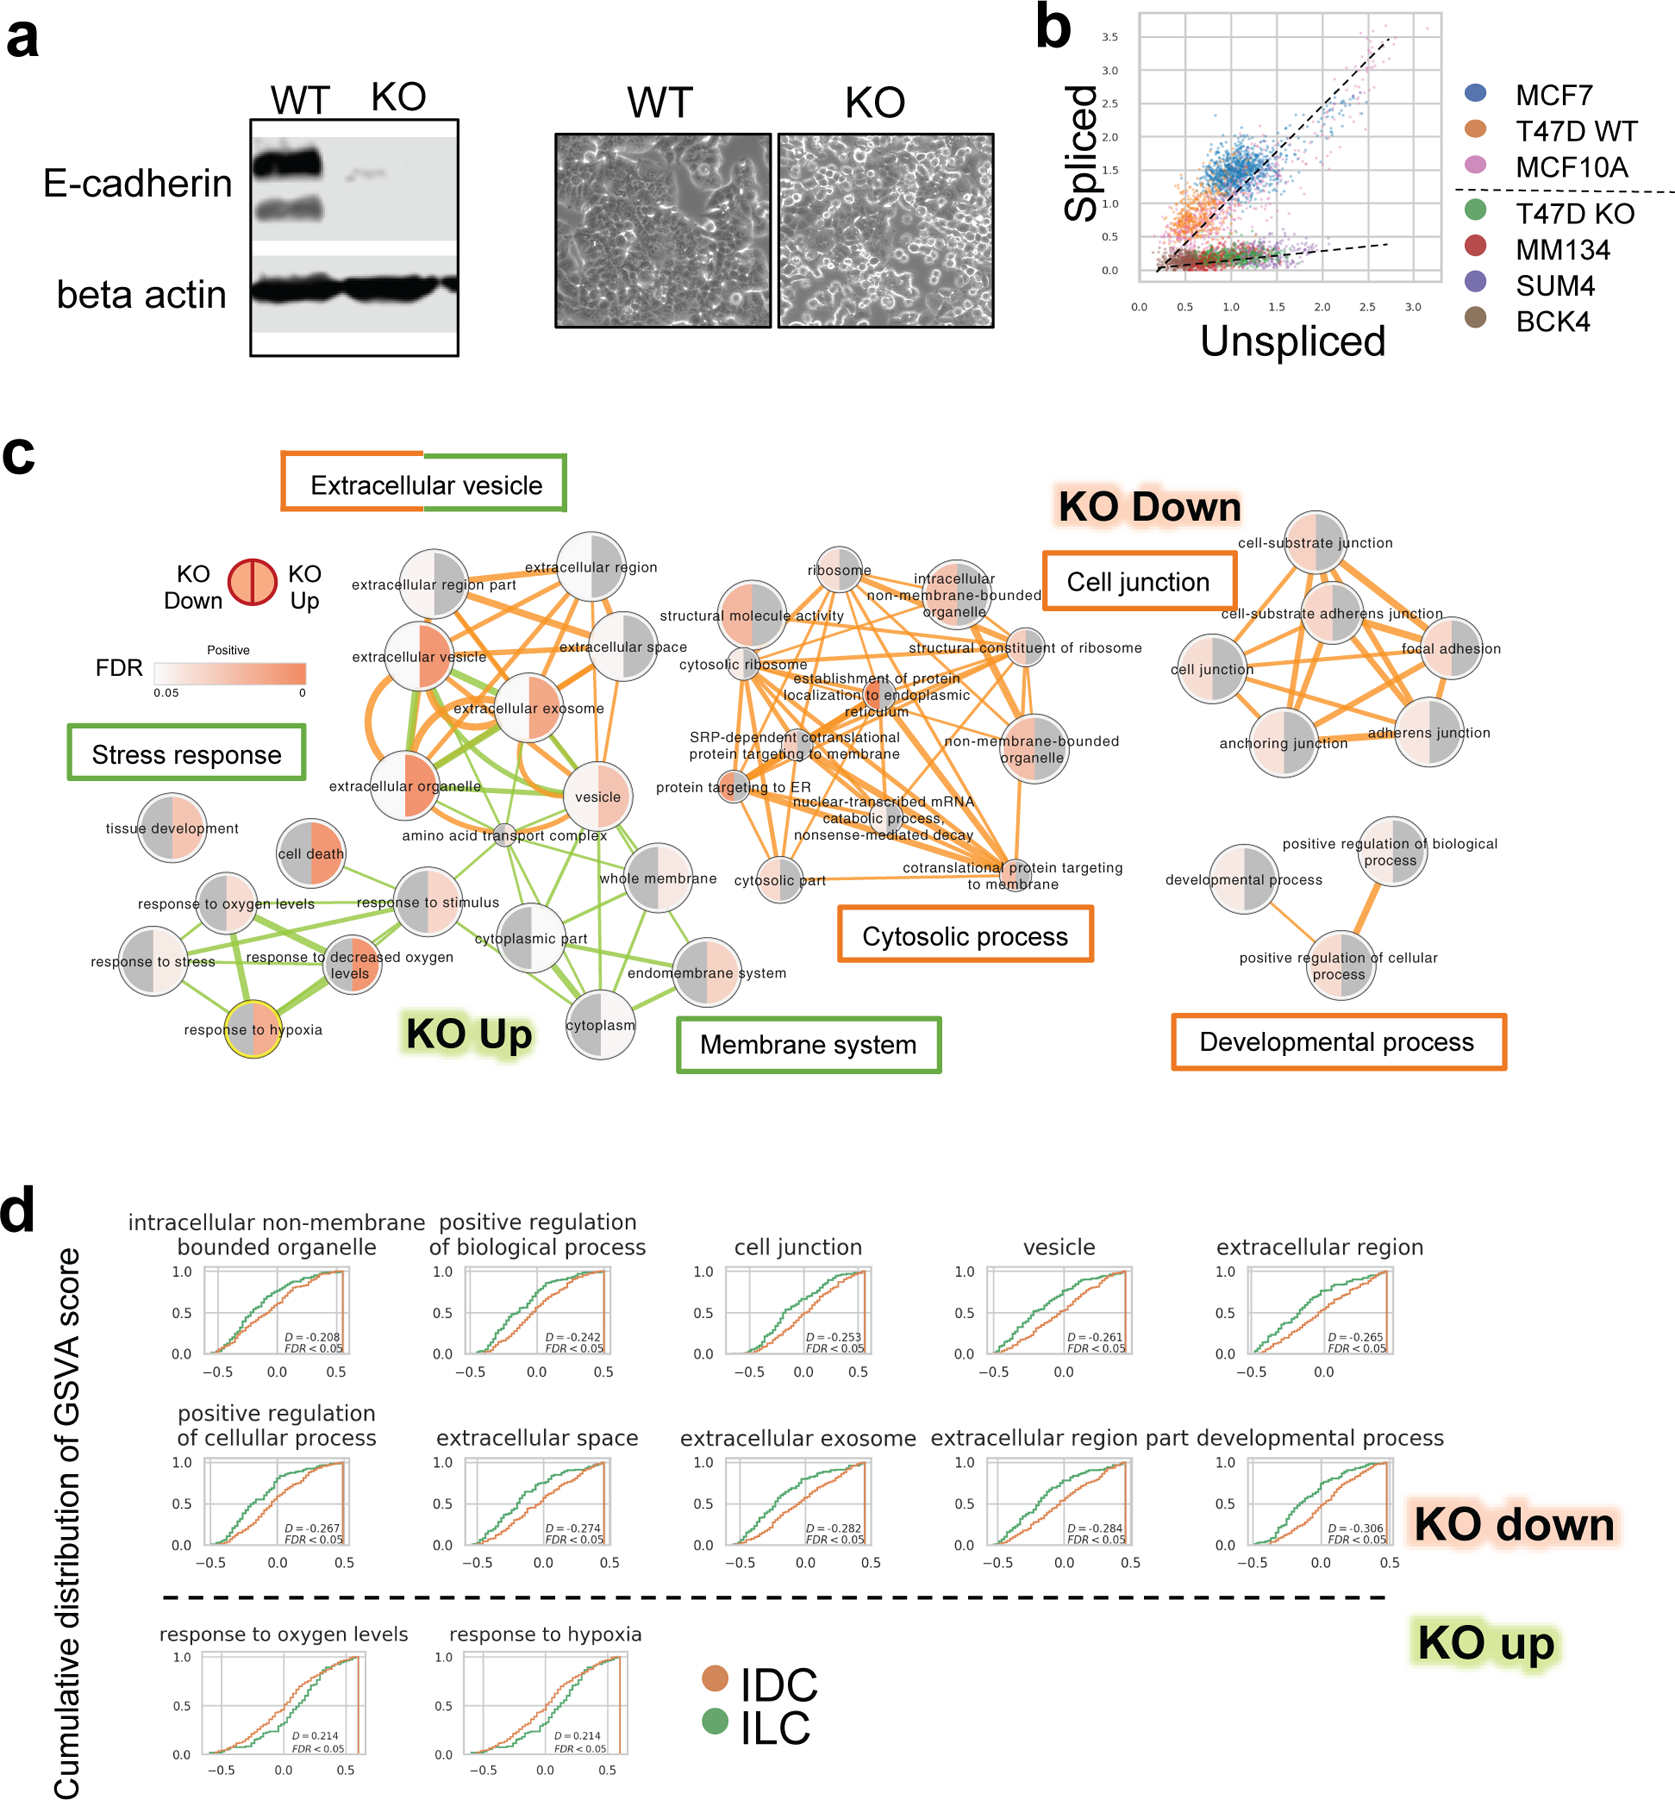
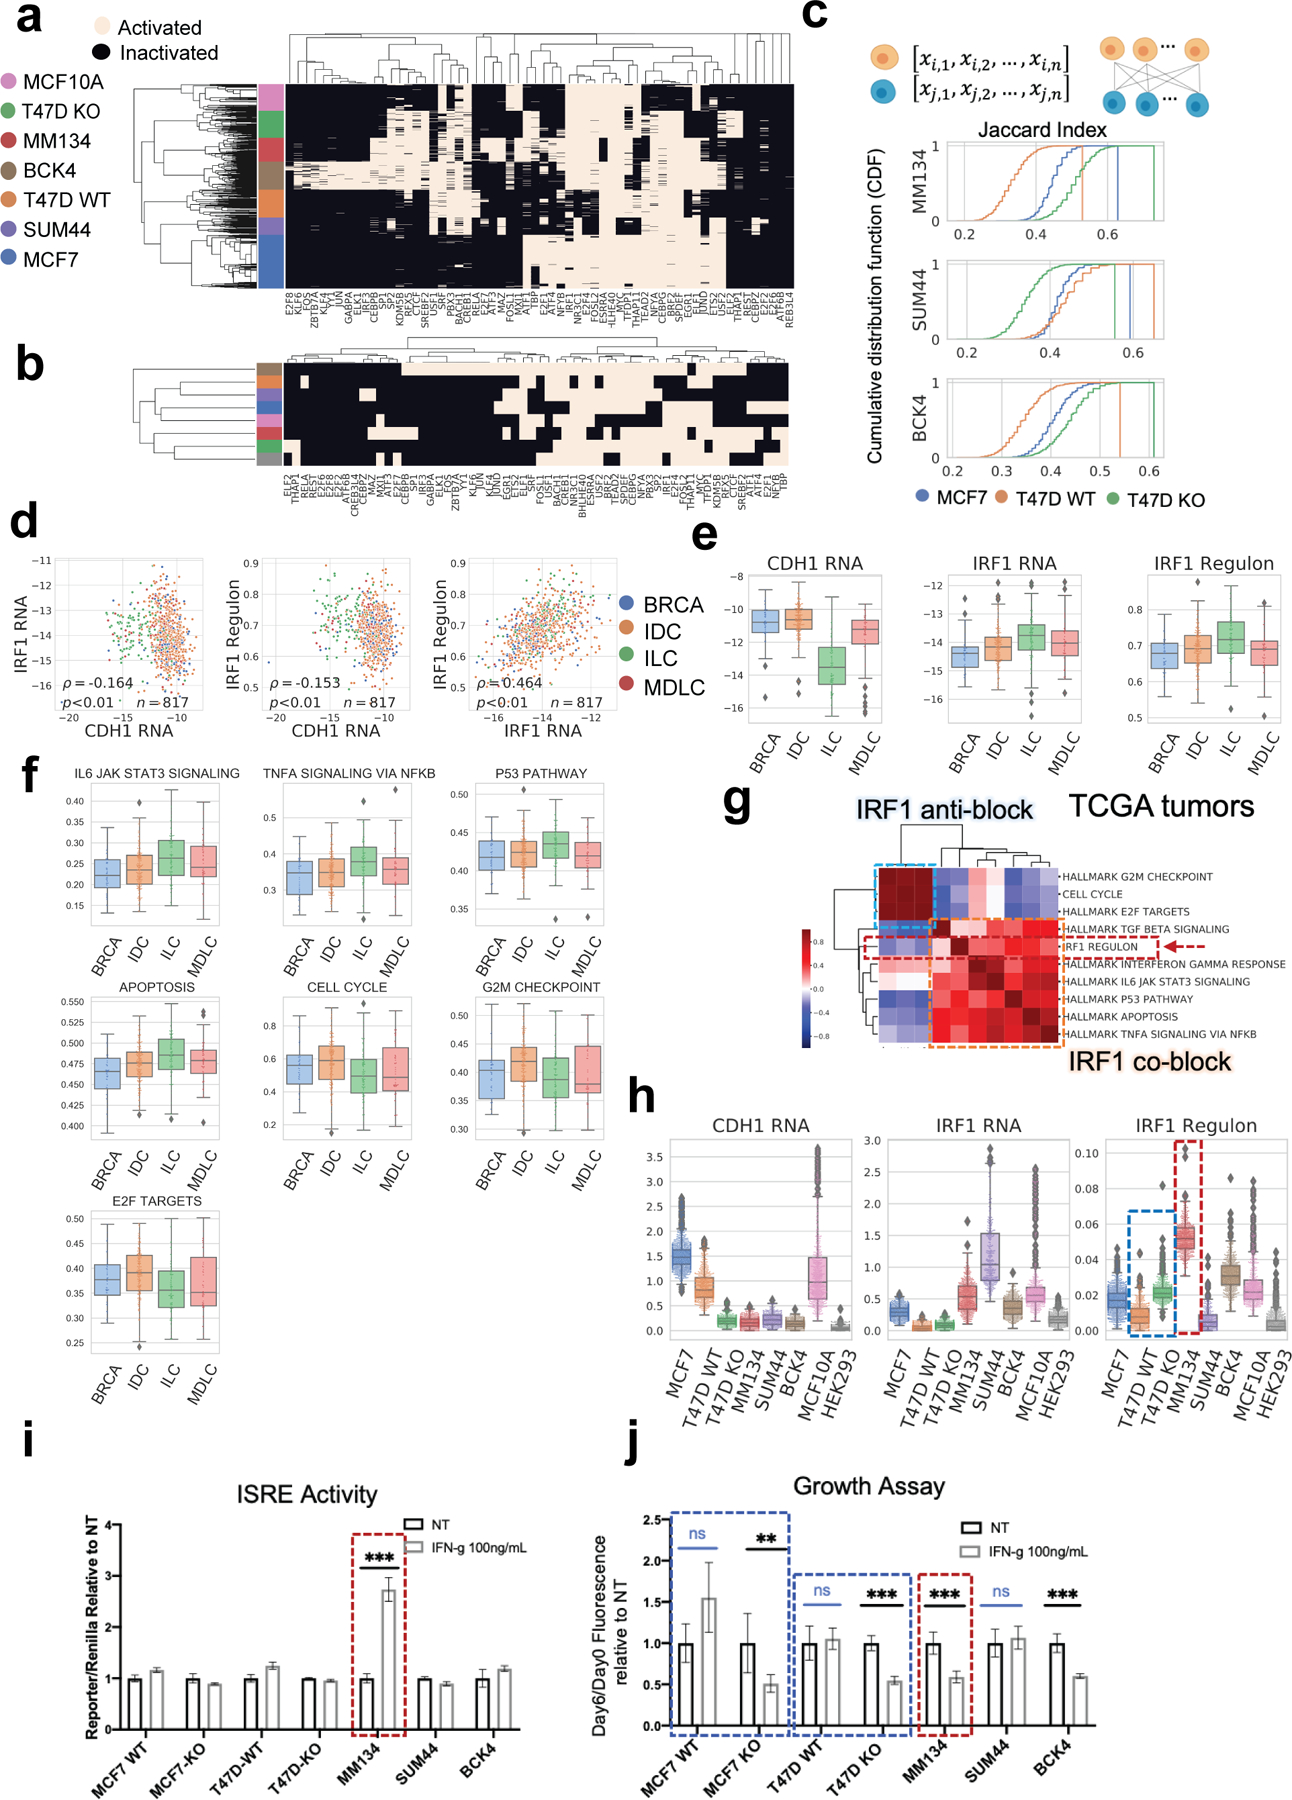
Invasive lobular breast carcinoma (ILC), one of the major breast cancer histologic subtypes, exhibits unique features compared with the well-studied ductal cancer subtype (IDC). The pathognomonic feature of ILC is loss of E-cadherin, mainly caused by inactivating mutations, but the contribution of this genetic alteration to ILC-specific molecular characteristics remains largely understudied. To profile these features transcriptionally, we conducted single-cell RNA sequencing on a panel of IDC and ILC cell lines, and an IDC cell line (T47D) with CRISPR-Cas9-mediated E-cadherin knockout (KO). Inspection of intracell line heterogeneity illustrated genetically and transcriptionally distinct subpopulations in multiple cell lines and highlighted rare populations of MCF7 cells highly expressing an apoptosis-related signature, positively correlated with a preadaptation signature to estrogen deprivation. Investigation of E-cadherin KO-induced alterations showed transcriptomic membranous systems remodeling, elevated resemblance to ILCs in regulon activation, and increased sensitivity to IFNγ-mediated growth inhibition via activation of IRF1. This study reveals single-cell transcriptional heterogeneity in breast cancer cell lines and provides a resource to identify drivers of cancer progression and drug resistance. SIGNIFICANCE: This study represents a key step towards understanding heterogeneity in cancer cell lines and the role of E-cadherin depletion in contributing to the molecular features of invasive lobular breast carcinoma.


Conflict of interest statement

Conflicts of Interest / Competing Financial Interest Disclosure: The authors declare no potential conflicts of interest.

Figures

Fig. 1
Fig. 1. scRNA-seq of breast cancer and non-cancerous cell lines.
a. Schematic pipeline of scRNA-seq. b. UMAP embeddings of 4,614 single cells in 8 clusters. Deconvoluted cell line identities are displayed in the same row as c. Number of cells: MCF7 (n=977), T47D WT (n=509), T47D KO (n=491), MM134 (n=439), SUM44 (n=314), BCK4 (n=512), MCF10A (n=491), HEK293T(n=881). c. Marker gene expression of each cell line. Top three differentially expressed genes were plotted for each cell cluster which had the smallest FDR when compared with all other clusters (Wilcoxon test, Benjamini-Hochberg (BH) adjustment). Every dot is colored by average expression of the gene and sized by the fraction of cells expressing the gene within that cell line. d. Hierarchical clustering (Euclidean distance, Ward’s method) of intercellular distances. xi,j in the matrix represents the Euclidean distance between cell i and cell j using the top 30 principle components from the original expression matrix. Corresponding cell lines are colored on side bars, with the same color label as in b, c. e. Intercellular distances between every two single cells (calculated as Euclidean distance in d) within cell lines. Intra-cell line distances of all breast cell lines were higher than HEK293T (FDR < 0.01, Wilcoxon test, BH adjustment). f. Prediction Analysis of Microarray 50 (PAM50) subtypes scores (left) and assignment (right) of every single cell, using typical cell lines (upper) or estrogen-positive tumors (lower) as reference. Corresponding cell lines are colored on top bar of heatmap. Bar plots showed both absolute number of cells or the ratio of each PAM50 subtypes. LumA: luminal A, LumB: luminal B, Her2: HER2-enriched, Basal: Basal-like.
Fig. 2
Fig. 2. Intra-cell line subpopulations from inferred CNA.
a. Inferred copy number (in log2 scale) of scRNA-seq (top), and Affymetrix SNP6.0 arrays (log2(CN/2)) of MCF7 and T47D cell lines from CCLE (46) (bottom). b. Inferred CNA averaged for each chromosome arms with more than 100 genes expression. c. Cell lines with identifiable intra-cell line CNA subpopulations based on selected chromosome arms, colored on heatmap side bars. d. Intra-cell line RNA and CNA subpopulations, and cell cycle of cell lines in c. Clusters recurrently identified by both CNA and RNA are marked with square.
Fig. 3
Fig. 3. Transcriptomic heterogeneity in MCF7 cells
a. Clustering by Non-negative Matrix Factorization (NMF) in MCF7 cells (n=977). The first three rows of top bar showed respectively: cell cycle (row 1), RNA clusters (Louvain method, three clusters at resolution=0.4) (row 2) and CNA clusters (row 3). NMF clusters of cells and corresponding genes are shown in row 4 of top bar and the side bar. b. GO enrichment of marker genes of NMF cluster 2 cells (pink side bar in Fig. 3a). Terms connections based on similarity; nodes colored by enrichment FDR (over-representation test, BH adjustment) in Cytoscape 3.7.1. c. Cell cycle phase scores and assignments of MCF7. d. Dynamical changes of cell states through the cell cycle. Cells are colored by the assigned phase in the force-directed graph drawing 2D layout. Arrows show directions of cell state transition from RNA velocity analysis. e. Latent time among MCF7 cells from RNA velocity analysis, indicating developmental stages. f. Co-expression of GSVA scores of DormSig with selected signatures in MCF7 cells (n=977). Correlation showed by Pearson ρ and p. g. Co-expression of GSVA scores of DormSig with selected signatures (as in f) in TCGA breast tumors (n=817). Correlation showed by Pearson ρ and p. h. Pearson correlation of GSVA scores of DormSig with selected signatures in MCF7 cells (n=977) and primary breast tumors from TCGA (n=817). Hierarchical clustering was performed using Euclidean distance and Ward’s method. i. Single sample GSEA (ssGSEA) scores of DormSig in different subtypes of breast cancer from TCGA. (LumA: luminal A, LumB: luminal B, Her2: HER2-enriched, Basal: Basal-like; BRCA: breast cancer with unannotated histological subtype, IDC: invasive ductal carcinoma, ILC: invasive lobular carcinoma, MDLC: mixed ductal/lobular carcinoma). DormSig ssGSEA scores are higher in LumA IDCs (n=200) than each of the other subtypes in IDC tumors (LumB: n=122, Her2: n=51, Basal: n=107) (FDR < 0.01, Wilcoxon test, BH adjustment).
Fig. 4
Fig. 4. Differentially activated pathways in CDH1 KO vs WT T47D cells and ILC vs IDC tumors
a T47D KO and WT cells. Left: E-cadherin expression by WB. Right: morphology under microscope b. Normalized unspliced and spliced CDH1 RNA abundance among single cells. c. Enriched Gene Ontology terms of down (red linked) and up (green linked) regulated genes after CDH1 KO in T47D cells. Terms connections based on similarity; nodes colored by enrichment FDR (over-representation test, BH adjustment) in Cytoscape 3.7.1. d. Cumulative distribution of GSVA scores of selected signatures in TCGA LumA IDC (n=200) and ILC (n=106) tumors. Right shifted curve indicates distribution of higher score values.
Fig. 5
Fig. 5. Regulon activation states in breast cell lines and TCGA tumors
a. Binarized regulon activation profiles of each breast single cell deduced from scRNA-seq with pySCENIC. b. Binarized TF activation profile for each breast cell line, based on the majority of single cell states in a. Hierarchical clustering by Jaccard distance, ward method. c. Regulon activation similarity between each ILC cell line (reference) to MCF7, T47D WT and T47D KO (query), quantified by Jaccard Index. For each reference cell line (per row, labeled on y axis), Jaccard Index was calculated between individuals in the reference population and every single cell of the three query breast cell lines respectively, depicted in cumulative distribution. Larger Jaccard Index indicates higher similarity. d. Log normalized expression of CDH1 RNA, IRF1 RNA, and AUC score of IRF1 regulon in breast cell lines. Difference between IDCs and ILCs are significant (FDR<0.05) in all the three cases. e. Expression of CDH1, IRF1 (log normalized RNA abundance) and IRF1 regulon (ssGSEA score) in TCGA LumA cases. Difference between IDCs and ILCs are significant (FDR<0.05) in all the three cases. f. ssGSEA scores of selected signatures (as in Fig. 5g) which showed significant difference between TCGA LumA IDC (n=200) and ILC (n=106) tumors. Signatures except for IRF1 Regulon or Cell Cycle are from MSigDB hallmark database. Difference between IDCs and ILCs are significant (FDR<0.05) in all cases. g. Pearson correlation of ssGSEA scores of IRF1 regulon with relevant functional signatures in TCGA tumors (n=817). Signatures are divided to IRF1 co-block, which show positive correlation with IRF1 regulon; or IRF1 anti-block, which show negative correlation with IRF1 regulon. h. Expression of CDH1, IRF1 (log normalized) and IRF1 regulon (AUC score from pySCENIC) in breast cell lines. i. Relative ISRE transcriptional activity of IFN-γ (100ng/mL) stimulated cells than the non-treated group (six technical replicates for each group). j. Relative growth at day 6 post IFN-γ (100ng/mL) stimulation compared to the non-treated group (six technical replicates for each group), by dsDNA Fluorescence quantification.

References

    1. American Cancer Society. Breast Cancer Facts & Figures 2019–2020. Am Cancer Soc. 2019;1–44.
    1. Sikora MJ, Cooper KL, Bahreini A, Luthra S, Wang G, Chandran UR, et al. Invasive Lobular Carcinoma Cell Lines Are Characterized by Unique Estrogen-Mediated Gene Expression Patterns and Altered Tamoxifen Response. Cancer Res. 2014;74:1463–74. - PMC - PubMed
    1. Sikora MJ, Jacobsen BM, Levine K, Chen J, Davidson NE, Lee AV., et al. WNT4 mediates estrogen receptor signaling and endocrine resistance in invasive lobular carcinoma cell lines. Breast Cancer Res. 2016;18:92. - PMC - PubMed
    1. Teo K, Gómez-Cuadrado L, Tenhagen M, Byron A, Rätze M, van Amersfoort M, et al. E-cadherin loss induces targetable autocrine activation of growth factor signalling in lobular breast cancer. Sci Rep. 2018;8:15454. - PMC - PubMed
    1. Ciriello G, Gatza ML, Beck AH, Wilkerson MD, Rhie SK, Pastore A, et al. Comprehensive Molecular Portraits of Invasive Lobular Breast Cancer. Cell. 2015;163:506–19. - PMC - PubMed

Publication types

MeSH terms