. 2021 Jan 13;95(3):e00883-20.
doi: 10.1128/JVI.00883-20. Print 2021 Jan 13.

Identification of an Antiretroviral Small Molecule That Appears To Be a Host-Targeting Inhibitor of HIV-1 Assembly

Affiliations

Identification of an Antiretroviral Small Molecule That Appears To Be a Host-Targeting Inhibitor of HIV-1 Assembly

Jonathan C Reed et al. J Virol. .

Abstract

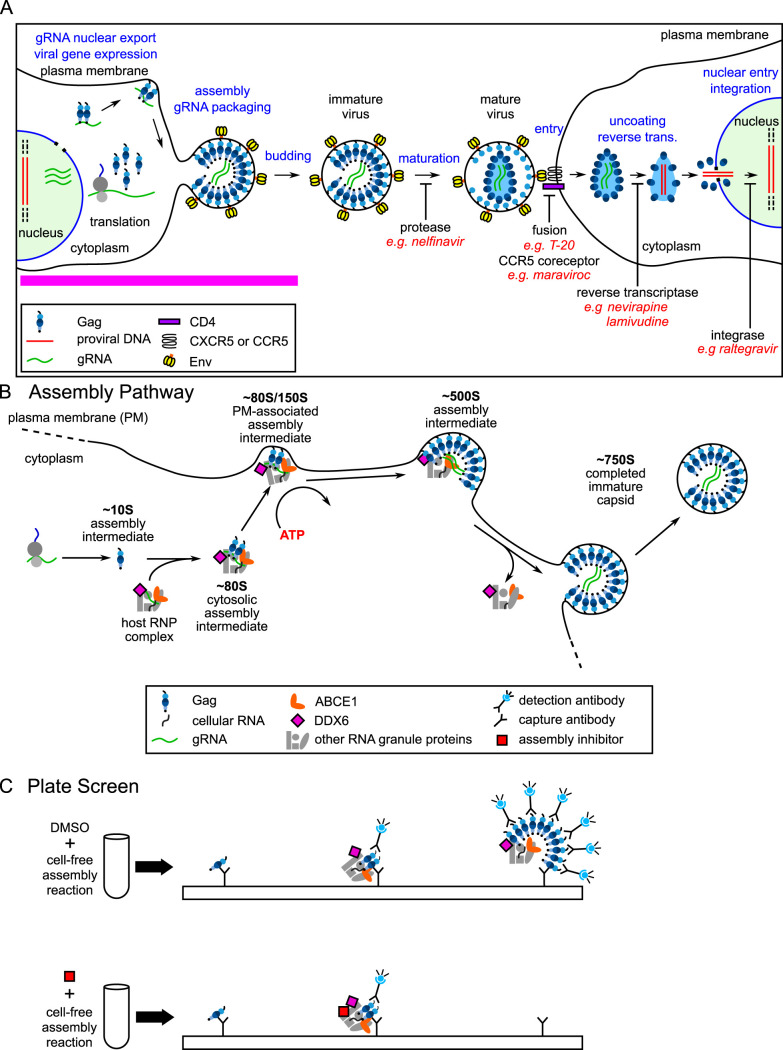
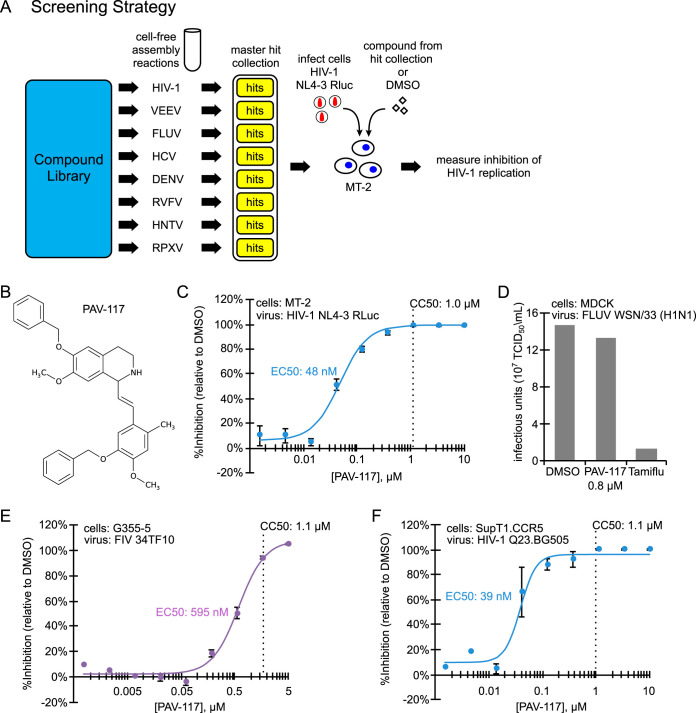
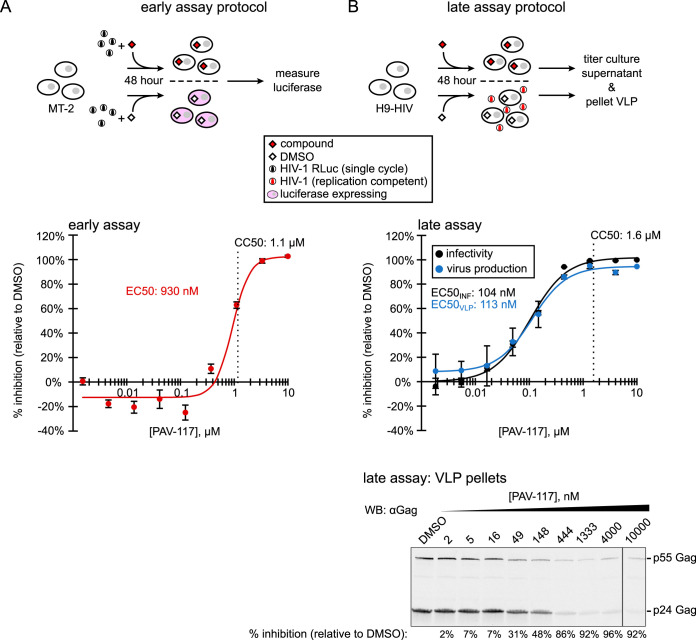
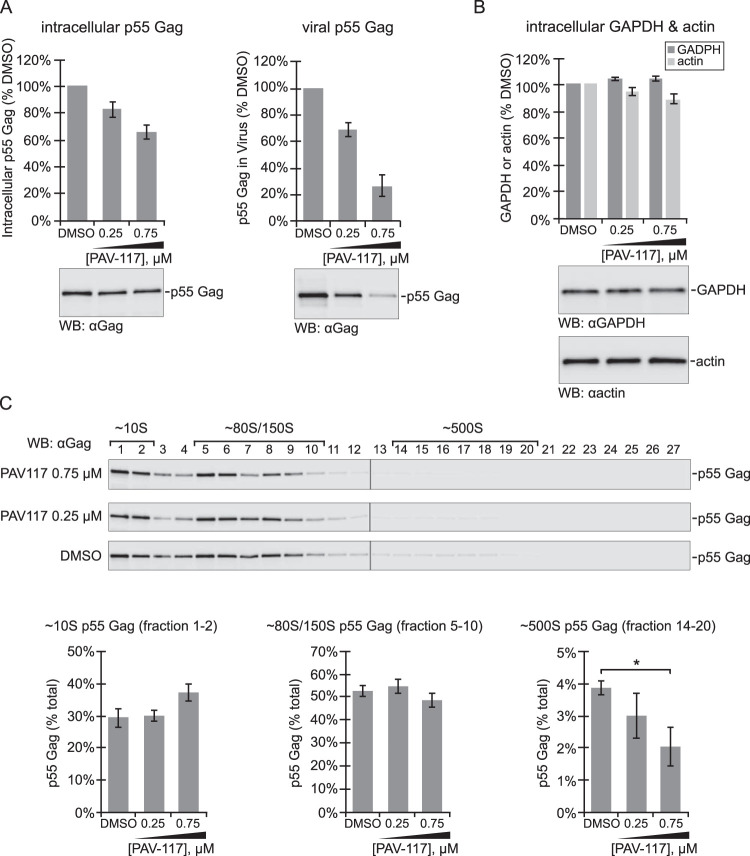
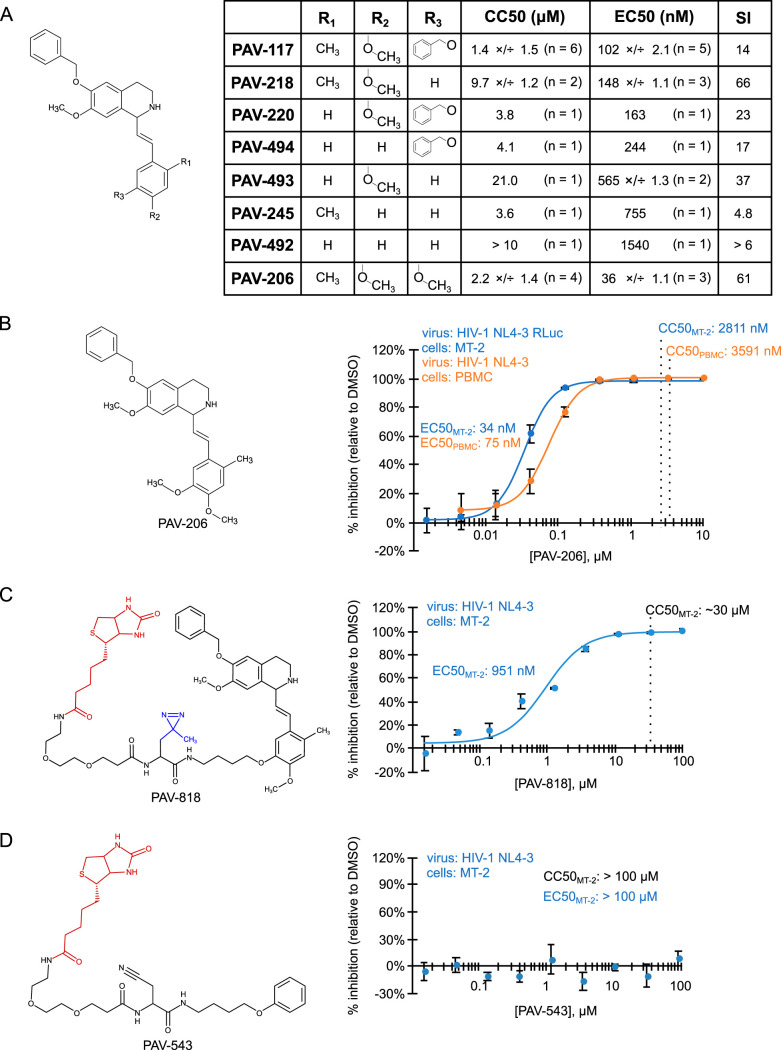
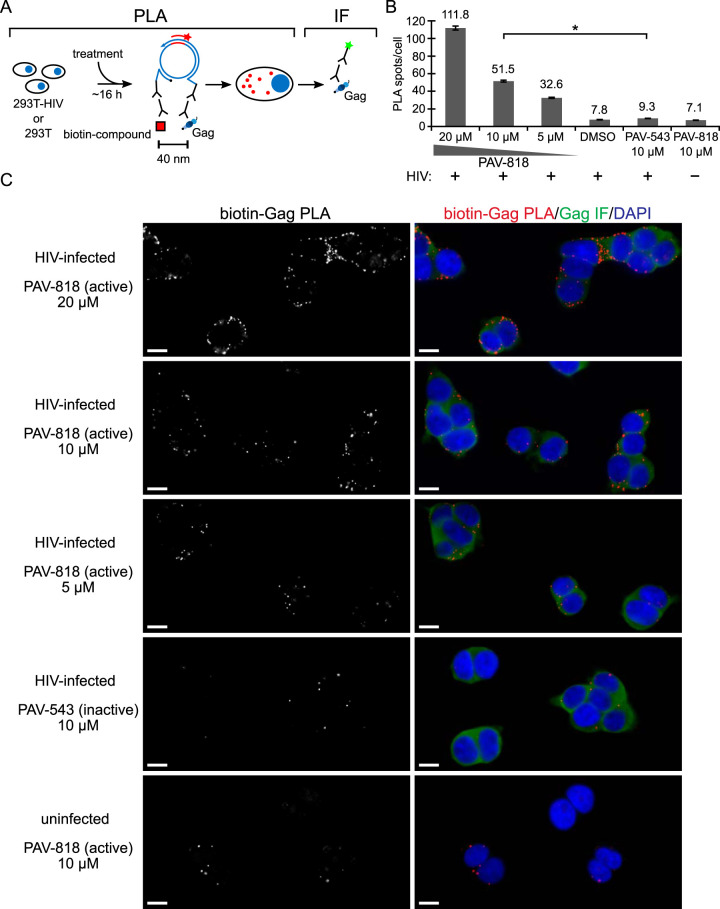
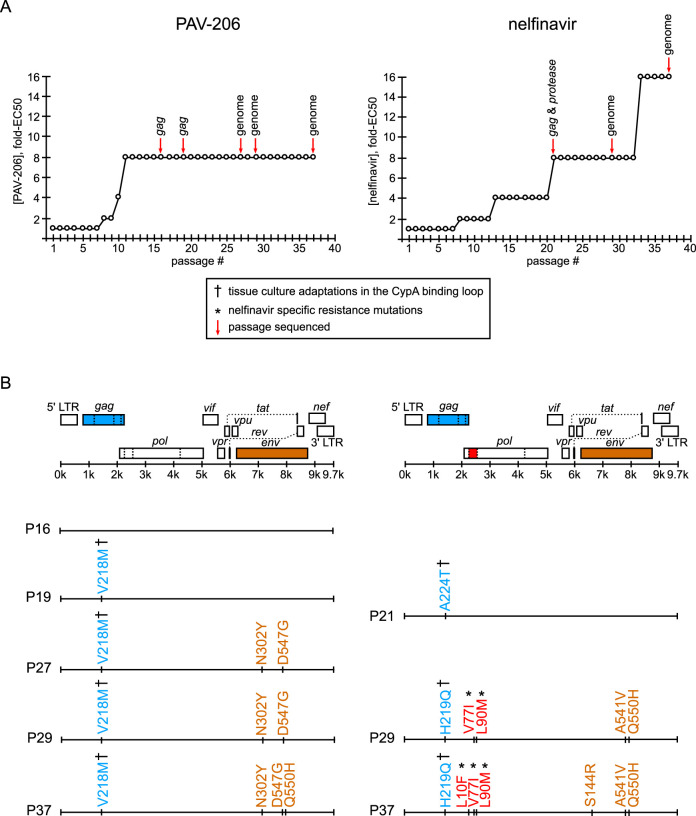
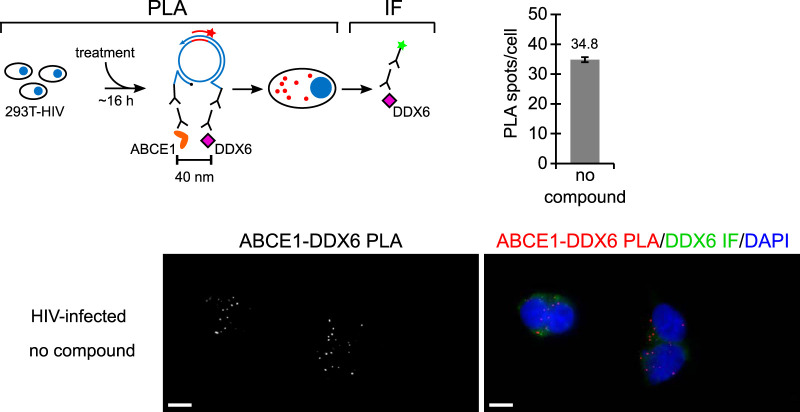
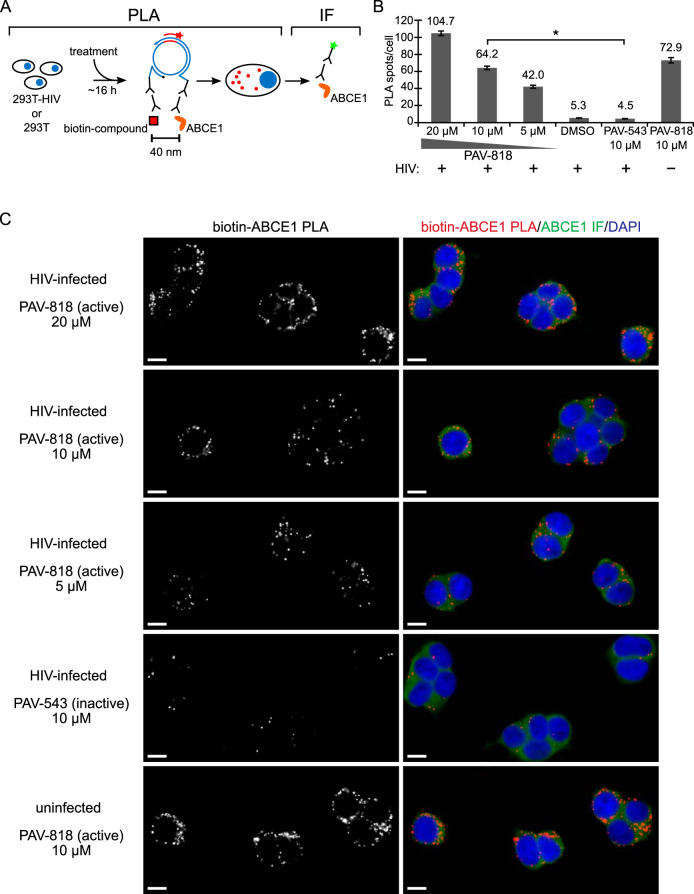
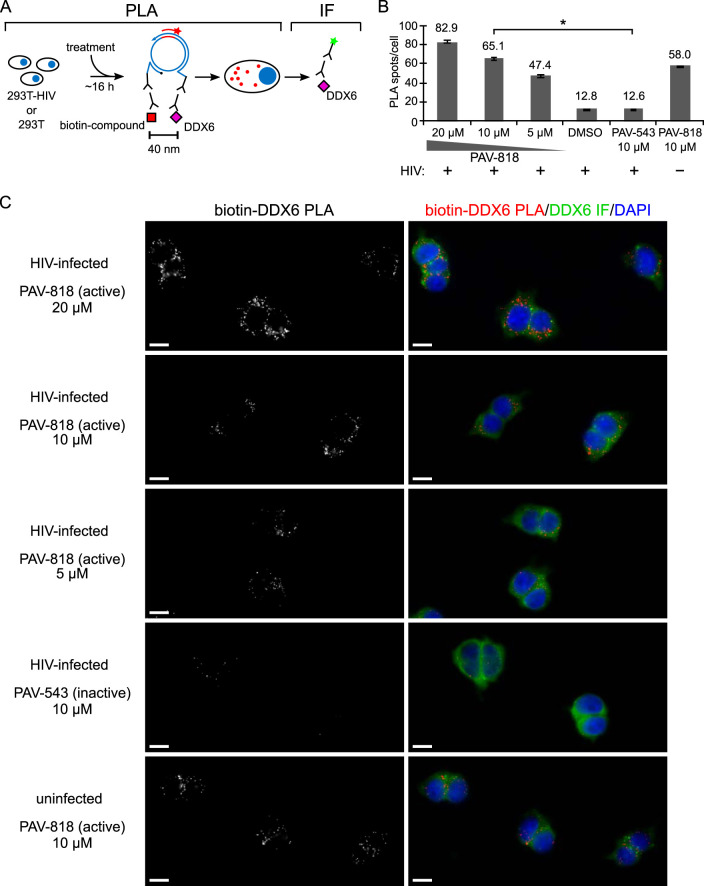
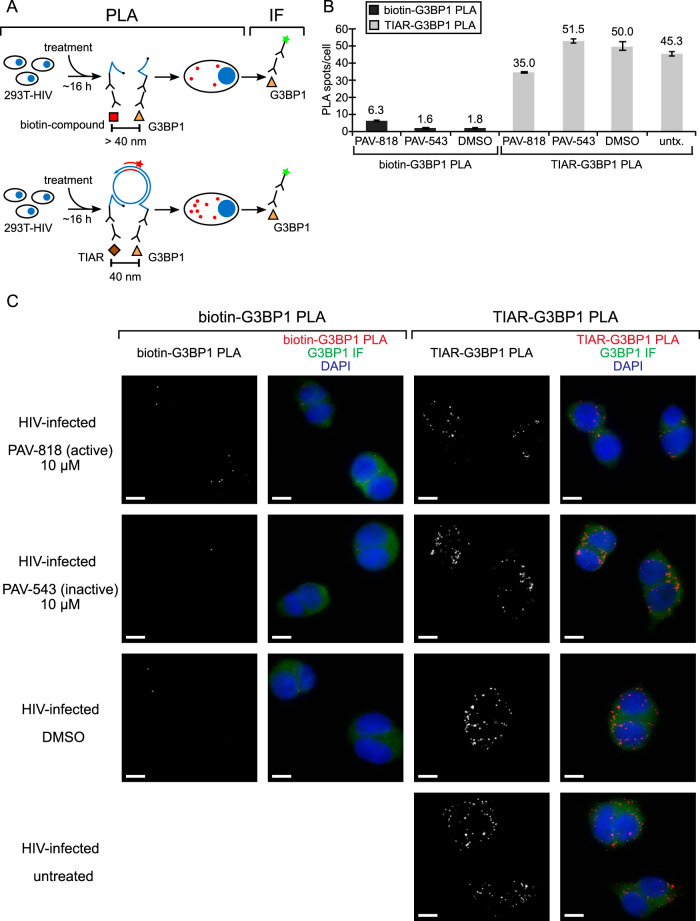
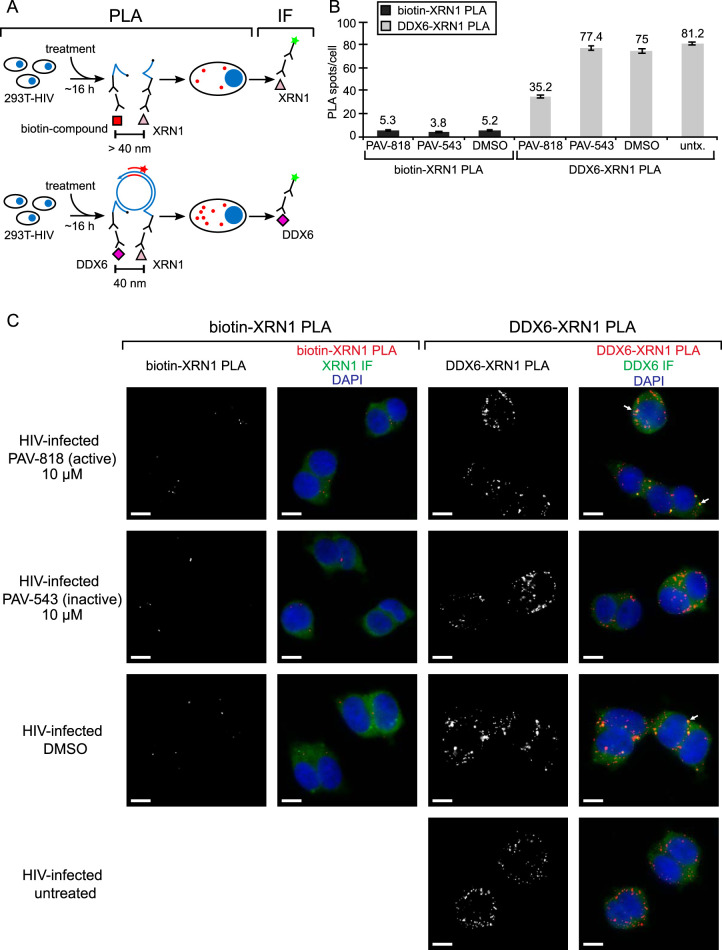
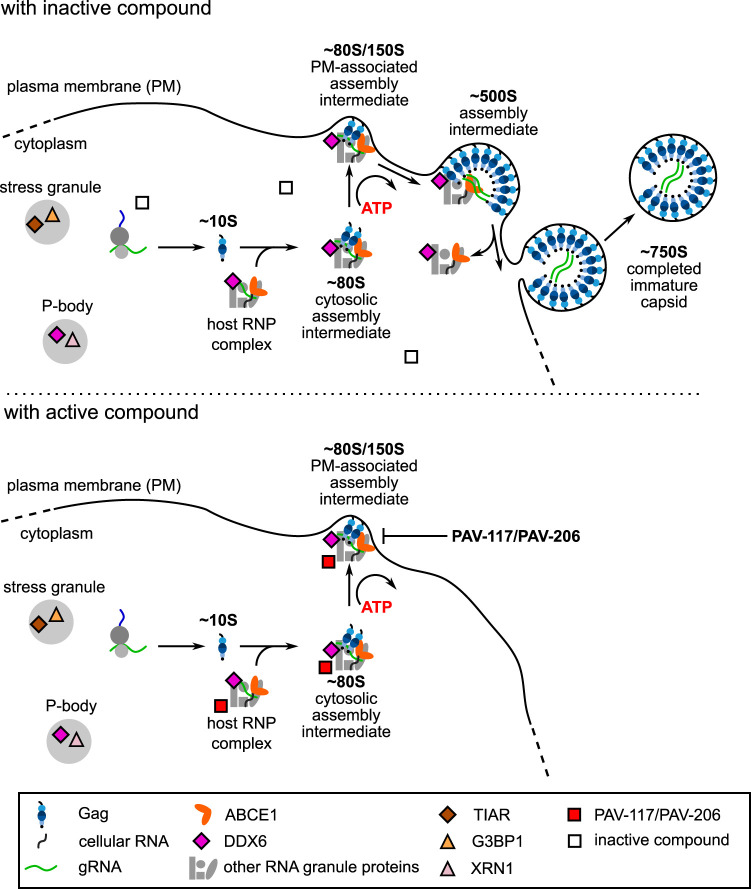
Given the projected increase in multidrug-resistant HIV-1, there is an urgent need for development of antiretrovirals that act on virus life cycle stages not targeted by drugs currently in use. Host-targeting compounds are of particular interest because they can offer a high barrier to resistance. Here, we report identification of two related small molecules that inhibit HIV-1 late events, a part of the HIV-1 life cycle for which potent and specific inhibitors are lacking. This chemotype was discovered using cell-free protein synthesis and assembly systems that recapitulate intracellular host-catalyzed viral capsid assembly pathways. These compounds inhibit replication of HIV-1 in human T cell lines and peripheral blood mononuclear cells, and are effective against a primary isolate. They reduce virus production, likely by inhibiting a posttranslational step in HIV-1 Gag assembly. Notably, the compound colocalizes with HIV-1 Gag in situ; however, unexpectedly, selection experiments failed to identify compound-specific resistance mutations in gag or pol, even though known resistance mutations developed upon parallel nelfinavir selection. Thus, we hypothesized that instead of binding to Gag directly, these compounds localize to assembly intermediates, the intracellular multiprotein complexes containing Gag and host factors that form during immature HIV-1 capsid assembly. Indeed, imaging of infected cells shows compound colocalized with two host enzymes found in assembly intermediates, ABCE1 and DDX6, but not two host proteins found in other complexes. While the exact target and mechanism of action of this chemotype remain to be determined, our findings suggest that these compounds represent first-in-class, host-targeting inhibitors of intracellular events in HIV-1 assembly.IMPORTANCE The success of antiretroviral treatment for HIV-1 is at risk of being undermined by the growing problem of drug resistance. Thus, there is a need to identify antiretrovirals that act on viral life cycle stages not targeted by drugs in use, such as the events of HIV-1 Gag assembly. To address this gap, we developed a compound screen that recapitulates the intracellular events of HIV-1 assembly, including virus-host interactions that promote assembly. This effort led to the identification of a new chemotype that inhibits HIV-1 replication at nanomolar concentrations, likely by acting on assembly. This compound colocalized with Gag and two host enzymes that facilitate capsid assembly. However, resistance selection did not result in compound-specific mutations in gag, suggesting that the chemotype does not directly target Gag. We hypothesize that this chemotype represents a first-in-class inhibitor of virus production that acts by targeting a virus-host complex important for HIV-1 Gag assembly.

Keywords: ABCE1; DDX6; HIV-1 assembly; HIV-1 capsid; RNA granules; antiretroviral agent; cell-free system; drug screen; virus-host interactions.


Figures

FIG 1
FIG 1
HIV-1 life cycle, assembly pathway, and assembly plate screen. (A) Schematic showing each step of the HIV-1 life cycle, beginning with expression of the integrated provirus, followed by the late and early stages of the life cycle, ending with integration in a newly infected cell. The different stages of the virus life cycle are indicated in blue text. Examples of ARV drugs currently in use are in red text, with black labels under blockade arrows indicating the targets of these drugs. The pink line indicates late events in the viral life cycle that are not targeted by currently approved ARV drugs. (B) Schematic showing the host-catalyzed HIV-1 assembly pathway, starting with Gag synthesis and formation of the early ∼10S assembly intermediate. Next, the cytosolic ∼80S intermediate forms when ∼10S Gag coopts a host RNP complex that contains ABCE1 and the RNA granule protein DDX6, two host enzymes that have been shown to facilitate assembly. The ∼80S assembly intermediate appears to target to the plasma membrane where Gag multimerization continues resulting in formation of the ∼150S and subsequently the ∼500S late assembly intermediate. When assembly of ∼750S immature capsid is completed, the host RNP complex is released. Relevant references are in the text. (C) Schematic showing the cell-free protein synthesis and assembly plate screen that was utilized to identify small molecule inhibitors of the host-catalyzed pathway of HIV-1 assembly. Briefly, anti-Gag antibody (capture antibody) binds Gag monomers, oligomers, and multimers generated in a cell-free assembly reaction. The same Gag antibody is used as a detection antibody that binds to captured oligomers and multimers, but not monomers, in proportion to the amount of multimerization, thereby generating a larger fluorescent signal when multimerization occurs. The upper diagram shows anti-Gag antibodies capturing and detecting Gag oligomers and multimers in assembly intermediates formed during an HIV-1 cell-free assembly reaction carried out in the presence of DMSO, which does not inhibit assembly. The lower diagram shows that adding an assembly inhibitor at the start of the cell-free reaction causes fewer Gag oligomers and multimers to be produced, thereby reducing the detection antibody signal relative to signal in the DMSO control.
FIG 2
FIG 2
PAV-117, identified using cell-extract-based assembly screens, inhibits replication of HIV-1, but not FIV or FLUV, in cell culture. (A) Schematic showing the cell-free assembly screening strategy used to identify PAV-117. Small molecules from a compound library of 150,000 compounds were assayed in cell-free screens that recapitulate assembly of eight different viral capsids, including HIV-1, Venezuelan equine encephalitis virus (VEEV), influenza A virus (FLUV), hepatitis C virus (HCV), dengue virus (DENV), Rift Valley fever virus (RVFV), Hantaan virus (HNTV), and rabbit pox virus (RPXV). Each screen is analogous to the HIV-1 screen (see Fig. 1C). Results from the library screens led to generation of a master hit collection of 249 small molecules that displayed inhibitory activity in one or more of the eight cell-free assembly screens. Compounds in the master hit collection were assayed for inhibition of HIV-1 replication in MT-2 T cells, with PAV-117 identified as the compound with optimal EC50, CC50, and other characteristics in the MT-2 assay. (B) Chemical structure of PAV-117, a tetrahydroisoquinolone. (C) To determine the EC50 of PAV-117 against HIV-1 replication, a dose-response curve for inhibition of HIV-1 replication by PAV-117 was generated by treating human MT-2 T cells with the indicated doses of PAV-117, followed by infection with a replication-competent HIV-1 NL4-3 RLuc reporter virus (MOI of 0.02). After 96 h of spreading infection, luciferase activity was measured as an indicator of HIV-1 replication and is displayed as the inhibition of replication relative to DMSO-treated controls (% inhibition). The CC50 was determined in parallel using uninfected MT-2 T cells and is marked by a vertical dashed line. Error bars show the SEM determined from three replicates. (D) Graph showing quantification of infectious FLUV in MDCK cells treated with DMSO or with either PAV-117 or Tamiflu at a concentration 20-fold higher than the EC50 for each drug (0.8 μM for PAV-117, 10 μM for Tamiflu). Treated cells were infected with FLUV (strain WSN/33 [H1N1], MOI of 0.001), and the viral titers were measured after 24 h by TCID50 and are shown as infectious units (107 TCID50 U/ml). (E) To determine the EC50 of PAV-117 against FIV replication, a dose-response curve for the inhibition of FIV replication by PAV-117 was generated by treatment of feline G355-5 cells with the indicated doses of PAV-117, followed by infection with FIV 34TF10 (1,954 nU of RT activity per well). After 144 h of spreading infection, RT activity was measured and used to calculate inhibition of FIV replication relative to DMSO controls (% inhibition). The CC50 was determined in parallel using uninfected G355-5 cells and is marked by a vertical dashed line. Error bars show the SEM determined from three replicates. (F) Quantification of replication of an HIV-1 primary isolate. To determine the EC50 of PAV-117 against HIV-1 replication, a dose-response curve for inhibition of HIV-1 replication by PAV-117 was generated by treating human SupT1.CCR5 cells with the indicated doses of PAV-117 or DMSO, followed by infection with HIV-1 Q23.BG505, a CCR5-tropic subtype A molecular clone. HIV-1 replication proceeded for 96 h and was followed by measurement of HIV-1 infectivity in the culture supernatant using the MUG assay in TZM-bl cells.
FIG 3
FIG 3
PAV-117 acts late in the HIV-1 life cycle, inhibiting virus production but not specific infectivity. (A) Schematic of the early assay, which measures effects on viral entry through early viral gene expression. MT-2 cells were infected with the single-round HIV-1 pNL4-3 RLuc virus (env-deleted and pseudotyped with HIV-1 NL4-3 Env) in the presence of compound or DMSO. After 48 h, luciferase activity was measured and used to calculate inhibition of HIV-1 infection relative to the DMSO control (% inhibition). The graph shows the dose-response curve for inhibition of HIV-1 early events by PAV-117 that was generated using this assay and used to determine the EC50. The CC50 was determined in parallel using uninfected MT-2 T cells and is marked by a vertical dashed line. Error bars in the graph show the SEM determined from three replicates. (B) Schematic of the late assays, which measure the effects on viral late events, starting with the expression of Gag and GagPol through virus release and maturation. Chronically infected H9 T cells (H9-HIV) were treated with either compound or DMSO, and media collected 48 h later were used for two assays: (i) to quantify inhibition of HIV-1 infectivity relative to DMSO control by titering on TZM-bl cells (black curve, used to calculate the EC50 for the inhibition of infectivity) and (ii) to quantify inhibition of virus production by pelleting virus for Western blot (WB) with antibody to HIV-1 Gag (αGag; blue curve, used to calculate the EC50 for the inhibition of virus production). The CC50 was determined in the inhibition assay and is marked by a vertical dashed line. A representative αGag WB of virus pellets is shown below the dose-response graph, with DMSO treatment or concentration of PAV-117 indicated above each WB lane and the percent inhibition of virus production (relative to the DMSO-treated control) indicated below each lane. The error bars in panels A and B show the SEM determined from two replicates.
FIG 4
FIG 4
PAV-117 appears to act during the HIV-1 assembly pathway, after formation of the ∼80S/150S intermediate. MT-2 cells were infected with HIV-1 LAI pro– Δenv (pseudotyped with HIV-1 NL4-3 Env) and treated with DMSO or the indicated concentrations of PAV-117 for 48 h. (A) Cell lysates and media were harvested to analyze effects on intracellular steady-state p55 Gag levels and p55 Gag in VLP, as indicated, using WB with Gag antibody (αGag) to quantify p55 Gag (no p24 was produced due to the use of a protease-deficient virus for infection). (B) Cell lysates were also analyzed for intracellular steady-state levels of two cellular proteins, GAPDH and actin, by WB with αGAPDH and αactin. For panels A and B, the data in the graphs are shown as the percentage of DMSO-treated controls, with error bars showing the SEM from three replicates, and representative WBs are shown below graphs. (C) To quantify intracellular steady-state levels of assembly intermediates, cell lysates from panels A and B were also analyzed by velocity sedimentation, followed by WB of each gradient fraction with αGag. Fraction numbers are indicated above the WB panels, with migration of specific assembly intermediates indicated by brackets above. Graphs show quantification of p55 Gag in fractions containing the ∼10S, ∼80S/150S, and ∼500S intermediates as percentages of the total p55 Gag in the gradient. The expected migration of each protein in WB panels is indicated on the right. Error bars show the SEM determined from three replicates. The ∼500S intermediate is the only intermediate for which a significant difference is observed between the DMSO and 0.75 μM PAV-117 groups, as indicated by an asterisk (P < 0.05).
FIG 5
FIG 5
Analysis of structure-activity relationships identified an analog that potently inhibits HIV-1 replication in PBMCs and a site for tags. (A) The general chemical structure of PAV-117 analogs is shown on the left, indicating the R1, R2, and R3 positions in the pendant benzene ring. The table shows results obtained for analogs in which the R1, R2, and R3 positions contain hydrogen, methyl, methoxy, or benzoyloxy groups as indicated, including the EC50 for inhibition of HIV-1 replication in MT-2 cells and the CC50 in MT-2 cells (assays described in Fig. 2C). Values are shown as the average of multiple independent repeats ×/÷ the GSD, with n = the number of independent repeats. Also shown is the selectivity index (SI), which is equivalent to CC50/EC50. (B) The structure of PAV-206 is shown on the left. The blue dose-response curve shows the inhibition of HIV-1 replication by PAV-206 in MT-2 T cells (using the assay described in Fig. 2C). The orange dose-response curve shows inhibition of HIV-1 replication by PAV-206 in PHA-activated PBMCs infected with unmodified HIV-1 NL4-3 at an MOI of 0.008. (C) On the left is the structure of PAV-818, the biotinylated analog of PAV-206, with the biotin moiety shown in red. Shown on the right is a dose-response curve for inhibition of HIV-1 replication by PAV-818 in MT-2 T cells (assay as in Fig. 2C). In the PAV-818 structure, a diazirine group is shown in blue. This group was added for future cross-linking studies but is not used in the present study. (D) Shown on the left is the structure of PAV-543, a biotinylated compound that does not have antiretroviral activity, with the biotin moiety in red. Shown on the right is a dose-response curve for inhibition of HIV-1 replication by PAV-543 in MT-2 T cells (assay as in Fig. 2C). For all graphs, the indicated EC50 values were determined from the dose-response curves. CC50 values were determined in uninfected cells in parallel and are marked by vertical dashed lines. Error bars in graphs show the SEM from three replicates.
FIG 6
FIG 6
The biotinylated antiretroviral analog of PAV-206 colocalizes with HIV-1 Gag in situ. (A) Schematic of the PLA approach for detecting colocalization of compound with Gag. 293T cells chronically infected with HIV-1 (293T-HIV) or uninfected 293T cells were treated with indicated amounts of PAV-818 (the biotinylated active compound), PAV-543 (the biotinylated inactive compound), or DMSO for 16 h. PLA was performed by incubating with primary antibodies (rabbit anti-biotin and mouse anti-Gag), followed by PLA secondary antibodies (anti-rabbit IgG coupled to [+] PLA oligonucleotide and anti-mouse IgG coupled to [–] PLA oligonucleotide). The addition of other PLA reagents leads to connector oligonucleotides linking the “+” and “–” oligonucleotides only if the primary antibodies are colocalized; this in turn results in the PLA amplification reaction. The addition of an oligonucleotide that recognizes a sequence in the amplified regions and is coupled to a red fluorophore (red star) results in intense spots at sites where biotinylated compound and Gag are colocalized in situ. After PLA, IF was performed by adding secondary antibody conjugated to a green fluorophore (green star) to detect any unoccupied Gag antibody, thus marking Gag-expressing cells with low-level green fluorescence. (B) Graph showing the average number of biotin-Gag PLA spots per cell for each condition, with “+” indicating HIV-1-infected cells and “–” indicating uninfected cells. Twenty fields were analyzed for each group (containing a total of 186 to 316 cells per group), with error bars showing SEM. *, Significant difference in the number of biotin-Gag PLA spots per cell when comparing treatment with PAV-818 versus PAV-543, both at 10 μM (P < 0.001). (C) A representative field for each group quantified in panel B is shown, except for DMSO treatment. Fields on the left show biotin-Gag PLA spots alone in grayscale. To the right are the same fields shown as a merge of three color channels: biotin-Gag PLA (red), Gag IF (green), and DAPI-stained nuclei (blue). Scale bars, 10 μm.
FIG 7
FIG 7
Nonimmune controls for the biotin-Gag, biotin-ABCE1, and biotin-DDX6 proximity ligation assays. (A) NI controls for the biotin-Gag PLA. Above each PLA image is shown the schematic corresponding to the PLA approach in that panel. 293T cells chronically infected with HIV-1 (293T-HIV) were treated with 10 μM PAV-818 (the biotinylated active compound) for 16 h. For the positive control (image and schematic on the right), PLA was performed by incubation with primary antibodies, mouse anti-Gag and rabbit anti-biotin, followed by PLA secondary antibodies and other reagents as described in Fig. 6. In the two negative controls (image and schematic at left and center), one primary antibody was replaced with a NI control antibody from the same species, as indicated. Red spots indicating colocalization of the biotinylated compound with Gag should be absent when either primary antibody is replaced by a NI antibody. After PLA, IF was performed to mark either Gag-expressing or biotin-containing cells with low-level green fluorescence. Images show a representative field for each of the three antibody pairs. Fields are shown as a merge of three color channels: the red channel shows biotin-NI PLA, NI-Gag PLA, or biotin-Gag PLA, as indicated by red labeling above images; the green channel shows biotin IF or Gag IF, as indicated by green labeling above images; and the blue channel shows DAPI-stained nuclei. Scale bars, 10 μm. Graph below shows the average number of PLA spots per cell for each antibody pair. A total of 10 to 20 fields were analyzed for each group (containing 118 to 213 cells per group), with error bars showing the SEM. (B) NI controls for the biotin-ABCE1 PLA (top row of images) and biotin-DDX6 PLA (bottom row of images). Figure organization and 293T-HIV treatments are as in panel A above. For the positive control (images and schematic on the right), PLA was performed by incubation with primary antibodies, rabbit anti-host protein (ABCE1 in top row; DDX6 in bottom row) and mouse anti-biotin, followed by PLA secondary antibodies and other reagents as described in Fig. 6. In the two negative controls (images and schematics at left and center), one primary antibody was replaced with a NI control antibody from the same species, as indicated. Red spots indicating colocalization of the biotinylated compound with the host proteins ABCE1 and DDX6 should be absent when either primary antibody is replaced by a NI antibody. After PLA, IF was performed with the indicated antibody (green fluorescence). Images show a representative field for each of the three antibody pairs. Fields are shown as a merge of three color channels: the red channel shows biotin-NI PLA, NI-host protein PLA, or biotin-host protein PLA, as indicated by red labeling above images; the green channel shows biotin IF or host protein IF, as indicated by green labeling above images; and the blue channel shows DAPI-stained nuclei. Scale bars, 10 μm. Graphs below shows the average number of PLA spots per cell for each antibody pair (ABCE1 on the left; DDX6 on the right). Five fields were analyzed for each group (containing a total of 43 to 77 cells per group), with error bars showing the SEM.
FIG 8
FIG 8
Resistance mutations in gag or pol were not observed upon selection with PAV-206 in cell culture. (A) An NL4-3 virus stock was passaged weekly for 37 weeks in the presence of either PAV-206 or nelfinavir starting at a concentration of 1× EC50. The concentration of compound was increased 2-fold when compound-treated cultures reached maximum viral CPE in a time frame similar to a parallel DMSO control. The graph shows the compound concentration as the fold-EC50 versus week of selection (passage number) for PAV-206 (left) or nelfinavir (right). Red arrows indicate passages where virus was amplified, along with either sequencing of gag alone, gag and protease, or the full genome minus the LTRs (as indicated above the red arrows). (B) For each selection (PAV-206 versus nelfinavir), an HIV-1 genome map is shown, with positions of viral open reading frames (ORFs), 5′ LTR, and 3′ LTR, with a line below indicating their approximate nucleotide positions within the HIV-1 genome. In each case, ORFs in which dominant nonsynonymous mutations emerged during selection are color-coded as follows: gag, blue; pro, red; and env, brown. Beneath the HIV-1 genome maps, dominant nonsynonymous amino acid mutations (identified through sequencing of passages indicated by red arrows in panel A) are shown according to their position in the genome map at the top of panel B. The passage (P) in which these mutations were identified is indicated to the left of each genome map line. The amino acid mutations are color-coded according to the ORF in which they were found (colors described above). As indicated in the boxed legend, which applies to both panels, cyclophilin A binding loop mutations that have been previously identified as tissue culture adaptations are marked with a dagger symbol, and previously described nelfinavir-specific mutations are marked with an asterisk (with all references for these in the text and Tables 1 and 2).
FIG 9
FIG 9
Two markers of HIV-1 assembly intermediates, ABCE1 and DDX6, are colocalized in untreated HIV-1-expressing cells. The schematic shows the PLA approach for detecting colocalization of ABCE1 with DDX6. 293T cells chronically infected with HIV-1 (293T-HIV) but not treated with any compounds were analyzed by PLA, as described in the Fig. 6 legend, except that the primary antibodies used were rabbit anti-ABCE1 and mouse anti-DDX6, with red spots representing sites where ABCE1 and DDX6 are colocalized in situ. The graph shows the average number of ABCE1-DDX6 spots per cell. Ten fields were analyzed (containing a total of 121 cells), with error bars showing the SEM. A representative field is shown, with the image on the left displaying ABCE1-DDX6 PLA spots alone in grayscale, and the image on the right displaying a merge of three color channels: ABCE1-DDX6 PLA (red), DDX6 IF (green), and DAPI-stained nuclei (blue).
FIG 10
FIG 10
The biotinylated antiretroviral PAV-206 analog colocalizes in situ with ABCE1, a host component of assembly intermediates. (A) Schematic of the PLA approach for detecting colocalization of compound with ABCE1. 293T cells chronically infected with HIV-1 (293T-HIV) or uninfected 293T cells were treated with indicated amounts of PAV-818 (the biotinylated active compound), PAV-543 (the biotinylated inactive compound), or DMSO for 16 h. PLA was performed by incubation with primary antibodies (mouse anti-biotin and rabbit anti-ABCE1), followed by PLA secondary antibodies and other reagents as described in Fig. 6. Red spots indicate sites where biotinylated compound and ABCE1 are colocalized in situ. After PLA, IF was performed (green star) to mark intracellular ABCE1 with low-level green fluorescence. (B) The graph shows the average number of biotin-ABCE1 PLA spots per cell for each condition, with “+” indicating HIV-1-infected cells and “–” indicating uninfected cells. Ten fields were analyzed for each group (containing a total of 104 to 155 cells per group), with error bars showing the SEM. *, Significant difference in the number of biotin-ABCE1 PLA spots per cell when comparing treatment with PAV-818 versus PAV-543, both at 10 μM (P < 0.001). (C) A representative field for each group quantified in panel B is shown, except for DMSO treatment. Fields on the left show biotin-ABCE1 PLA spots alone in grayscale. To the right are the same fields shown as a merge of three color channels: biotin-ABCE1 PLA (red), ABCE1 IF (green), and DAPI-stained nuclei (blue). Scale bars, 10 μm.
FIG 11
FIG 11
The biotinylated antiretroviral PAV-206 analog colocalizes in situ with DDX6, an RNA granule protein in assembly intermediates that colocalizes with ABCE1. (A) Schematic of the PLA approach for detecting colocalization of compound with DDX6. 293T cells chronically infected with HIV-1 (293T-HIV) or uninfected 293T cells were treated with indicated amounts of PAV-818 (the biotinylated active compound), PAV-543 (the biotinylated inactive compound), or DMSO for 16 h. PLA was performed by incubation with primary antibodies (mouse anti-biotin and rabbit anti-DDX6), followed by PLA secondary antibodies and other reagents as described in Fig. 6. Red spots indicate sites where biotinylated compound and DDX6 are colocalized in situ. After PLA, IF was performed (green star) to mark intracellular DDX6 with low-level green fluorescence. (B) The graph shows the average number of biotin-DDX6 PLA spots per cell for each condition, with “+” indicating HIV-1-infected cells and “–” indicating uninfected cells. Five fields were analyzed for each group (containing a total of 39 to 73 cells per group), with error bars showing the SEM. *, Significant difference in the number of biotin-DDX6 PLA spots per cell when comparing treatment with PAV-818 versus PAV-543, both at 10 μM (P < 0.001). (C) A representative field for each group quantified in panel B is shown, except for DMSO treatment. Fields on the left show biotin-DDX6 PLA spots alone in grayscale. To the right are the same fields shown as a merge of three color channels: biotin-DDX6 PLA (red), DDX6 IF (green), and DAPI-stained nuclei (blue). Scale bars, 10 μm.
FIG 12
FIG 12
The biotinylated antiretroviral PAV-206 analog does not colocalize in situ with G3BP1, an RNA granule protein in stress granules. (A) Schematic of the PLA approaches for detecting colocalization of compound with G3BP1 and colocalization of G3BP1 with TIAR, two known stress granule proteins, are shown. 293T cells chronically infected with HIV-1 (293T-HIV) were treated with 10 μM PAV-818 (the biotinylated active compound), 10 μM PAV-543 (the biotinylated inactive compound), or DMSO for 16 h. The upper diagram depicts biotin-G3BP1 PLA performed by incubation with primary antibodies (mouse anti-biotin and rabbit anti-G3BP1), followed by PLA secondary antibodies and other reagents as described in Fig. 6. Red spots indicate sites where biotinylated compound and G3BP1 are colocalized in situ. The lower diagram depicts TIAR-G3BP1 PLA performed by incubation with primary antibodies (mouse anti-TIAR and rabbit anti-G3BP1), followed by PLA secondary antibodies and reagents as described in Fig. 6. Red spots indicate sites where the two stress granule proteins TIAR and G3BP1 are colocalized in situ. For upper and lower panels, following PLA, IF was performed (green star) to mark intracellular G3BP1 with low-level green fluorescence. (B) Left side of graph (dark gray bars) shows the average number of biotin-G3BP1 PLA spots per cell for each condition with representative images shown in panel C at the left. Five fields were analyzed for each group (containing a total of 63 to 83 cells per group), with error bars showing the SEM. The right side of the graph (light gray bars) shows the average number of TIAR-G3BP1 PLA spots per cell for each condition, with representative images shown in panel C at the right. Five fields were analyzed for each group (containing a total of 63 to 75 cells per group), with error bars showing the SEM. (C) A representative field for each group quantified in the graph is shown. The two leftmost columns of images display biotin-G3BP1 PLA spots alone in grayscale (first column) and a merge of three color channels (second column): biotin-G3BP1 PLA (red), G3BP1 IF (green), and DAPI-stained nuclei (blue). The two rightmost columns of images display TIAR-G3BP1 PLA spots alone in grayscale (third column) and a merge of three color channels (fourth column): TIAR-G3BP1 PLA (red), G3BP1 IF (green), and DAPI-stained nuclei (blue). Scale bars, 10 μm.
FIG 13
FIG 13
Nonimmune controls for the TIAR-G3BP1 and DDX6-XRN1 proximity ligation assays. (A) NI controls for the TIAR-G3BP1 PLA. Above each PLA image is the schematic corresponding to the PLA approach in that panel. Untreated 293T cells chronically infected with HIV-1 (293T-HIV) were analyzed by PLA. For the positive control (image and schematic on the right), PLA was performed by incubating with primary antibodies, mouse anti-TIAR and rabbit anti-G3BP1, followed by PLA secondary antibodies and other reagents as described in Fig. 6. In the two negative controls (images and schematics at left and center), one primary antibody was replaced with an NI control antibody from the same species, as indicated. Red spots indicating colocalization of the TIAR with G3BP should be absent when either primary antibody is replaced by an NI antibody. After PLA, TIAR or G3BP IF was performed to mark host protein-expressing cells with low-level green fluorescence. Images show a representative field for each of the three antibody pairs. Fields are shown as a merge of three color channels: the red channel shows TIAR-G3BP1 PLA, TIAR-NI PLA, or NI-G3BP1 PLA, as indicated by red labeling above images; the green channel shows TIAR IF or G3BP1 IF as indicated by green labeling above images; and the blue channel shows DAPI-stained nuclei. Scale bars, 10 μm. Graph below shows the average number of PLA spots per cell for each antibody pair. Five fields were analyzed for each group (containing a total of 45 to 62 cells per group), with error bars showing the SEM. (B) NI controls for the DDX6-XRN1 PLA. Above each PLA image is the schematic corresponding to the to the PLA approach in that panel. Untreated 293T cells chronically infected with HIV-1 (293T-HIV) were analyzed by PLA. For the positive control (image and schematic on the right), PLA was performed by incubating with primary antibodies, mouse anti-DDX6 and rabbit anti-XRN1, followed by PLA secondary antibodies and other reagents as described in Fig. 6. In the two negative controls (images and schematics at left and center), one primary antibody was replaced with an NI control antibody from the same species, as indicated. Red spots indicating colocalization of the DDX6 with XRN1 should be absent when either primary antibody is replaced by a NI antibody. Following PLA, DDX6 or XRN1 IF was performed to mark host protein-expressing cells with low-level green fluorescence. Images show a representative field for each of the three antibody pairs. Fields are shown as a merge of three color channels: the red channel shows DDX6-XRN1 PLA, DDX6-NI PLA, or NI-XRN1 PLA, as indicated by red labeling above images; the green channel shows DDX6 IF or XRN1 IF, as indicated by green labeling above images; and the blue channel shows DAPI-stained nuclei. Scale bars, 10 μm. Graph below shows the average number of PLA spots per cell for each antibody pair. Five fields were analyzed for each group (containing a total of 46 to 73 cells per group), with error bars showing the SEM.
FIG 14
FIG 14
The biotinylated antiretroviral PAV-206 analog does not colocalize in situ with XRN1, a host enzyme found in P-bodies. (A) Schematic of the PLA approaches for detecting colocalization of compound with XRN1 and colocalization of XRN1 with DDX6, both known to be present in P-bodies, are shown. 293T cells chronically infected with HIV-1 (293T-HIV) were treated with 10 μM PAV-818 (the biotinylated active compound), 10 μM PAV-543 (the biotinylated inactive compound), or DMSO for 16 h. The upper diagram depicts biotin-XRN1 PLA performed by incubation with primary antibodies (mouse anti-biotin and rabbit anti-XRN1), followed by PLA secondary antibodies and reagents as described in Fig. 6. Red spots indicate sites where biotinylated compound and XRN1 are colocalized in situ. After PLA, IF was performed (green star) to mark intracellular XRN1 with low-level green fluorescence. The lower diagram depicts DDX6-XRN1 PLA performed by incubation with primary antibodies (mouse anti-DDX6 and rabbit anti-XRN1), followed by PLA secondary antibodies as described as described in Fig. 6. Red spots indicate sites where the two P-body proteins DDX6 and XRN1 are colocalized in situ. After PLA, IF was performed (green star) to mark intracellular DDX6 with low-level green fluorescence. (B) The left side of the graph (dark gray bars) shows the average number of biotin-XRN1 PLA spots per cell for each condition, with representative images shown in panel C at the left. Five fields were analyzed for each group (containing a total of 44 to 54 cells per group), with error bars showing the SEM. The right side of the graph (light gray bars) shows the average number of DDX6-XRN1 PLA spots per cell for each condition, with representative images shown in panel C at the right. Five fields were analyzed for each group (containing a total of 57–73 cells per group), with error bars showing the SEM. (C) A representative field for each group quantified in the graph is shown. The two leftmost columns of images display biotin-XRN1 PLA spots alone in grayscale (first column) and a merge of three color channels (second column): biotin-XRN1 PLA (red), XRN1 IF (green), and DAPI-stained nuclei (blue). The two rightmost columns of images display DDX6-XRN1 PLA spots alone in grayscale (third column) and a merge of three color channels (fourth column): DDX6-XRN1 PLA (red), DDX6 IF (green), and DAPI-stained nuclei (blue). White arrows show sites where DDX6-XRN1 PLA signal colocalizes with large DDX6-IF-positive structures that are likely to be P-bodies. Scale bars, 10 μm.
FIG 15
FIG 15
Model for the action of PAV-206, a possible first-in-class selective inhibitor of HIV-1 assembly. Upper diagram shows the intracellular pathway for HIV-1 immature capsid assembly, in the presence of an inactive compound, starting with synthesis of HIV-1 Gag and formation of the early ∼10S assembly intermediate. The ∼80S assembly intermediate is formed when HIV-1 Gag coopts a host RNP complex related to an RNA granule to form the ∼80S cytosolic intermediate. This and subsequent intermediates contain Gag associated with ABCE1, DDX6, other host factors, and HIV-1 gRNA. After targeting of the cytosolic ∼80S assembly intermediate to the host plasma membrane, Gag multimerization continues leading to the formation of the ∼500S assembly intermediate. The host proteins are released upon formation of the ∼750S completed immature capsid, and budding results in release of the completed immature capsid. The lower diagram shows one model for PAV-117/PAV-206 activity based on the findings in this study. Our colocalization studies suggest that this chemotype is associated with both the HIV-1 assembly intermediates and the host RNA-granule-related complex from which they are derived, since the compound colocalizes with two host components of this complex, ABCE1 and DDX6, in the presence and absence of Gag. The compound does not colocalize with G3BP1 or XRN1, proteins found in stress granules and P-bodies, indicating that this chemotype acts with some selectivity for the RNP complex that is coopted to form assembly intermediates. In addition, we observed a reduction of virus production and the amount of ∼500S assembly intermediate in PAV-117-treated infected cells. Thus, we hypothesize that PAV-117/PAV-206 inhibits virus production by acting during the HIV-1 immature capsid assembly pathway to inhibit progression of assembly past the ∼80S/150S assembly intermediate.

Similar articles

Cited by

References

    1. UNAIDS . 2019. Global HIV & AIDS statistics—2019 fact sheet. https://www.unaids.org/en/resources/fact-sheet.
    1. Pham HT, Mesplede T. 2018. The latest evidence for possible HIV-1 curative strategies. Drugs Context 7:212522. doi:10.7573/dic.212522. - DOI - PMC - PubMed
    1. Collier DA, Monit C, Gupta RK. 2019. The impact of HIV-1 drug escape on the global treatment landscape. Cell Host Microbe 26:48–60. doi:10.1016/j.chom.2019.06.010. - DOI - PubMed
    1. Boender TS, Sigaloff KC, McMahon JH, Kiertiburanakul S, Jordan MR, Barcarolo J, Ford N, Rinke de Wit TF, Bertagnolio S. 2015. Long-term virological outcomes of first-line antiretroviral therapy for HIV-1 in low- and middle-income countries: a systematic review and meta-analysis. Clin Infect Dis 61:1453–1461. doi:10.1093/cid/civ556. - DOI - PMC - PubMed
    1. Gregson J, Kaleebu P, Marconi VC, van Vuuren C, Ndembi N, Hamers RL, Kanki P, Hoffmann CJ, Lockman S, Pillay D, de Oliveira T, Clumeck N, Hunt G, Kerschberger B, Shafer RW, Yang C, Raizes E, Kantor R, Gupta RK. 2017. Occult HIV-1 drug resistance to thymidine analogues following failure of first-line tenofovir combined with a cytosine analogue and nevirapine or efavirenz in sub Saharan Africa: a retrospective multi-centre cohort study. Lancet Infect Dis 17:296–304. doi:10.1016/S1473-3099(16)30469-8. - DOI - PMC - PubMed

Publication types

MeSH terms

Substances