

Role of LmeA, a Mycobacterial Periplasmic Protein, in Maintaining the Mannosyltransferase MptA and Its Product Lipomannan under Stress
- PMID: 33148829
- PMCID: PMC7643837
- DOI: 10.1128/mSphere.01039-20
Role of LmeA, a Mycobacterial Periplasmic Protein, in Maintaining the Mannosyltransferase MptA and Its Product Lipomannan under Stress
Abstract
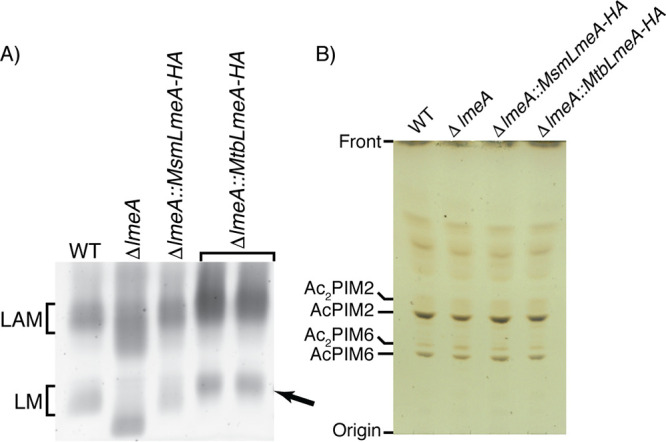
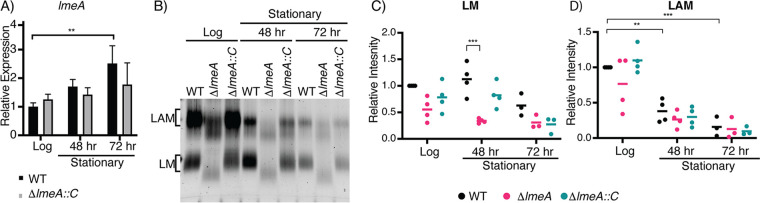
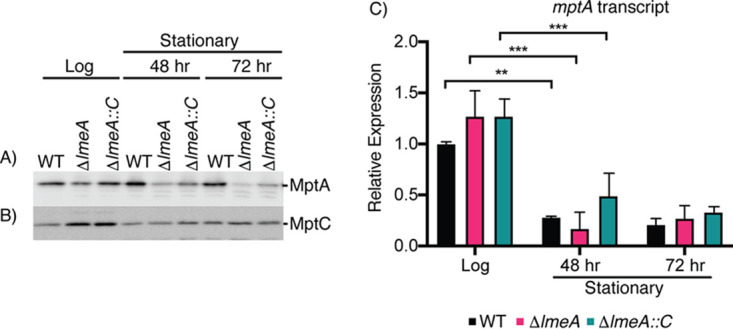
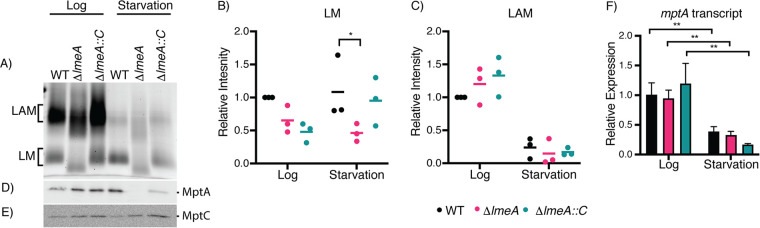
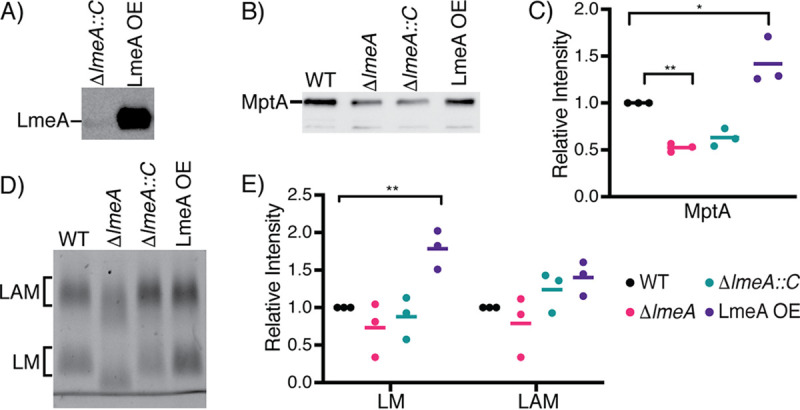
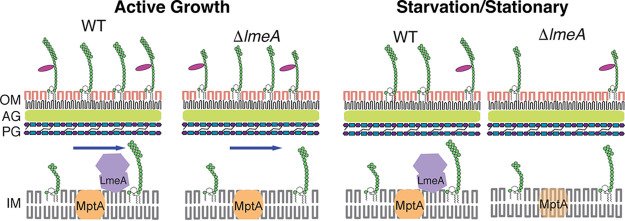
The mycobacterial cell envelope has a diderm structure, composed of an outer mycomembrane, an arabinogalactan-peptidoglycan cell wall, a periplasm, and an inner membrane. Lipomannan (LM) and lipoarabinomannan (LAM) are structural and immunomodulatory components of this cell envelope. LM/LAM biosynthesis involves a number of mannosyltransferases and acyltransferases, and MptA is an α1,6-mannosyltransferase involved in the final extension of the mannan chain. Recently, we reported the periplasmic protein LmeA being involved in the maturation of the mannan backbone in Mycobacterium smegmatis Here, we examined the role of LmeA under stress conditions. We found that lmeA transcription was upregulated under two stress conditions: stationary growth phase and nutrient starvation. Under both conditions, LAM was decreased, but LM was relatively stable, suggesting that maintaining the cellular level of LM under stress is important. Surprisingly, the protein levels of MptA were decreased in an lmeA deletion (ΔlmeA) mutant under both stress conditions. The transcript levels of mptA in the ΔlmeA mutant were similar to or even higher than those in the wild type, indicating that the decrease of MptA protein was a posttranscriptional event. The ΔlmeA mutant was unable to maintain the cellular level of LM under stress, consistent with the decrease in MptA. Even during active growth, overexpression of LmeA led the cells to produce more LM and become more resistant to several antibiotics. Altogether, our study reveals the roles of LmeA in the homeostasis of the MptA mannosyltransferase, particularly under stress conditions, ensuring the stable expression of LM and the maintenance of cell envelope integrity.IMPORTANCE Mycobacteria differentially regulate the cellular amounts of lipoglycans in response to environmental changes, but the molecular mechanisms of this regulation remain unknown. Here, we demonstrate that cellular lipoarabinomannan (LAM) levels rapidly decline under two stress conditions, stationary growth phase and nutrient starvation, while the levels of another related lipoglycan, lipomannan (LM), stay relatively constant. The persistence of LM under stress correlated with the maintenance of two key mannosyltransferases, MptA and MptC, in the LM biosynthetic pathway. We further showed that the stress exposures lead to the upregulation of lmeA gene expression and that the periplasmic protein LmeA plays a key role in maintaining the enzyme MptA and its product LM under stress conditions. These findings reveal new aspects of how lipoglycan biosynthesis is regulated under stress conditions in mycobacteria.
Keywords: Mycobacterium; biosynthesis; glycolipids; mannose; stress response.
Copyright © 2020 Rahlwes et al.
Figures
Similar articles
-
The cell envelope-associated phospholipid-binding protein LmeA is required for mannan polymerization in mycobacteria.J Biol Chem. 2017 Oct 20;292(42):17407-17417. doi: 10.1074/jbc.M117.804377. Epub 2017 Aug 29. J Biol Chem. 2017. PMID: 28855252 Free PMC article.
-
Controlled expression of branch-forming mannosyltransferase is critical for mycobacterial lipoarabinomannan biosynthesis.J Biol Chem. 2010 Apr 30;285(18):13326-36. doi: 10.1074/jbc.M109.077297. Epub 2010 Mar 9. J Biol Chem. 2010. PMID: 20215111 Free PMC article.
-
Identification of a Membrane Protein Required for Lipomannan Maturation and Lipoarabinomannan Synthesis in Corynebacterineae.J Biol Chem. 2017 Mar 24;292(12):4976-4986. doi: 10.1074/jbc.M116.772202. Epub 2017 Feb 6. J Biol Chem. 2017. PMID: 28167532 Free PMC article.
-
Molecular basis of phosphatidyl-myo-inositol mannoside biosynthesis and regulation in mycobacteria.J Biol Chem. 2010 Oct 29;285(44):33577-83. doi: 10.1074/jbc.R110.168328. Epub 2010 Aug 27. J Biol Chem. 2010. PMID: 20801880 Free PMC article. Review.
-
Mycobacterial lipoarabinomannan and related lipoglycans: from biogenesis to modulation of the immune response.Mol Microbiol. 2004 Jul;53(2):391-403. doi: 10.1111/j.1365-2958.2004.04183.x. Mol Microbiol. 2004. PMID: 15228522 Review.
Cited by
-
Rational development of mycobacteria cell factory for advancing the steroid biomanufacturing.World J Microbiol Biotechnol. 2022 Aug 17;38(11):191. doi: 10.1007/s11274-022-03369-3. World J Microbiol Biotechnol. 2022. PMID: 35974205 Free PMC article. Review.
-
Proton gradient controls the lateral rearrangement of inner membrane domains in response to membrane fluidizer stress in Mycobacterium smegmatis.J Biol Chem. 2025 Jul;301(7):110361. doi: 10.1016/j.jbc.2025.110361. Epub 2025 Jun 11. J Biol Chem. 2025. PMID: 40513951 Free PMC article.
-
Transcriptional Response of Mycobacterium tuberculosis to Cigarette Smoke Condensate.Front Microbiol. 2021 Oct 15;12:744800. doi: 10.3389/fmicb.2021.744800. eCollection 2021. Front Microbiol. 2021. PMID: 34721344 Free PMC article.
-
Drug-Tolerant Mycobacterium tuberculosis Adopt Different Survival Strategies in Alveolar Macrophages of Patients with Pulmonary Tuberculosis.Int J Mol Sci. 2023 Oct 6;24(19):14942. doi: 10.3390/ijms241914942. Int J Mol Sci. 2023. PMID: 37834390 Free PMC article.
-
Crystal structure of the putative cell-wall lipoglycan biosynthesis protein LmcA from Mycobacterium smegmatis.Acta Crystallogr D Struct Biol. 2022 Apr 1;78(Pt 4):494-508. doi: 10.1107/S2059798322001772. Epub 2022 Mar 11. Acta Crystallogr D Struct Biol. 2022. PMID: 35362472 Free PMC article.
References
-
- World Health Organization. 2018. Global tuberculosis report. World Health Organization, Geneva, Switzerland.
Publication types
MeSH terms
Substances
LinkOut - more resources
Full Text Sources
