. 2020 Nov 5;5(21):e133488.
doi: 10.1172/jci.insight.133488.

Repeated hypoglycemia remodels neural inputs and disrupts mitochondrial function to blunt glucose-inhibited GHRH neuron responsiveness

Affiliations

Repeated hypoglycemia remodels neural inputs and disrupts mitochondrial function to blunt glucose-inhibited GHRH neuron responsiveness

Mitchell Bayne et al. JCI Insight. .

Abstract

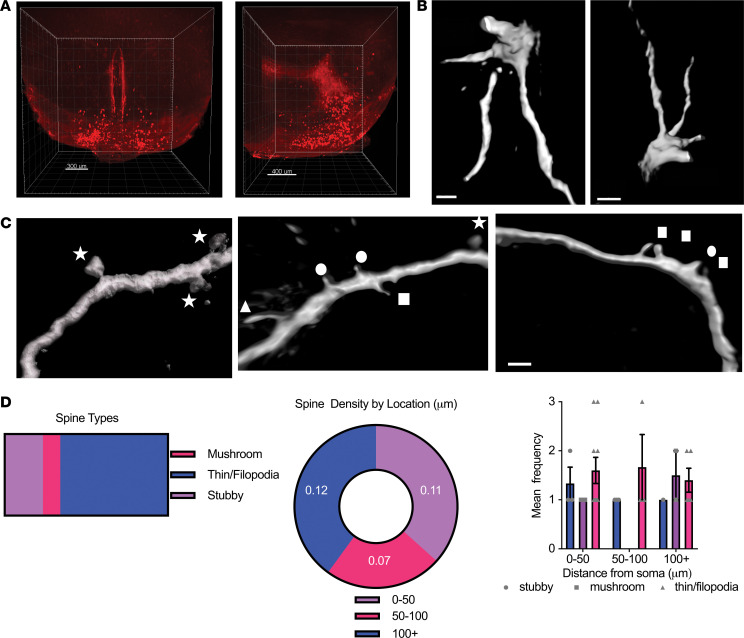
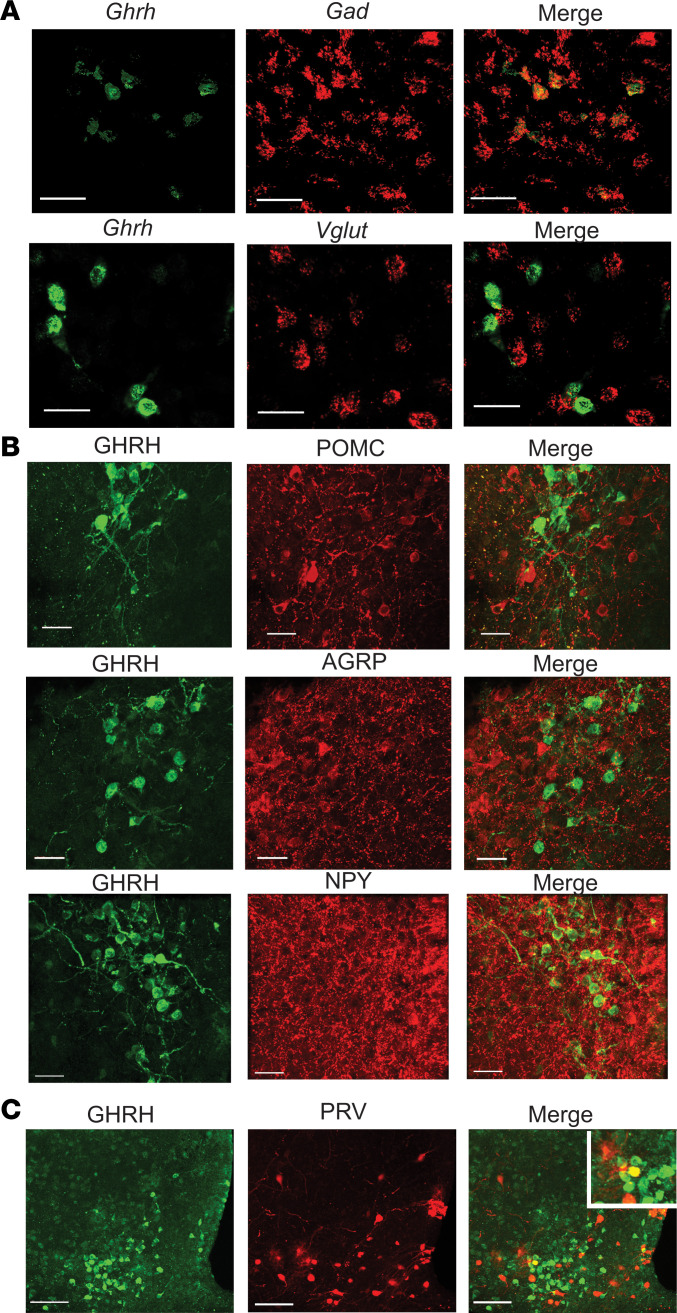
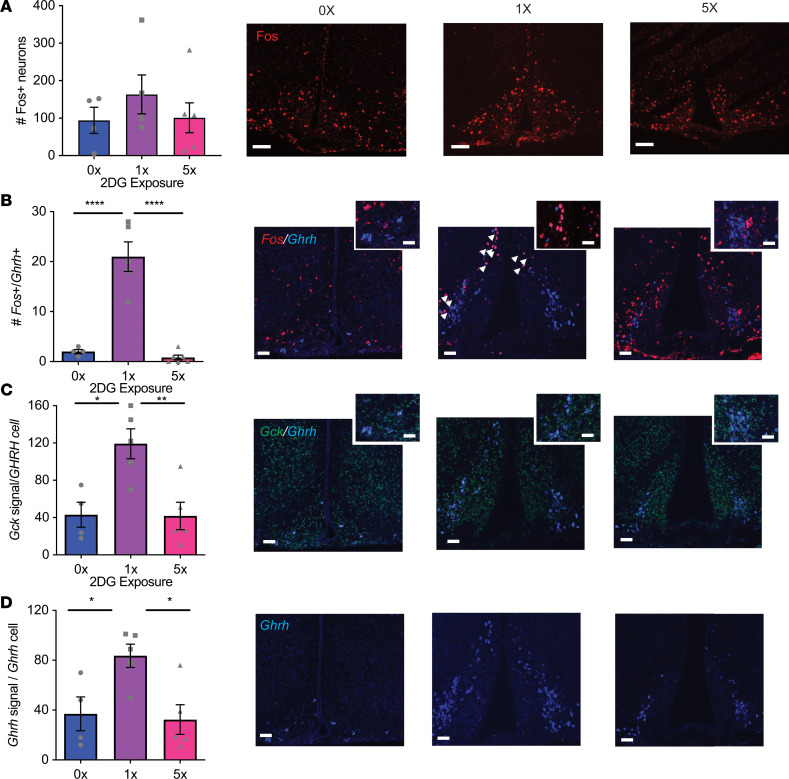
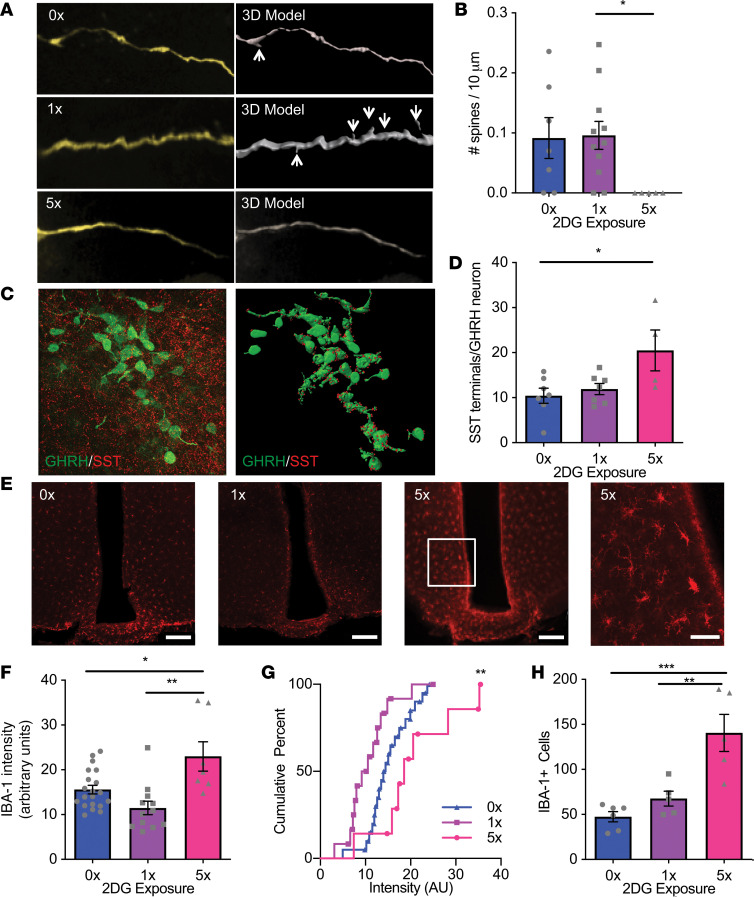
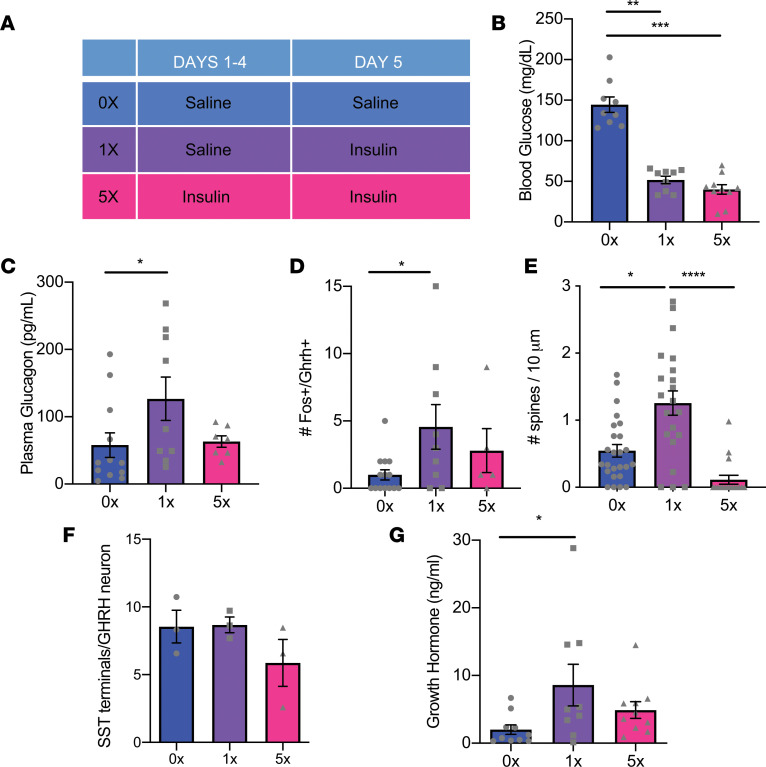
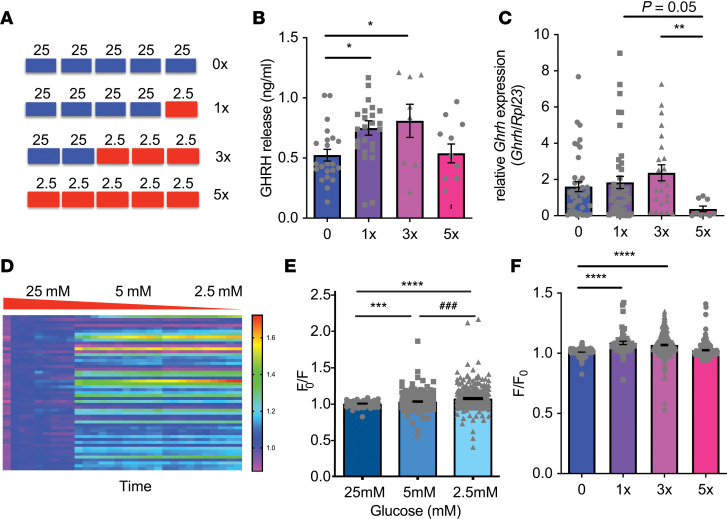
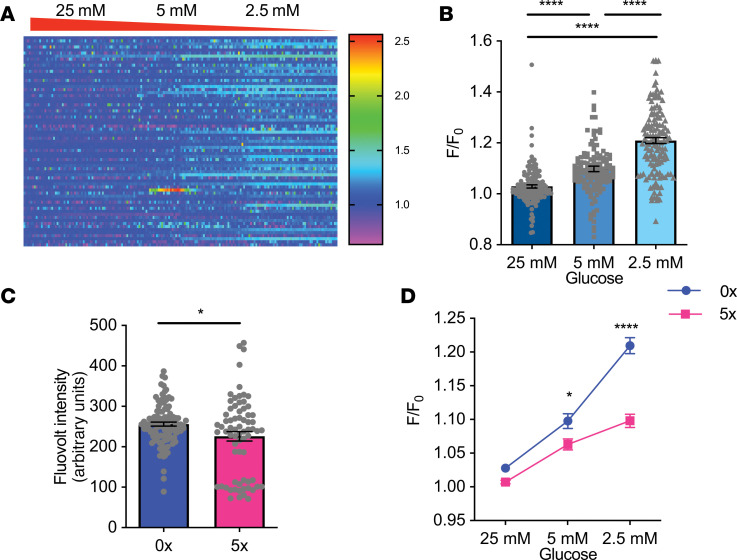
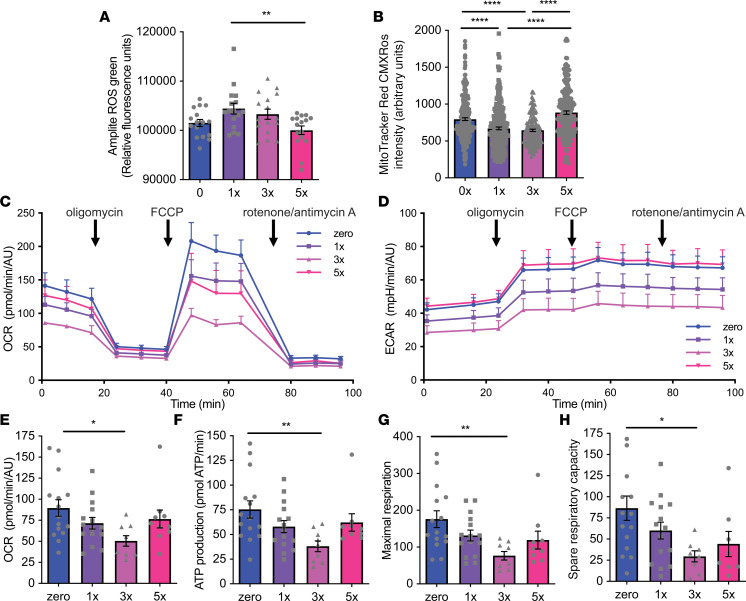
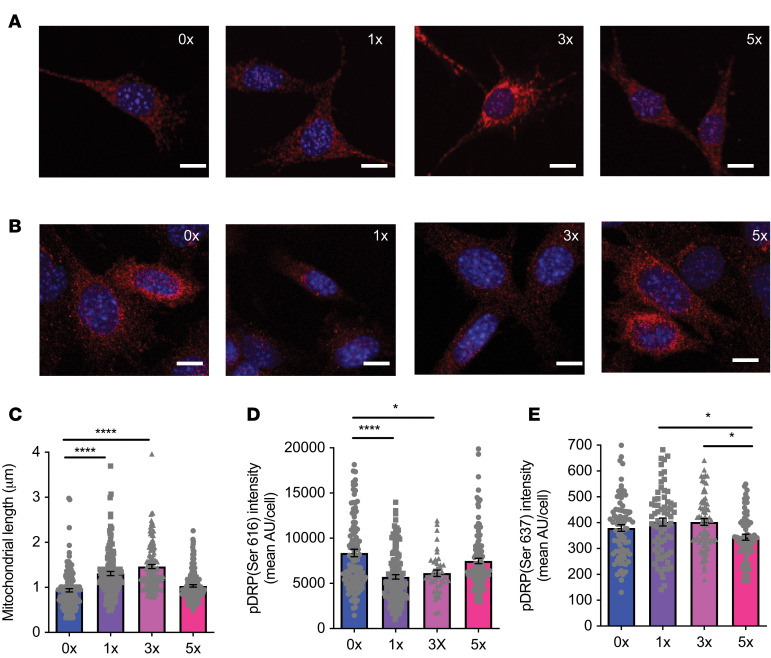
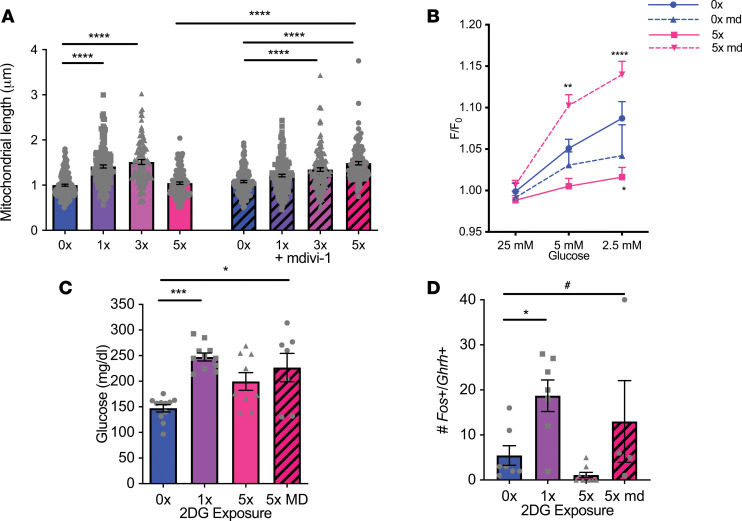
Hypoglycemia is a frequent complication of diabetes, limiting therapy and increasing morbidity and mortality. With recurrent hypoglycemia, the counterregulatory response (CRR) to decreased blood glucose is blunted, resulting in hypoglycemia-associated autonomic failure (HAAF). The mechanisms leading to these blunted effects are only poorly understood. Here, we report, with ISH, IHC, and the tissue-clearing capability of iDISCO+, that growth hormone releasing hormone (GHRH) neurons represent a unique population of arcuate nucleus neurons activated by glucose deprivation in vivo. Repeated glucose deprivation reduces GHRH neuron activation and remodels excitatory and inhibitory inputs to GHRH neurons. We show that low glucose sensing is coupled to GHRH neuron depolarization, decreased ATP production, and mitochondrial fusion. Repeated hypoglycemia attenuates these responses during low glucose. By maintaining mitochondrial length with the small molecule mitochondrial division inhibitor-1, we preserved hypoglycemia sensitivity in vitro and in vivo. Our findings present possible mechanisms for the blunting of the CRR, significantly broaden our understanding of the structure of GHRH neurons, and reveal that mitochondrial dynamics play an important role in HAAF. We conclude that interventions targeting mitochondrial fission in GHRH neurons may offer a new pathway to prevent HAAF in patients with diabetes.

Keywords: Diabetes; Metabolism; Neuroscience.


Conflict of interest statement

Conflict of interest: SAS is a named inventor on patent PCT/US2012/052391 and patent application PCT/US2015/051457 and is a cofounder of, consults for, and has equity in the private company Redpin Therapeutics.

Figures

Figure 1
Figure 1. GHRH neurons are multipolar neurons with sparse dendritic processes.
(A) Light sheet images of brains from GHRH-GFP mice with optical clearing by iDISCO+ showing distribution of GFP+ GHRH neurons in coronal and sagittal planes. GFP+ neurons are pseudocolored red. (B) 3D reconstruction of multipolar GHRH neurons after Alexa Fluor 555 filling and confocal imaging. Scale bars: 2 μm (left), 3 μm (right). (C) Maximum-intensity projections of GHRH neurons demonstrating dendritic spine types: thin (rectangles), filopodia (triangle), mushroom (stars), and stubby (circles). Scale bar: 1 μm. (D) Proportion of dendritic spine types on filled GHRH neurons (left). Distribution of all dendritic spines with distance from the soma (center) and distribution of specific spine types with distance from the soma (right) (n = 47).
Figure 2
Figure 2. ARC GHRH neurons are non–agouti related peptide, non–pro-opiomelanocortin GABAergic neurons synaptically connected to the pancreas.
(A) FISH for GHRH and GAD2 (upper) or VGLUT2 (lower panel) in the ARC (n = 4/marker). Scale bar: 30 μm. (B) IHC for GFP and pro-opiomelanocortin (POMC, upper), agouti related peptide (AGRP, middle), and neuropeptide Y (NPY, lower panel) in the ARC of GHRH-GFP mice (n = 5/marker). Scale bar: 30 μm. (C) IHC for GFP and PRV-RFP in the ARC after intrapancreatic injection of PRV-RFP in GHRH-GFP mice. Inset: Overlap between GFP and RFP immunolabeling (n = 5). Scale bar: 80 μm.
Figure 3
Figure 3. GHRH neuron activation by acute glucose deprivation is impaired by repeated glucose deprivation.
Confocal images and quantification of FISH after vehicle (0x) or single (1x) or repeated (5x) i.p. 2DG administration. (A) ARC cfos; n = 4–6/group. (B) Cfos and Ghrh; ****P < 0.0001 vs. 0x and vs. 5x F[2, 12] = 42.1, n = 4–6/group. Arrowheads indicate neurons’ expression of both Fos and Ghrh. (C) Gck and Ghrh in the ARC; *P = 0.013 vs. 0x and **P = 0.008 vs. 5x, F[2, 11] = 8.94, n = 4–5/group. (D) Ghrh in the ARC; *P = 0.04 vs. 0x and **P = 0.02 vs. 5x, F[2, 11] = 6.34, n = 4–5/group. One-way ANOVA with Tukey’s multiple-comparisons test. Scale bars: 100 μm (main images), 30 μm (insets). Each dot represents results from individual animals and data are displayed as mean ± SEM.
Figure 4
Figure 4. Repeated glucose deprivation disrupts inputs into GHRH neurons and activates microglia.
(A) Confocal analyses (left) and 3D reconstruction (right) of dendritic spines on Lucifer yellow–filled ARC GHRH-GFP neurons after vehicle (0x) or single (1x) or repeated (5x) i.p. 2DG administration. Scale bar: 5 μm. (B) Quantification of dendritic spines on filled ARC GHRH-GFP neurons after vehicle (0x) or single (1x) or repeated (5x) i.p. 2DG administration. *P = 0.03 1x vs. 5x, χ2[2] = 7.305, Kruskal-Wallis test with Dunn’s multiple-comparisons test, n = 5–11/group. (C) Confocal analysis (left) and 3D model (right) of SST terminals contacting ARC GHRH-GFP neurons. Scale bar: 30 μm. (D) Quantification of SST terminals contacting ARC GHRH-GFP neurons after vehicle (0x) or single (1x) or repeated (5x) i.p. 2DG administration. *P = 0.02 0x vs. 5x, F[2, 15] = 4.87, 1-way ANOVA with Tukey’s multiple-comparisons test, n = 4–7/group. (E) Confocal analyses of ARC IBA1-positive microglia after vehicle (0x) or single (1x) or repeated (5x) i.p. 2DG administration at low and high magnification. Scale bars: 100 μm for left 3 panels, 50 μm for right panel. (F) Quantification of IBA1 intensity by IHC in the ARC after vehicle (0x) or single (1x) or repeated (5x) i.p. 2DG administration. *P = 0.01 0x vs. 5x, **P = 0.0003 1x vs. 5x, F[2, 36] = 9.612, 1-way ANOVA with Tukey’s multiple-comparisons test, n = 7–20/group. (G) Cumulative intensity distribution of IBA1 intensity. **P = 0.028 0x vs. 5x, Kolmogorov-Smirnov test n = 7–20/group. (H) Quantification of IBA1-positive cells in the ARC after vehicle (0x) or single (1x) or repeated (5x) i.p. 2DG administration. **P = 0.003, ***P = 0.0004, F[2, 13] = 15.35, 1-way ANOVA with Tukey’s multiple-comparisons test, n = 5–6/group. Each dot represents results from individual animals and data are displayed as mean ± SEM.
Figure 5
Figure 5. Repeated glucose deprivation with insulin blunts GHRH neuron activation.
(A) Schema of experimental protocol for repeated glucose deprivation with i.p. administration of insulin in vivo. (B) Blood glucose levels (**P < 0.0036, ***P < 0.0002, χ2[2] = 18.23, Kruskal-Wallis ANOVA with Dunn’s multiple-comparisons test, n = 9–10/group). (C) Plasma glucagon levels (*P = 0.04, χ2[2] = 5.3, Kruskal-Wallis ANOVA with Dunn’s multiple-comparisons test, n = 7–12/group). (D) Quantification of fos-positive and GHRH-positive cells in the ARC after vehicle (0x) or single (1x) or repeated (5x) i.p. insulin administration, n = 5–14/group. (E) Quantification of dendritic spines on ARC GHRH-GFP neurons after vehicle (0x) or single (1x) or repeated (5x) i.p. insulin administration. *P = 0.04 1x vs. 0x; ****P < 0.0001 1x vs. 5x, χ2[2] = 25.26 Kruskal-Wallis test with Dunn’s multiple-comparisons test, n = 17–21/group. (F) Quantification of SST-immunoreactive terminals contacting ARC GHRH-GFP neurons after vehicle (0x) or single (1x) or repeated (5x) i.p. insulin administration, n = 3/group. (G) Analysis of plasma growth hormone after vehicle (0x) or single (1x) or repeated (5x) i.p. insulin administration. *P = 0.049, F[2, 26] = 2.41, 1-way ANOVA with Tukey’s multiple-comparisons test, n = 9–10/group.
Figure 6
Figure 6. N38 cells are glucose inhibited and responses are blunted by recurrent glucose deprivation.
(A) Schema of experimental protocol for repeated glucose deprivation of N38 cells in vitro by treatment with media containing 25 mM glucose (standard culture conditions) or 2.5 mM glucose (glucose deprivation). (B) Quantification of GHRH release from N38 cells after no (0x) or single (1x) or repeated glucose deprivation (3x and 5x; n = 3–4 experiments, in triplicate). *P = 0.04, F[3, 61] = 3.854, 1-way ANOVA with Tukey’s multiple-comparisons test. (C) Quantification of Ghrh expression in N38 cells after no (0x) or single (1x) or repeated glucose deprivation (3x and 5x) (n = 3–4 experiments, in triplicate). **P = 0.004, χ2[3] = 11.61, Kruskal-Wallis test with Dunn’s multiple-comparisons test. (D) Time-resolved calcium responses using calcium indicator Fluo-4 (F/F0, color scale) of 53 N38 cells without previous glucose deprivation (1 cell/row) with 25 mM, 5 mM, and 2.5 mM glucose treatment. (E) Quantification of peak fluorescence (F/F0) with 25 mM, 5 mM, and 2.5 mM glucose treatment in N38 cells without previous glucose deprivation (4 studies, 51–307 cells). ***P = 0.0004 25 mM vs. 5 mM; ###P = 0.0008 5 mM vs. 2.5 mM; ****P < 0.0001, 25 mM vs. 2.5 mM, χ2[2] = 56.2, Kruskal-Wallis test with Dunn’s multiple-comparisons test. (F) Quantification of peak fluorescence (F/F0) with no (0x) or single (1x) or repeated glucose deprivation (3x and 5x) in N38 cells (4 studies, 170–307 cells). ****P < 0.0001, χ2[3] = 188.2, Kruskal-Wallis test with Dunn’s multiple-comparisons test. Each dot represents data from individual cells and data are displayed as mean ± SEM.
Figure 7
Figure 7. Recurrent glucose deprivation leads to hyperpolarization and impaired depolarization with low glucose.
(A) Time-resolved voltage responses using voltage indicator Fluovolt (F/F0, color scale) of 69 N38 cells without previous glucose deprivation (1 cell per row) with 25 mM, 5 mM, and 2.5 mM glucose treatment. (B) Quantification of peak fluorescence (F/F0) with 25 mM, 5 mM, and 2.5 mM glucose treatment in N38 cells without previous glucose deprivation (4 studies, 135–144 cells/group). ****P < 0.0001, χ2[2] = 153.9, Kruskal-Wallis test with Dunn’s multiple-comparisons test. (C) Quantification of basal fluorescence at 25 mM glucose in N38 cells without (0x) and with (5x) previous glucose deprivation (4 studies, 80–105 cells). *P = 0.02, t = 2.371, degrees of freedom = 93.5, unpaired t test with Welch’s correction. (D) Quantification of peak fluorescence (F/F0) with 25 mM, 5 mM, and 2.5 mM glucose treatment in N38 cells without previous glucose deprivation (4 studies, 195 cells). *P = 0.03, ****P < 0.0001, significant effect of previous glucose deprivation, F[193, 386] = 1.915, P < 0.0001, 2-way ANOVA with Holm-Šidák multiple-comparisons test. Each dot represents data from individual cells and data are displayed as mean ± SEM.
Figure 8
Figure 8. Repeated glucose deprivation blunts the effects of low glucose on mitochondrial function.
Quantification in N38 cells after no (0x) or single (1x) or repeated glucose deprivation (3x and 5x). (A) Amplite ROS green whole-cell ROS indicator (n = 3–4 experiments, in triplicate). **P = 0.008 1x vs. 5x, F[3, 60] = 4.246, 1-way ANOVA with Tukey’s multiple-comparisons test. (B) MitoTracker Red CMXRos intensity (n = 3–4 experiments, in triplicate, 160–252 cells/group). ****P < 0.0001, χ2[3] = 83.5, Kruskal-Wallis test with Dunn’s multiple-comparisons test. (C) Oxygen consumption rate (OCR) (n = 3–4 experiments, in triplicate). FCCP, carbonyl cyanide 4-(trifluoromethoxy)-phenylhydrazone. (D) Extracellular acidification rate (ECAR) (n = 3–4 experiments, in triplicate). (E) Basal respiration rate (n = 3–4 experiments, in triplicate). *P = 0.02, χ2[3] = 8.665, Kruskal-Wallis test with Dunn’s multiple-comparisons test. (F) ATP production (n = 3–4 experiments, in triplicate). **P = 0.007, χ2[3] = 10.66 Kruskal-Wallis test with Dunn’s multiple-comparisons test. (G) Maximal respiration (n = 3–4 experiments, in triplicate). **P = 0.001, χ2[3] = 12.45, Kruskal-Wallis test with Dunn’s multiple-comparisons test. (H) Spare respiratory capacity (n = 3–4 experiments, in triplicate). *P = 0.04, χ2[3] = 9.015, Kruskal-Wallis test with Dunn’s multiple-comparisons test. Each dot represents data from individual well and data are displayed as mean ± SEM.
Figure 9
Figure 9. Repeated glucose deprivation blunts effects of low glucose on mitochondrial structure.
Confocal images and quantification after no (0x) or single (1x) or repeated glucose deprivation (3x and 5x). (A) HSP60 immunostaining of mitochondria in N38 cells. Scale bar: 10 μm. (B) p-DRP (Ser616) immunostaining of mitochondria in N38 cells. Scale bar: 10 μm. (C) Mitochondrial length in N38 cells (n = 4 experiments, 140–160 mitochondria/group). ****P < 0.0001, χ2[3] = 125.4, Kruskal-Wallis test with Dunn’s multiple-comparisons test. (D) Intensity of p-DRP (Ser616) in N38 cells (n = 4 experiments, 40–130 cells/group). *P = 0.03, ****P < 0.0001, χ2[3] = 58.7, Kruskal-Wallis test with Dunn’s multiple-comparisons test. (E) Intensity of p-DRP (Ser637) in N38 cells (n = 4 experiments, 63–81 cells/group). *P = 0.01 vs. 1x and vs. 3x, F[3, 280] = 3.875, 1-way ANOVA with Tukey’s multiple-comparisons test. Data are displayed as mean ± SEM.
Figure 10
Figure 10. Mdivi-1 preserves the response to low glucose after repeated glucose deprivation.
(A) Mitochondrial length in N38 cells after no (0x) or single (1x) or repeated glucose deprivation (3x and 5x; n = 3 experiments, 110–168 mitochondria/group) with and without mdivi-1 treatment. ****P < 0.0001, F[7, 1082] = 35.33, 1-way ANOVA with Tukey’s multiple-comparisons test. (B) Peak fluorescence (F/F0) with 25 mM, 5 mM, and 2.5 mM glucose treatment in N38 cells with and without previous glucose deprivation, with and without mdivi-1 treatment. ****P < 0.0001 5x with mdivi-1 vs. 5x at 2.5 mM glucose; **P = 0.003 5x with mdivi-1 vs. 5x at 5 mM glucose; *P = 0.01 5x vs. 0x at 2.5 mM glucose. Significant effect of mdivi-1 treatment P < 0.0001, F[3, 1482] = 9.187, 2-way ANOVA with Tukey’s multiple-comparisons test, n = 68–147 cells/group. (C) Blood glucose after vehicle (0x) or single (1x) or repeated (5x) i.p. 2DG administration or repeated 2DG administration with mdivi-1 treatment (5x MD). ***P = 0.0004, *P = 0.02, χ2[3] = 15.67, Kruskal-Wallis test with Dunn’s multiple-comparisons test, n = 7–11/group. (D) c-fos+Ghrh+ cells after vehicle (0x) or single (1x) or repeated (5x) i.p. 2DG administration or repeated 2DG administration with mdivi-1 treatment (5x MD). *P = 0.04 0x vs. 1x; #P = 0.01 0x vs. 5x MD, Welch’s F[3, 7.869] = 8.338, Welch’s ANOVA test with Dunnett’s multiple-comparisons test, n = 4–9/group. Each dot represents data from individual cells or animals and data are displayed as mean ± SEM.

Similar articles

Cited by

References

    1. Diabetes Control Complications Trial Research Group. et al. The effect of intensive treatment of diabetes on the development and progression of long-term complications in insulin-dependent diabetes mellitus. N Engl J Med. 1993;329(14):977–986. doi: 10.1056/NEJM199309303291401. - DOI - PubMed
    1. Khunti K, et al. Rates and predictors of hypoglycaemia in 27 585 people from 24 countries with insulin-treated type 1 and type 2 diabetes: the global HAT study. Diabetes Obes Metab. 2016;18(9):907–915. doi: 10.1111/dom.12689. - DOI - PMC - PubMed
    1. Leese GP, et al. Frequency of severe hypoglycemia requiring emergency treatment in type 1 and type 2 diabetes: a population-based study of health service resource use. Diabetes Care. 2003;26(4):1176–1180. doi: 10.2337/diacare.26.4.1176. - DOI - PubMed
    1. Tesfaye N, Seaquist ER. Neuroendocrine responses to hypoglycemia. Ann N Y Acad Sci. 2010;1212:12–28. doi: 10.1111/j.1749-6632.2010.05820.x. - DOI - PMC - PubMed
    1. Pedersen-Bjergaard U, et al. Severe hypoglycaemia in 1076 adult patients with type 1 diabetes: influence of risk markers and selection. Diabetes Metab Res Rev. 2004;20(6):479–486. doi: 10.1002/dmrr.482. - DOI - PubMed

Publication types