. 2020 Nov 5;5(21):e139032.
doi: 10.1172/jci.insight.139032.

Pathogenic, glycolytic PD-1+ B cells accumulate in the hypoxic RA joint

Affiliations

Pathogenic, glycolytic PD-1+ B cells accumulate in the hypoxic RA joint

Achilleas Floudas et al. JCI Insight. .

Abstract

While autoantibodies are used in the diagnosis of rheumatoid arthritis (RA), the function of B cells in the inflamed joint remains elusive. Extensive flow cytometric characterization and SPICE algorithm analyses of single-cell synovial tissue from patients with RA revealed the accumulation of switched and double-negative memory programmed death-1 receptor-expressing (PD-1-expressing) B cells at the site of inflammation. Accumulation of memory B cells was mediated by CXCR3, evident by the observed increase in CXCR3-expressing synovial B cells compared with the periphery, differential regulation by key synovial cytokines, and restricted B cell invasion demonstrated in response to CXCR3 blockade. Notably, under 3% O2 hypoxic conditions that mimic the joint microenvironment, RA B cells maintained marked expression of MMP-9, TNF, and IL-6, with PD-1+ B cells demonstrating higher expression of CXCR3, CD80, CD86, IL-1β, and GM-CSF than their PD-1- counterparts. Finally, following functional analysis and flow cell sorting of RA PD-1+ versus PD-1- B cells, we demonstrate, using RNA-Seq and emerging fluorescence lifetime imaging microscopy of cellular NAD, a significant shift in metabolism of RA PD-1+ B cells toward glycolysis, associated with an increased transcriptional signature of key cytokines and chemokines that are strongly implicated in RA pathogenesis. Our data support the targeting of pathogenic PD-1+ B cells in RA as a focused, novel therapeutic option.

Keywords: B cells; Cell Biology; Metabolism; Rheumatology; hypoxia.


Conflict of interest statement

Conflict of interest: NR, VK, and SN are current or former employees of Janssen Research & Development, Johnson & Johnson.

Figures

Figure 1
Figure 1. RA patient peripheral blood B cell subpopulation distribution.
(A) Representative flow cytometric analysis gating strategy for the identification of naive (IgD+CD27), non-switched memory (IgD+CD27+), switched memory (IgDCD27+), and double-negative memory (IgDCD27) B cells (over 20 independent experiments performed). DN, double-negative; L/D, LIVE/DEAD stain. (B) Frequency of the indicated B cell populations in the PBMCs of HC (n = 9–13) and RA patients (n = 18–30). Data are presented as mean ± SEM. Each symbol represents an individual sample. Statistical analysis was performed by using standard Student’s t test. *P < 0.05. (C) MFI values for the expression of CD40, CD86, CD80, and MHCII (HLA-DR) for HC and RA patient peripheral blood CD19+CD20+ B cells. Data are represented as a box-and-whisker plot, with bounds from 25th to 75th percentile, median line, and whiskers ranging from 5th to 95th percentile. Data are presented as mean ± SEM; each symbol represents an individual sample. Statistical analysis was performed by using 1-way ANOVA with Tukey’s multiple-comparisons test. *P < 0.05, **P < 0.01.
Figure 2
Figure 2. Synovial tissue accumulation of DN and switched memory B cells in RA.
(A) Representative plots of CD19+CD20+ B cells for the expression of IgD and CD27 in the peripheral blood, SF, and synovial tissue (at least 5 independent experiments performed). (B) Average subpopulation distribution of peripheral blood HC and RA patient B cells and RA patient SF and synovial tissue B cells. (C) Frequency of the indicated B cell populations in the periphery (n = 20), SF (n = 12), and synovial tissue (n = 6) of RA patients. Data are presented as mean ± SEM. Each symbol represents an individual sample. Statistical analysis was performed by using 1-way ANOVA with Tukey’s multiple-comparisons test. **P < 0.01, ***P < 0.001.
Figure 3
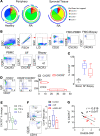
Figure 3. Involvement of CXCR3 in the migration of peripheral blood memory B cells to the synovial tissue.
(A) SPICE algorithm flow cytometric analysis of peripheral blood and synovial tissue RA patient B cell expression of the chemokine receptors CXCR3, CXCR5, CCR6, and CCR7. (B) Representative gating followed for the flow cytometric analysis and identification of CXCR3-expressing peripheral blood, SF, and synovial tissue B cells (at least 6 independent experiments were performed). FMO, fluorescence minus one. (C) Frequency of RA patient CXCR3-expressing B cells in the periphery (n = 12), SF (n = 7), and synovial tissue (n = 6). Data are presented as mean ± SEM. Statistical analysis was performed by using 1-way ANOVA with Tukey’s multiple-comparisons test. **P < 0.01, ***P < 0.001. (D) Representative flow cytometric analysis plots and frequency of RA patient switched memory and DN memory B cells within the CXCR3+ peripheral blood B cell compartment (n = 4). Data are presented as mean ± SEM. Ordinary 2-way ANOVA with Holm-Šidák multiple-comparisons test was performed. (E) Effect of CXCR3 expression change following incubation of isolated RA patient–derived peripheral blood B cells with the indicated cytokines (n = 6/group). (F) Representative flow cytometric analysis and CD19+/counting bead ratio for of invading B cells toward cRPMI (control), RA synovial biopsy-conditioned media (SP), or RA synovial biopsy-conditioned media following treatment of the B cells with the CXCR3 small molecule antagonist AMG487 (n = 7/group, 3 independent experiments); 1-way ANOVA with Tukey’s multiple-comparisons test; *P < 0.05. Data are represented as a box-and-whisker plot, with bounds from 25th to 75th percentile, median line, and whiskers ranging from 5th to 95th percentile. (G) Linear regression analysis between the frequency of RA patient peripheral blood CXCR3+ B cells and DAS28; n = 11; each symbol represents an individual sample. Spearman r correlation analysis was performed.
Figure 4
Figure 4. The effect of hypoxia on RA patient–derived B cells.
(A) Schematic representation of peripheral blood B cell isolation and stimulation in vitro under normoxic or hypoxic conditions. aCD40, anti-CD40. (B) ELISA for the assessment of IL-6 and TNF-α concentration in HC- or RA patient–derived B cell cultures following stimulation as indicated under normoxic or hypoxic conditions (n = 4–6/group). Ordinary 2-way ANOVA with Holm-Šidák multiple-comparisons test was performed. *P < 0.05, **P < 0.01, ***P < 0.001. (C) Representative flow cytometric analysis plots and frequency of IL-1β–expressing HC- or RA patient–derived B cells following in vitro stimulation under the designated conditions (n = 3/group, 2 independent experiments). Ordinary 2-way ANOVA with Holm-Šidák multiple-comparisons test was performed. **P < 0.01. (D) Fold expression change of RA patient–derived B cell MMP-9 expression compared with HC-derived B cells following stimulation under hypoxic conditions (n = 5/group). Statistical analysis was performed by using paired standard Student’s t test. *P < 0.05, ***P < 0.001. All data are represented as a box-and-whisker plot, with bounds from 25th to 75th percentile, median line, and whiskers ranging from 5th to 95th percentile.
Figure 5
Figure 5. Identification of synovial PD-1+ B cells in RA.
(A) Representative flow cytometric analysis and cumulative data for the identification of PD-1+ RA patient–derived B cells following in vitro stimulation under the indicated conditions (n = 3–6/group, 3 independent experiments). Data are represented as a box-and-whisker plot, with bounds from 25th to 75th percentile, median line, and whiskers ranging from 5th to 95th percentile. (B) Frequency of CXCR3 expression by PD-1 and PD-1+ RA patient–derived B cells under the indicated conditions. n = 5–7/group and n = 3 for aCD40. Data are represented as a box-and-whisker plot, with bounds from 25th to 75th percentile, median line, and whiskers ranging from 5th to 95th percentile. Ordinary 2-way ANOVA with Holm-Šidák multiple-comparisons test was performed. *P < 0.05, **P < 0.01. (C) Frequency of RA patient peripheral blood (PBMC), SF (SFMC), and synovial tissue (Bio) PD-1–expressing CD3+ T cells and CD19+ B cells. n = 3–7/group. Each symbol represents an individual sample. Data are presented as mean ± SEM. Ordinary 2-way ANOVA with Holm-Šidák multiple-comparisons test was performed. **P < 0.01, ***P < 0.001. (D) Representative flow cytometric analysis plots and frequency of CD80 and CD86 expression by RA patient–derived B cells following in vitro stimulation (aCD40+aBCR+CpG) under normoxic or hypoxic conditions (n = 8, 3 independent experiments). Each symbol represents an individual sample. Paired Student’s t test was performed. **P < 0.01, ***P < 0.001. (E) Frequency of IL-1β– and GM-CSF–expressing PD-1 and PD-1+ RA patient–derived B cells following stimulation under the indicated conditions (n = 6, 3 independent experiments). Data are represented as a box-and-whisker plot, with bounds from 25th to 75th percentile, median line, and whiskers ranging from 5th to 95th percentile. Statistical analysis was performed by using paired standard Student’s t test. *P < 0.05, **P < 0.01, ***P < 0.001.
Figure 6
Figure 6. PD-1+ RA patient B cells are dependent on glycolysis.
(A) Representative flow cytometric analysis histograms and cumulative MFI of RA patient peripheral blood–derived PD-1 and PD-1+ B cell expression of phosphorylated AKT, mTOR, and S6 following stimulation (aCD40+aBCR+CpG) under normoxic (21% O2) and hypoxic (3% O2) conditions (n = 6/group, 3 independent experiments). Data are represented as a box-and-whisker plot, with bounds from 25th to 75th percentile, median line, and whiskers ranging from 5th to 95th percentile. (B) Representative flow cytometric analysis plots and MFI of RA patient–derived PD-1 and PD-1+ B cell expression of GLUT1 and STAT3 phosphorylation (pSTAT3) following stimulation under the indicated conditions (n = 4/group, 2 independent experiments). Data are represented as a box-and-whisker plot, with bounds from 25th to 75th percentile, median line, and whiskers ranging from 5th to 95th percentile. (C) Representative flow cytometric analysis histograms of glucose analog 2-NBDG uptake by RA patient–derived PD-1 and PD-1+ B cells under the indicated conditions, (n = 5/group, 2 independent experiments). Data are represented as a box-and-whisker plot, with bounds from 25th to 75th percentile, median line, and whiskers ranging from 5th to 95th percentile. Ordinary 2-way ANOVA with Holm-Šidák multiple-comparisons test was performed. *P < 0.05, **P < 0.01. (D) Representative flow cytometric analysis plots of PD-1 expression by RA patient–derived B cells following stimulation in the presence of glucose analog 2DG (n = 4, 2 independent experiments). (E) Frequency of PD-1 B cells following incubation with STAT3 small molecule inhibitor Stattic (n = 3). Data are presented as mean ± SEM. Ordinary 2-way ANOVA with Holm-Šidák multiple-comparisons test was performed. **P < 0.01. (F) Effect of PD-1/PD-L1 engagement on PD-1+ RA patient–derived B cell expression of CD80 and CD86 and phosphorylation of AKT, mTOR, and S6 under normoxic or hypoxic conditions (n = 9). Data are represented as a box-and-whisker plot, with bounds from 25th to 75th percentile, median line, and whiskers ranging from 5th to 95th percentile. Statistical analysis was performed by using paired standard Student’s t test.
Figure 7
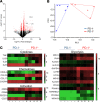
Figure 7. Differential gene expression of ex vivo RA patient PD-1+ and PD-1 B cells.
(A) Differential gene expression volcano plot of flow sorted, ex vivo RA patient–derived PD-1+ compared with PD-1 B cells. Red-colored genes show significant differential expression between the 2 groups. (B) PCA analysis of flow sorted, ex vivo RA patient PD-1+ and matched PD-1 B cells. Each point represents an independent sample. (C) Heatmap of RNA-Seq expression Z-scores for selected differentially regulated genes between PD-1+ and PD-1 B cells. Each column represents an individual sample.
Figure 8
Figure 8. FLIM analysis of PD-1 B cell metabolic profile.
(A) Representative multiphoton microscopy FLIM analysis of flow sorted RA patient–derived PD-1 and PD-1+ B cells (4 independent experiments were performed). (B) Average PD-1 and PD-1+ B cell emission lifetime (τavg) of NAD following excitation. n = 4/group. Data are presented as mean ± SEM. A reduction in τavg is reflected in an increase in free NAD and therefore increased glycolysis. Statistical analysis was performed by using paired standard Student’s t test. *P < 0.05.

Similar articles

Cited by

References

    1. Aletaha D, Blüml S. Therapeutic implications of autoantibodies in rheumatoid arthritis. RMD Open. 2016;2(1):e000009. doi: 10.1136/rmdopen-2014-000009. - DOI - PMC - PubMed
    1. Guo Y, et al. Immune checkpoint inhibitor PD-1 pathway is down-regulated in synovium at various stages of rheumatoid arthritis disease progression. PLoS One. 2018;13(2):e0192704. doi: 10.1371/journal.pone.0192704. - DOI - PMC - PubMed
    1. Johnson DB, Sullivan RJ, Menzies AM. Immune checkpoint inhibitors in challenging populations. Cancer. 2017;123(11):1904–1911. doi: 10.1002/cncr.30642. - DOI - PMC - PubMed
    1. Cohen MD, Keystone E. Rituximab for rheumatoid arthritis. Rheumatol Ther. 2015;2(2):99–111. doi: 10.1007/s40744-015-0016-9. - DOI - PMC - PubMed
    1. Mease PJ, et al. Efficacy and safety of retreatment in patients with rheumatoid arthritis with previous inadequate response to tumor necrosis factor inhibitors: results from the SUNRISE trial. J Rheumatol. 2010;37(5):917–927. doi: 10.3899/jrheum.090442. - DOI - PubMed

Publication types

MeSH terms