. 2020 Nov 5;5(21):e141183.
doi: 10.1172/jci.insight.141183.

Metformin delays neurological symptom onset in a mouse model of neuronal complex I deficiency

Affiliations

Metformin delays neurological symptom onset in a mouse model of neuronal complex I deficiency

Susana Peralta et al. JCI Insight. .

Abstract

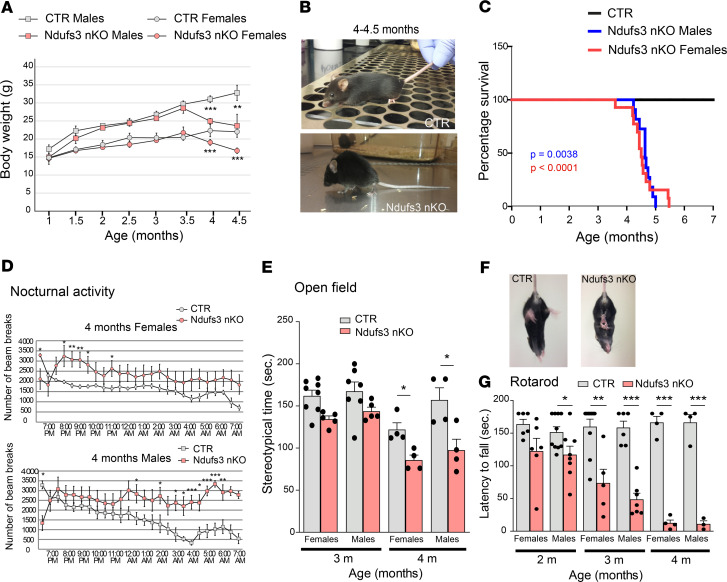
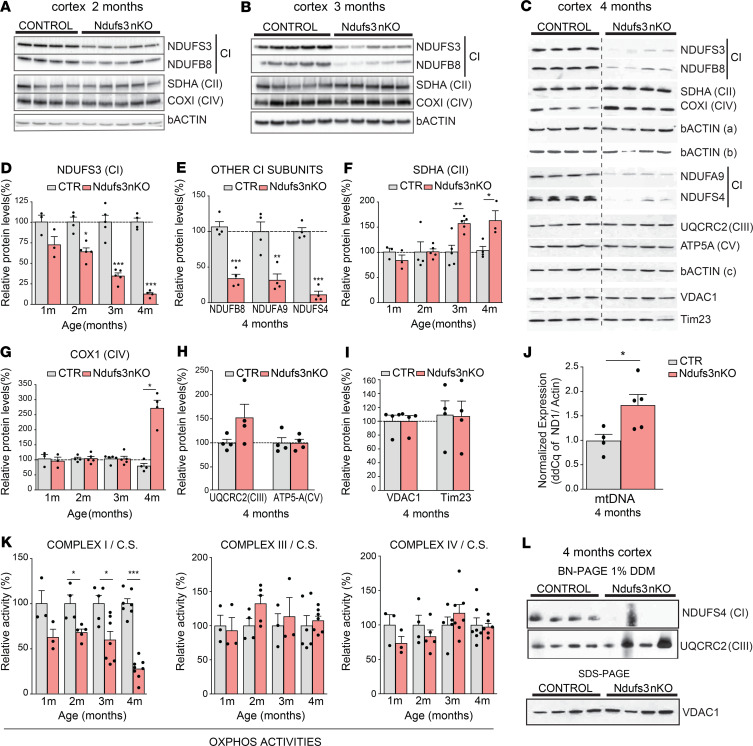
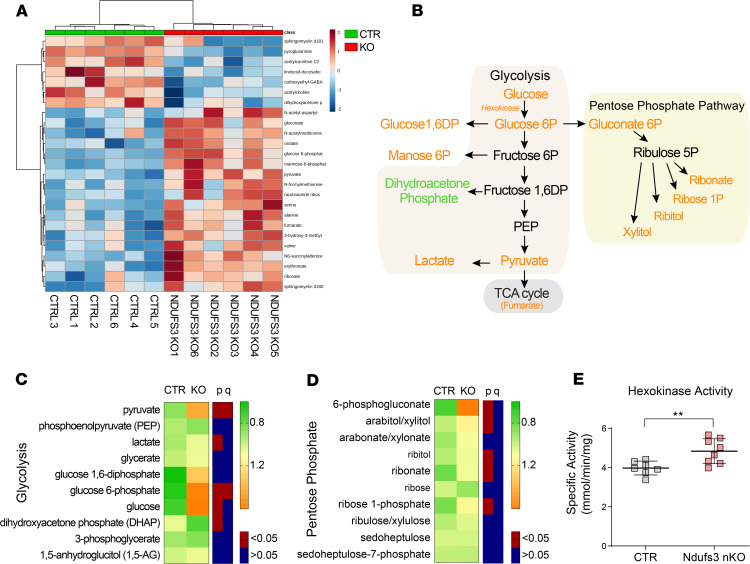
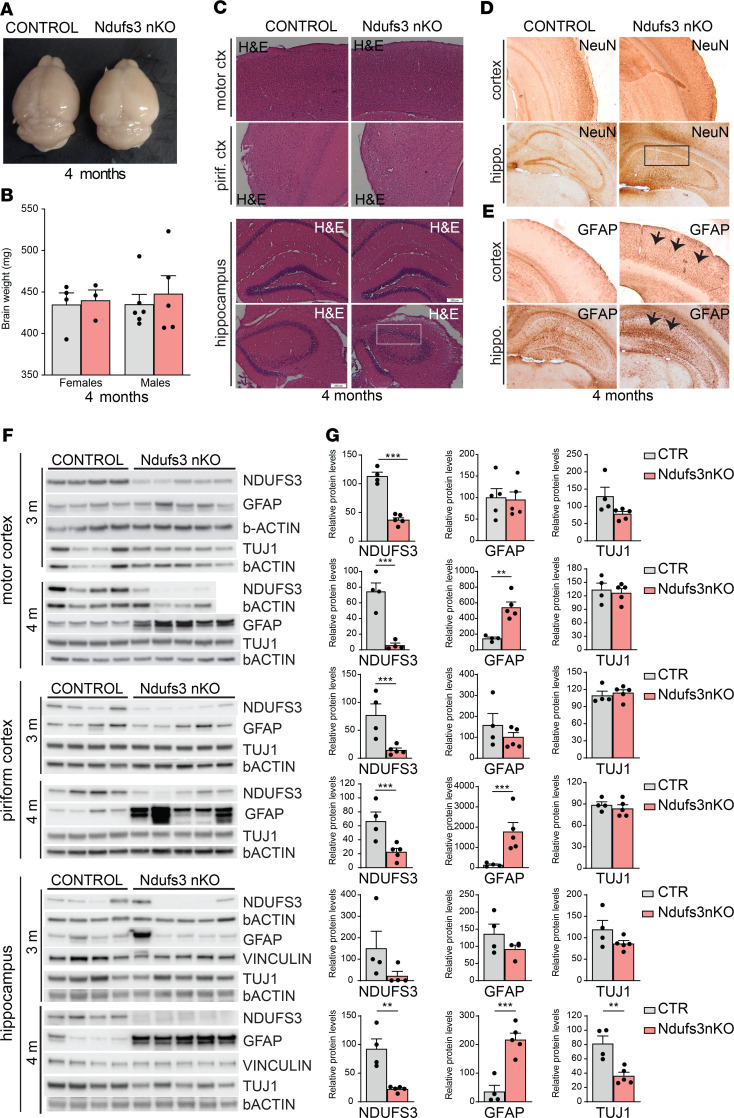
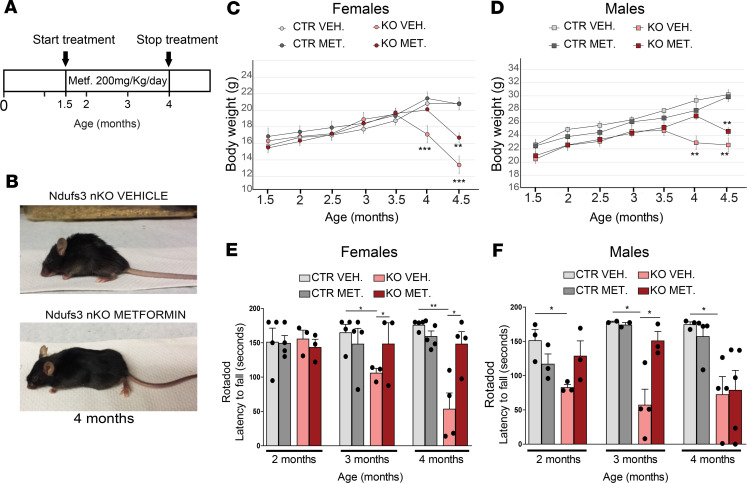
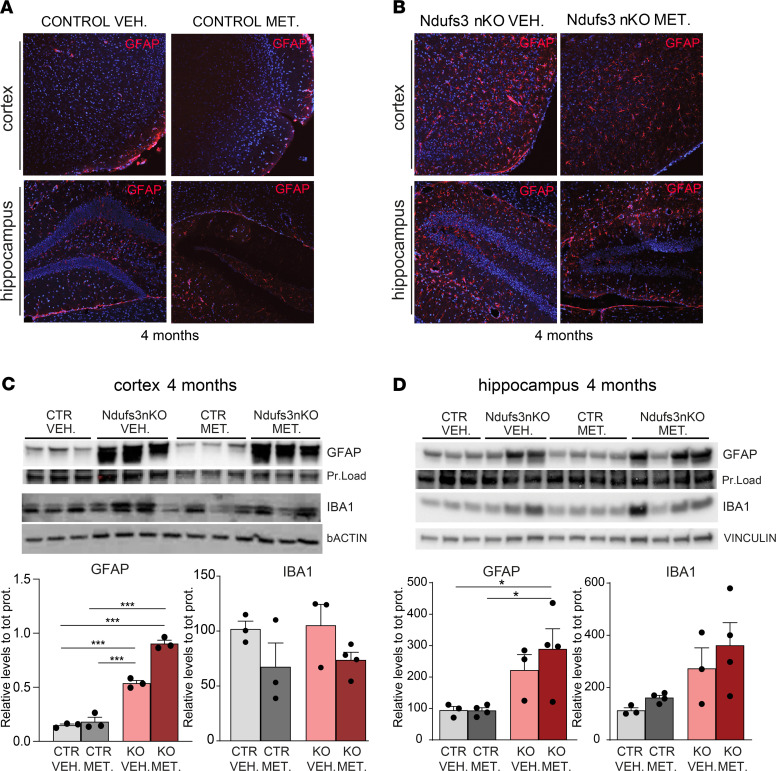
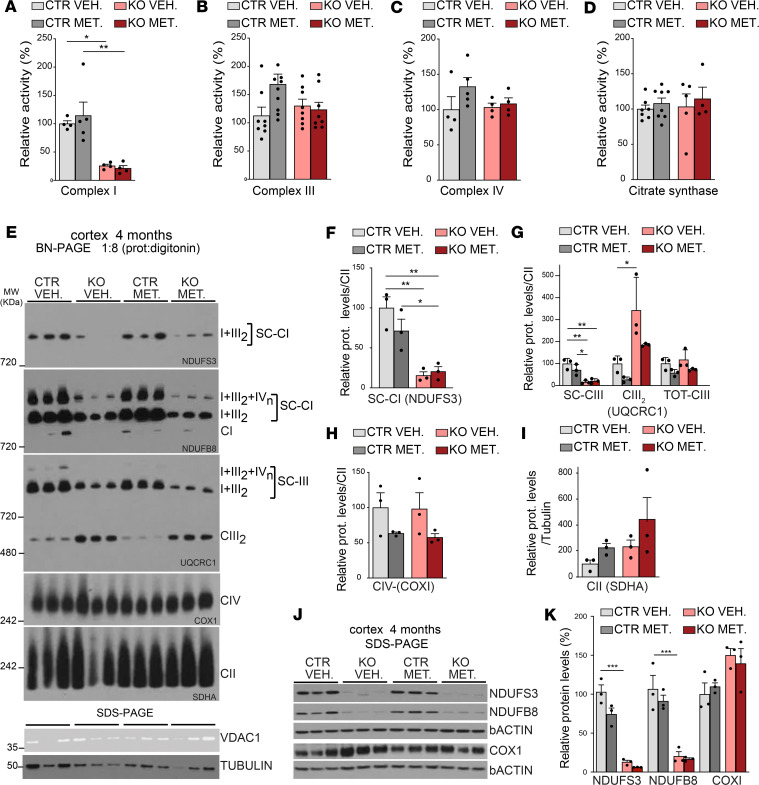
Complex I (also known as NADH-ubiquinone oxidoreductase) deficiency is the most frequent mitochondrial disorder present in childhood. NADH-ubiquinone oxidoreductase iron-sulfur protein 3 (NDUFS3) is a catalytic subunit of the mitochondrial complex I; NDUFS3 is conserved from bacteria and essential for complex I function. Mutations affecting complex I, including in the Ndufs3 gene, cause fatal neurodegenerative diseases, such as Leigh syndrome. No treatment is available for these conditions. We developed and performed a detailed molecular characterization of a neuron-specific Ndufs3 conditional KO mouse model. We showed that deletion of Ndufs3 in forebrain neurons reduced complex I activity, altered brain energy metabolism, and increased locomotor activity with impaired motor coordination, balance, and stereotyped behavior. Metabolomics analyses showed an increase of glycolysis intermediates, suggesting an adaptive response to the complex I defect. Administration of metformin to these mice delayed the onset of the neurological symptoms but not of neuronal loss. This improvement was likely related to enhancement of glucose uptake and utilization, which are known effects of metformin in the brain. Despite reports that metformin inhibits complex I activity, our findings did not show worsening a complex I defect nor increases in lactic acid, suggesting that metformin should be further evaluated for use in patients with mitochondrial encephalopathies.

Keywords: Genetics; Mitochondria; Mouse models.


Conflict of interest statement

Conflict of interest: The authors have declared that no conflict of interest exists.

Figures

Figure 1
Figure 1. Characterization of Ndufs3 nKO mice.
(A) Body weight comparison over time of Ndufs3 nKO male mice (pink squares; n = 6), age-matched control male mice (gray squares; n = 7), Ndufs3 nKO female mice (pink circles; n = 6), and age-matched control female mice (gray circles; n = 6). P values were calculated by Student’s t test. (B) Representative image of a 4- to 4.5-month-old Ndfus3 nKO mouse and a control (CTR) littermate, showing decreased body weight and kyphosis. (C) Survival curve of Ndufs3 nKO female mice (red line) and male mice (blue line). P values were calculated using log-rank (Mantel-Cox) test. P = 0.0038 for male mice (n = 15); P < 0.0001 for female mice (n = 14). Survival was reduced in the Ndufs3 nKO mice: all Ndfus3 nKO male mice died before 5 months of age, all Ndfus3 nKO female mice died before 6 months of age. (D) Nocturnal ambulatory activity of 4-month-old Ndufs3 nKO female mice (pink circles; n = 11), control female mice (gray circles n = 14), Ndufs3 nKO male mice (pink squares; n = 7), control male mice (gray squares; n = 6). P values were calculated by Student’s t test. (E) Stereotypical time of 3- and 4-month-old Ndufs3 nKO and control male and female mice (n = 4–8/group). (F) Representative image of a tail suspension test of 4-month-old Ndfus3 nKO and control littermate. Ndfus3 nKO mice clasped the 4 limbs, while control mice extended the legs in preparation for the contact. (G) Rotarod performed by Ndufs3 nKO and control mice at 2, 3, and 4 months of age (n = 4–10). Data are represented as mean ± SEM. P values were calculated by Student’s t test to determine the level of statistical difference. *P < 0.05, **P < 0.01, ***P < 0.0001.
Figure 2
Figure 2. NDUFS3 expression and complex I deficiency.
(AC) Western blots of cortex homogenates of control (CTR) and Ndufs3 nKO male mice at different ages (2, 3, and 4 months, respectively) using antibodies against NDUFS3, NDUFB8, NDUFA9, and NDUFS4 (complex I subunits); SDHA (complex II subunit); UQCRC2 (complex III subunit); COX1 (complex IV subunit); ATP5A (complex V subunit); and VDAC1, Tim23, and β-actin [β-actin (a) for NDUFS3, SDHA, and NDUFS4; β-actin (b) for NDUFB8 and COXI; β-actin (c) for NDUFA9 and ATP5A; and β-actin (d) for UQCRC2, VDAC1, and Tim23]. The dashed line in C indicates that the gel image was cropped to remove lanes not relevant to the analysis. (DI) Quantification of the Western blots in AC. Data are represented as mean ± SEM (n = 4–5/group). P values were determined by Student’s t test. (J) mtDNA levels measured by RT-PCR in DNA extracted from cortices of 4-month-old control and Ndufs3 nKO male mice (n = 4–5/group). (K) Spectrophotometric complex I/citrate synthase, complex III/citrate synthase, and complex IV/citrate synthase activity ratios were measured in cortex homogenates from 1-, 2-, 3-, and 4-month-old male mice. Complex I activity in Ndufs3 nKO animals was decreased in comparison with that in control mice. Data are represented as mean ± SEM (n = 3–8/group). P values were determined by Student’s t test. (L) Steady-state levels of complex I and III measured by BN-PAGE in homogenates from cortices of control and Ndufs3 nKO mice at 4 months of age using antibodies against NDUFS4 (complex I) and UQCRC2 (complex III) subunits and relative mitochondrial content (Western blot of the same homogenates using antibody against VDAC1). *P < 0.05, **P < 0.01, ***P < 0.001
Figure 3
Figure 3. Glycolysis and pentose phosphate pathway metabolites changed in Ndufs3-KO brains.
Cortices from 2.5-month-old Ndufs3 nKO male mice, compared with those from control littermates, were used for the analysis (n = 6/group). (A) Euclidean Heatmap of top 25 metabolite changes showing a clear clustering of KO and controls. (B) Schematics of glycolysis and pentose phosphate pathways, with increased metabolites in orange. (C) Heatmap of average KO and control values for glycolysis intermediates. Both P and q values are shown. (D) Heatmap of average KO and control values for pentose phosphate pathway intermediates. Both P and q values are shown. (E) Hexokinase enzyme activity in brain homogenates of 4-month-old male Ndufs3 nKO and control mice (n = 7–8/group). Groups were compared using Welch’s 2 sample t test, and q values were determined from the significant hits with P < 0.05. **P < 0.01.
Figure 4
Figure 4. Lack of NDUFS3 in neurons leads to general neuroinflammation and neuronal cell loss in hippocampus.
(A) Gross brain morphology of 4-month-old Ndufs3 nKO mice revealed no changes. (B) Brain weight of 4-month-old Ndufs3 nKO and control (CTR) female and male mice (n = 4–6). (C) H&E staining of cortical regions (first and second rows) of 4-month-old animals showing no apparent difference in morphology between control and Ndufs3 nKO mice. H&E staining of hippocampal regions (third and fourth rows) of Ndufs3 nKO mice showing less nuclei staining in the CA3 pyramidal layer (framed by a white rectangle). Original magnification, ×10. (D) Immunohistochemical images of NeuN staining on cortex (first row) and hippocampus (second row) of 4-month-old animals showing fewer neurons in hippocampi of Ndufs3 nKO mice in the CA1 pyramidal layer (framed by a black rectangle). Original magnification, ×10. (E) Immunohistochemical images of GFAP staining on different brain regions of 4-month-old animals showing increased inflammation in the cortex and hippocampus regions of Ndufs3 nKO mice (arrows). (F) Western blots and (G) relative quantification of protein homogenates from motor cortices, piriform cortices, and hippocampi of control and Ndufs3 nKO animals at 3 and 4 months of age, probing for neuronal marker TUJ1, astrocyte activation (GFAP), and NDUFS3. β-Actin and vinculin antibodies were used as loading controls. GFAP levels were increased in all regions of nKO mice at 4 months of age. TUJ1 levels were decreased at 4 months of age in hippocampi of nKO mice. Data are represented as mean ± SEM (n = 4–5/group). P values were determined by Student’s t test. **P < 0.01, ***P < 0.001
Figure 5
Figure 5. Metformin treatment delays the onset of the phenotype in Ndufs3 nKO mice.
(A) Schematic representation of the protocol used for metformin treatment. (B) Representative images of 4-month-old vehicle-treated Ndufs3 nKO female mice and metformin-treated Ndfus3 nKO female mice. (C) Body weight comparison over time of female mice: vehicle-treated Ndufs3 nKO (pink circles; n = 4); metformin-treated Ndufs3 nKO (red circles; n = 5), vehicle-treated controls (light gray circles, n = 6), and metformin-treated controls (dark gray circles, n = 3). (D) Body weight comparison over time of male mice: vehicle-treated Ndufs3 nKO (pink squares; n = 6), metformin-treated Ndufs3 nKO (red squares; n = 3), vehicle-treated controls (light gray squares, n = 7), and metformin-treated controls (dark gray squares, n = 5). (E and F) Rotarod performance of control and Ndufs3 nKO female mice (E) and male mice (F) of 2, 3, and 4 months of age (n = 3–5/group). Statistical significance was determined using 1-way ANOVA. Pairwise Bonferroni’s post tests were used to compare different groups in all panels. Data are presented as mean ± SEM. *P < 0.05, **P < 0.01, ***P < 0.001.
Figure 6
Figure 6. Metformin has no significant effect on GFAP activation in cortices from 4-month-old Ndufs3 nKO mice.
(A and B) Immunohistochemical images of GFAP on cortex and hippocampus regions of 4-month-old controls (A) and Ndufs3 nKO (B) animals treated with vehicle versus metformin. Images in B show increased inflammation in the cortex and hippocampus (red signal) of Ndufs3 nKO mice compared with control (CTR) mice. (C) Western blots and relative quantification of protein homogenates from motor cortices of control and Ndufs3 nKO mice at 4 months of age, probing for astrocytes (GFAP) and microglia (IBA1). Quantification was normalized for protein loading or β-actin. (D) Western blots and relative quantification of protein homogenates from hippocampi of control and Ndufs3 nKO mice at 4 months of age, probing for astrocytes (GFAP) and microglia (IBA1). Quantification was normalized for protein loading or vinculin. Data are represented as mean ± SEM (n = 3–4/group). P values were determined by ANOVA followed by Bonferroni’s post hoc comparison. *P < 0.05, ***P < 0.001.
Figure 7
Figure 7. Metformin treatment does not affect OXPHOS complex activities or OXPHOS steady-state levels in Ndufs3 nKO mice.
(AD) Spectrophotometric complex I/citrate synthase, complex III/citrate synthase, and complex IV/citrate synthase activity ratios and citrate synthase /protein activity ratios were measured in cortex homogenates from 4-month-old female mice. Data are represented as mean ± SEM (n = 4–9/group). P values were determined by 1-way ANOVA followed by Bonferroni’s post hoc comparison. (E) Steady-state levels of supercomplexes of complex I, III, and complexes IV and II measured by BN-PAGE in cortex homogenates from 4-month-old female mice using antibodies against NDUFS3 and NDUFB8 (complex I subunits), UQCRC1 (complex III), COX1 (complex IV), and SDHA (complex II) subunits. (FI) Quantification of the BN-PAGE showed in E (n = 3/group). (J and K) Western blot and quantification of protein homogenates from motor cortices of 4-month-old female mice treated with vehicle or metformin using antibodies NDUFS3 and NDUFB8 (complex I subunits), COX1 (complex IV subunit), and β-actin. Data are represented as mean ± SEM (n = 3/group). P values were determined by 1-way ANOVA followed by Bonferroni’s post hoc comparison. *P < 0.05, **P < 0.01, ***P < 0.001.

Similar articles

Cited by

References

    1. Wirth C, Brandt U, Hunte C, Zickermann V. Structure and function of mitochondrial complex I. Biochim Biophys Acta. 2016;1857(7):902–914. - PubMed
    1. Koopman WJ, et al. Mammalian mitochondrial complex I: biogenesis, regulation, and reactive oxygen species generation. Antioxid Redox Signal. 2010;12(12):1431–1470. - PubMed
    1. Mimaki M, Wang X, McKenzie M, Thorburn DR, Ryan MT. Understanding mitochondrial complex I assembly in health and disease. Biochim Biophys Acta. 2012;1817(6):851–862. doi: 10.1016/j.bbabio.2011.08.010. - DOI - PubMed
    1. Fassone E, Rahman S. Complex I deficiency: clinical features, biochemistry and molecular genetics. J Med Genet. 2012;49(9):578–590. doi: 10.1136/jmedgenet-2012-101159. - DOI - PubMed
    1. Antonicka H, et al. Identification and characterization of a common set of complex I assembly intermediates in mitochondria from patients with complex I deficiency. J Biol Chem. 2003;278(44):43081–43088. doi: 10.1074/jbc.M304998200. - DOI - PubMed

Publication types

MeSH terms

Supplementary concepts