. 2020 Nov 5;5(21):e140040.
doi: 10.1172/jci.insight.140040.

Transient enlargement of brain ventricles during relapsing-remitting multiple sclerosis and experimental autoimmune encephalomyelitis

Affiliations

Transient enlargement of brain ventricles during relapsing-remitting multiple sclerosis and experimental autoimmune encephalomyelitis

Jason M Millward et al. JCI Insight. .

Abstract

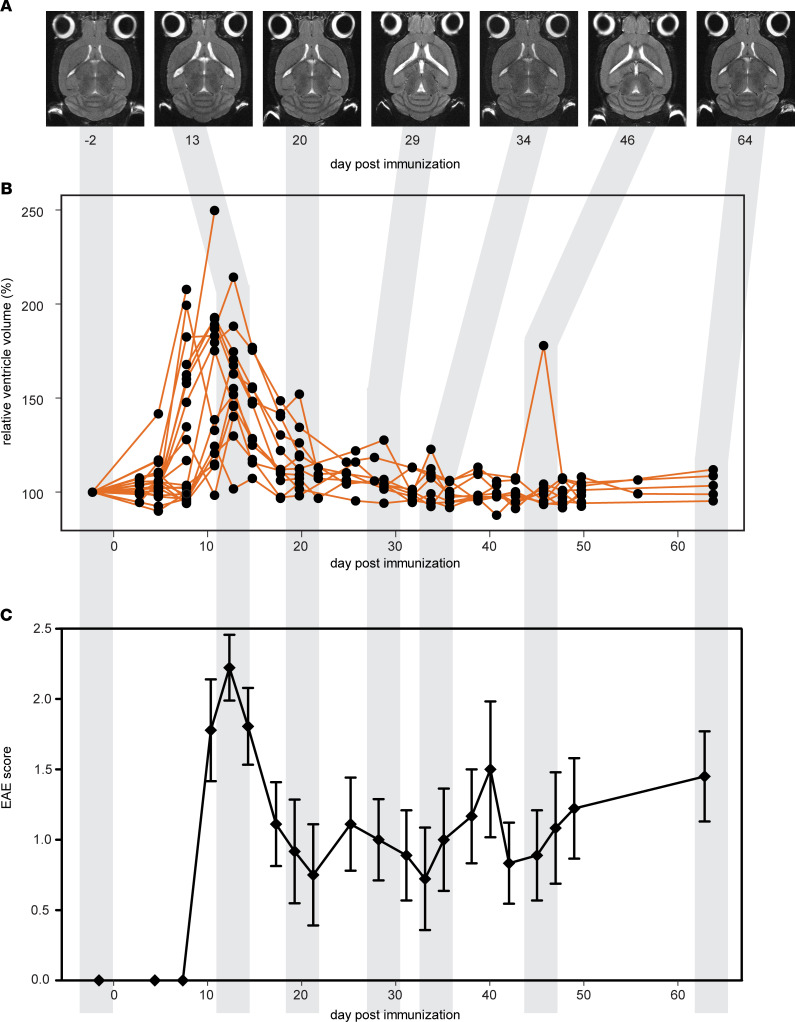
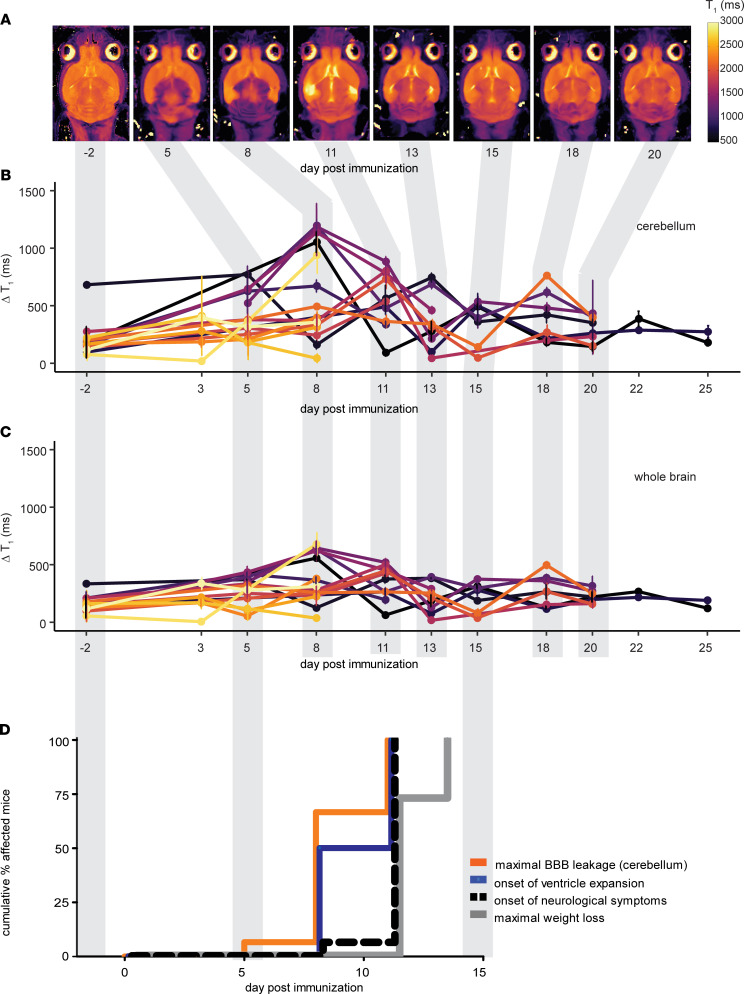
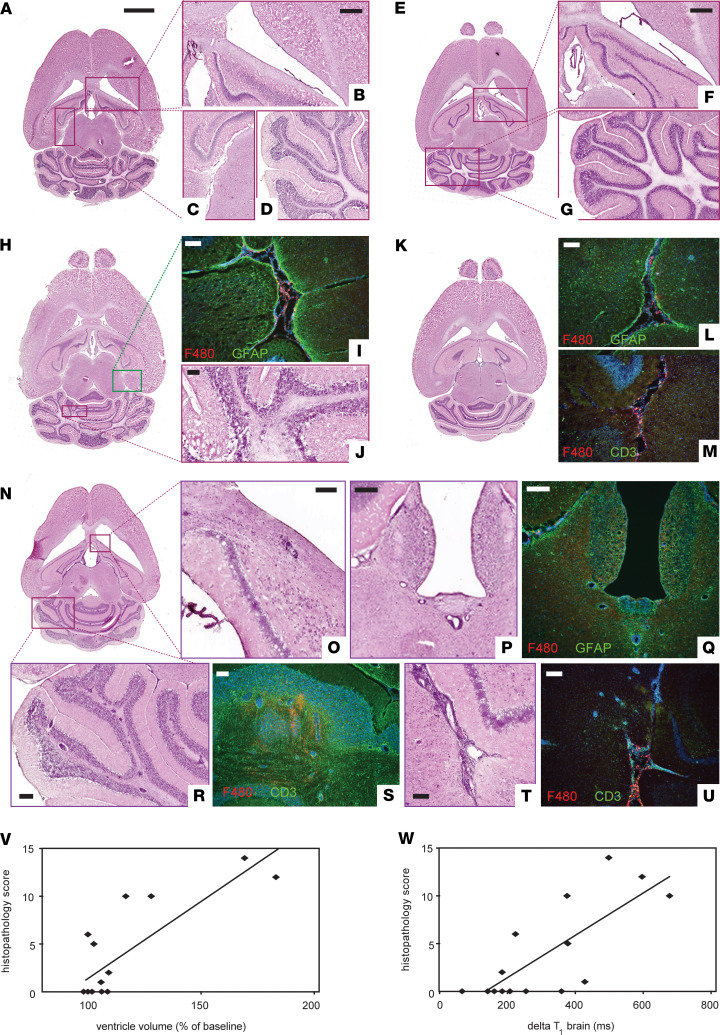
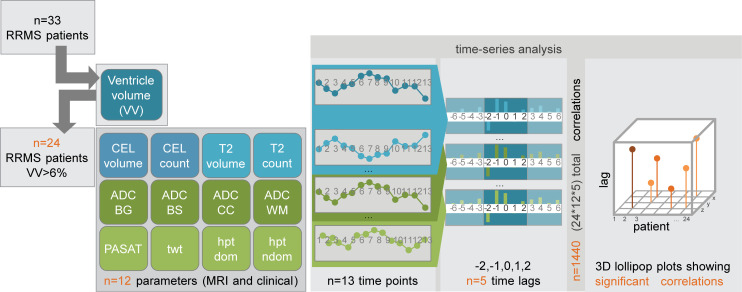
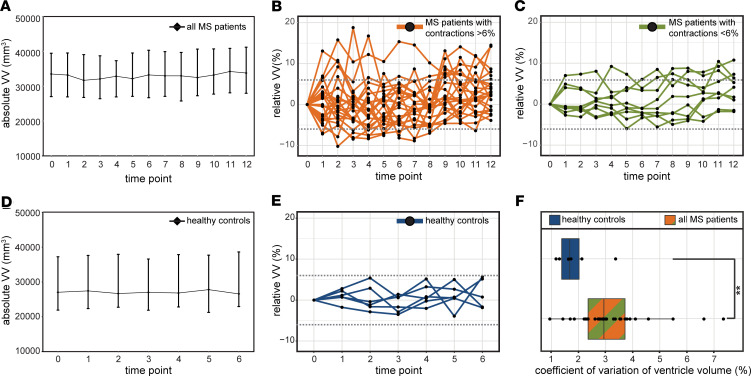
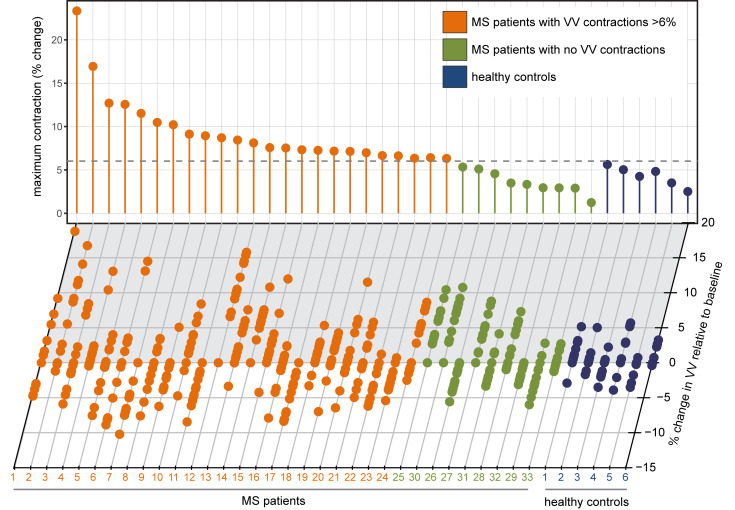
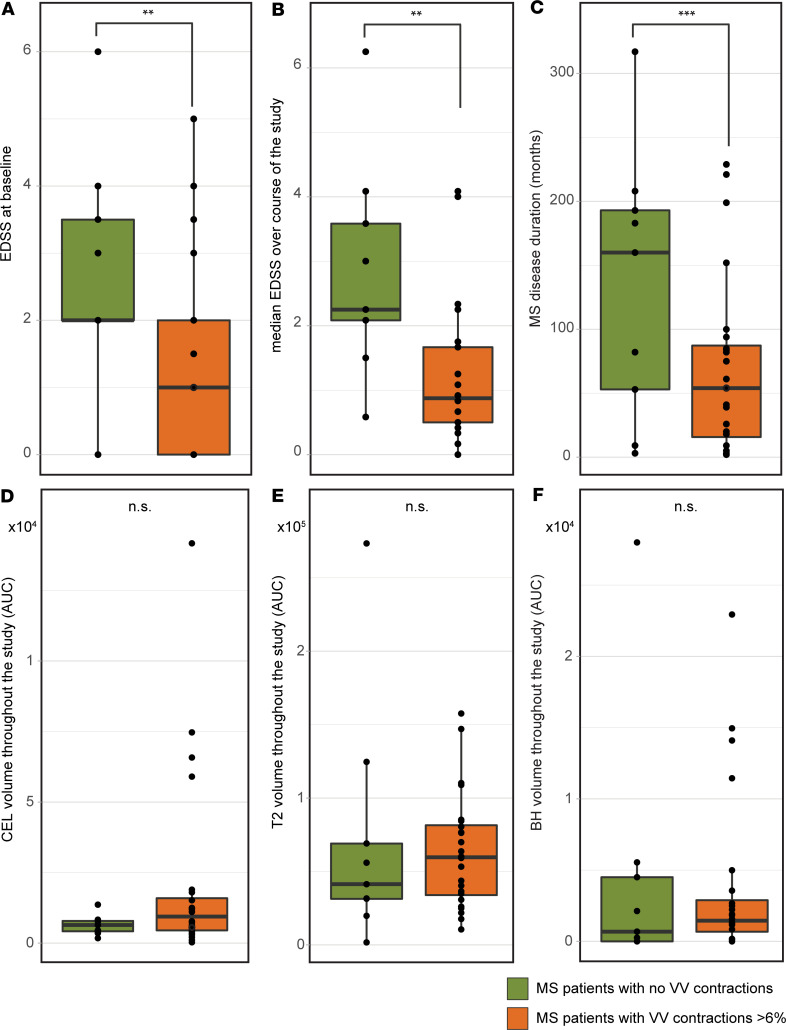
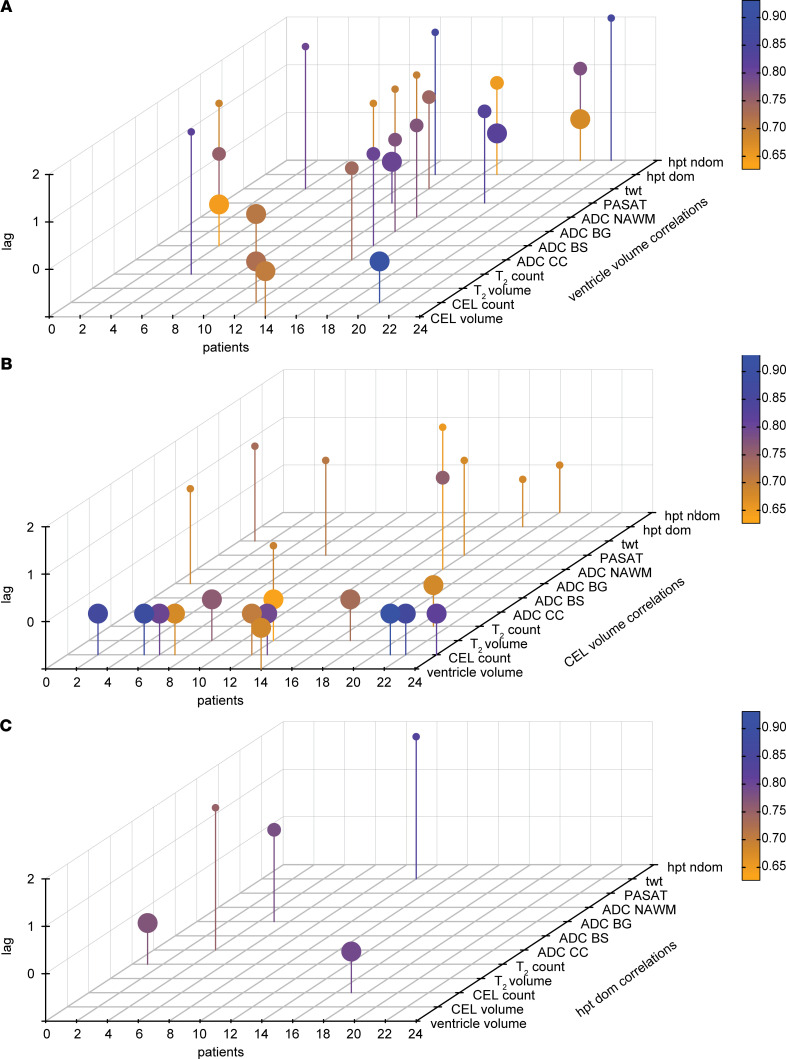
The brain ventricles are part of the fluid compartments bridging the CNS with the periphery. Using MRI, we previously observed a pronounced increase in ventricle volume (VV) in the experimental autoimmune encephalomyelitis (EAE) model of multiple sclerosis (MS). Here, we examined VV changes in EAE and MS patients in longitudinal studies with frequent serial MRI scans. EAE mice underwent serial MRI for up to 2 months, with gadolinium contrast as a proxy of inflammation, confirmed by histopathology. We performed a time-series analysis of clinical and MRI data from a prior clinical trial in which RRMS patients underwent monthly MRI scans over 1 year. VV increased dramatically during preonset EAE, resolving upon clinical remission. VV changes coincided with blood-brain barrier disruption and inflammation. VV was normal at the termination of the experiment, when mice were still symptomatic. The majority of relapsing-remitting MS (RRMS) patients showed dynamic VV fluctuations. Patients with contracting VV had lower disease severity and a shorter duration. These changes demonstrate that VV does not necessarily expand irreversibly in MS but, over short time scales, can expand and contract. Frequent monitoring of VV in patients will be essential to disentangle the disease-related processes driving short-term VV oscillations from persistent expansion resulting from atrophy.

Keywords: Autoimmunity; Inflammation; Mouse models; Multiple sclerosis; Neuroimaging.


Conflict of interest statement

Conflict of interest: The authors have declared that no conflict of interest exists.

Figures

Figure 1
Figure 1. Ventricle volume changes dynamically during the course of EAE.
(A) T2-weighted horizontal MRI scans of a representative mouse brain show changes in ventricle size from baseline (day –2) to day 64 p.i. (B) Brain ventricle volume plotted as a percentage of baseline values (n = 35). By day 8 p.i., the mean volume was 130.8% ± 7.74% (± SEM) of the baseline volume (P < 0.001, ANOVA), well beyond the range of normal variation in healthy SJL mice of ± 6%. Ventricle volume peaked at days 11–13 p.i. and returned to baseline levels by day 22 p.i. (C) Emergence and remission of EAE clinical signs coincided with the peak expansion and contraction of ventricle volume (mean ± SEM).
Figure 2
Figure 2. Ventricle enlargement coincides with gadolinium-enhancing lesions and precedes EAE clinical signs.
(A) T1 map MRIs of a representative mouse brain show altered tissue relaxation due to blood-brain barrier disruption following administration of gadolinium-based contrast agent. Reduced tissue T1 (purple) is apparent in the meninges, cerebellum, and periventricular regions already by day 5 p.i. Note that the brain images have been registered to the baseline image for quantification; therefore, changes in ventricle volume are not apparent in these images. (B) Quantification of global changes in tissue T1 following gadolinium contrast administration were especially prominent in the cerebellum (n = 16). The ΔT1 (precontrast – postcontrast values) was significantly increased from baseline at days 8–11 p.i. (P = 0.0030, ANOVA). (C) The ΔT1 of the whole-brain was also significantly increased at days 8–11 p.i. (P = 0.0023, ANOVA). (D) Kaplan-Meier plots show that the time of onset of ventricle expansion and the time of maximal gadolinium enhancement significantly preceded the onset of EAE clinical signs (P = 0.0068 and P = 0.0005, respectively; log-rank test) and the time of maximal body weight loss (P = 0.008, P < 0.0001, respectively).
Figure 3
Figure 3. Early ventricle enlargement in EAE correlates with inflammation.
(AG) Representative images of H&E-stained tissue sections show absence of pathology at baseline (AD) and day 3 p.i. (EG). Higher magnifications views show periventricular (B and F), meningeal (C), and cerebellar regions (D and G). (HJ) First signs of pathology were detected on day 5 p.i., as infiltration of macrophage/myeloid cells (F4/80+, red) and accompanying gliosis (GFAP, green) in meningeal areas (I) and inflammatory foci in cerebellar white matter (J). (KM) By day 8 p.i., pronounced meningeal infiltration and gliosis was present (L), along with T cell infiltration in the parenchyma (CD3+, green) (M). (N) At day 11 p.i., ventricular enlargement was grossly apparent from the whole brain tissue sections. (OU) Extensive inflammation was seen throughout the brain, including periventricular regions (O, P, Q), cerebellum (R, S), and meningeal areas (T, U), along with gliosis (Q) and infiltration of F4/80 and CD3 positive cells (Q, S, U). (V and W) Semiquantitative scoring of histopathology (n = 19) correlated positively with ventricle volume changes (V) and gadolinium enhancement as ΔT1 changes in whole brain (W) (Spearman’s r). Scale bars: A (whole brain images): 2 mm; BD, F, and G: 500 μm; PR: 200 μm; I and J, L and M, O, and SU: 100 μm.
Figure 4
Figure 4. Modest neurodegeneration detected by Fluoro-Jade staining during early EAE.
(A and C) No evidence of Fluoro-Jade+ staining was seen in brain tissue sections from unimmunized control mice; representative images of cerebellum (A) and brainstem (C). (B and D) Fluoro-Jade+ foci (indicated with arrows) were observed in cerebellum (B) and brainstem (D) of mice at day 11 p.i. (Fluoro-Jade, green; DAPI, blue). The Fluoro-Jade+ foci consistently accompanied inflammatory foci (B and D). (E) Quantification of fluorescence intensity of the tissue section showed an increasing accumulation of Fluoro-Jade staining by day 11 p.i. (arbitrary units) (n = 15).
Figure 5
Figure 5. Schematic for time-series analysis workflow.
From the cohort of n = 33 RRMS patients, we performed the time-series analysis on the subset of n = 24 patients who showed contractions in ventricle volume greater than the ± 6% range of normal variation. Ventricle volumes were measured at 13 monthly time points. At the same time points, an additional 8 MRI parameters and 4 clinical parameters were measured. This allowed each of these measures to be considered as a time series. Using the cross-correlation function, the cross-correlation coefficients between 2 time series can be calculated; significant coefficients indicate that events of one series precede (negative time lag) or follow (positive time lag) the events of another series. In the current study, we limited the consideration of significant cross-correlation coefficients to ± 2 time lags (i.e., ± 2 months). From n = 24 patients, n = 12 variables, and n = 5 time lags (including the 0 time lag), a total of 1440 coefficients was calculated. From the coefficients with nominal P < 0.05, the FDR correction for multiple comparisons was applied, to yield the corrected significant cross-correlation coefficients, which were then displayed in the 3D plots.
Figure 6
Figure 6. Relapsing-remitting MS patients show dynamic changes in ventricle volumes.
(A) Over the course of 1 year, the cohort of MS patients showed a small but significant increase in ventricle volume of +284 mm, equivalent to +0.08406% (median ± IQR, P = 0.0006, Wilcoxon signed rank test, n = 33). (B and C) Plotting the values for individual patients showed a heterogeneous picture, with some individuals showing high variability in ventricle volume (B) and others showing lower variability (C). (D) A reference cohort of healthy subjects showed no significant changes over the course of a 6-month observation period (n = 6). (E) The maximum change in ventricle volume of the healthy subjects was ± 6%. (F) The MS patient cohort showed significantly greater variability in ventricle volumes (as indicated by the coefficient of variation) compared with healthy controls (**P = 0.0065, Student’s t test).
Figure 7
Figure 7. MS patients show variable ventricle volume (VV) changes.
Individual MS patients showed considerable variability in the patterns of VV changes during the course of 13 monthly MRI examinations. Ventricle volumes from each patient and healthy subject are shown along the x axis; each dot represents 1 time point. Results are depicted as a percentage change from the baseline measurement. The vertical lollipop lines indicate the maximum contraction observed for each individual during the study period, in percentage change. The dotted line illustrates the maximum ventricle contraction observed in the healthy cohort: 6%. Based on this threshold, the cohort was divided into MS patients with contractions > 6% (orange) and MS patients without contractions (green). Healthy subjects are depicted in blue.
Figure 8
Figure 8. MS patients with contracting ventricles have lower disease severity and duration.
(A and B) MS patients who showed contractions (n = 24) in ventricle volumes greater than 6% had significantly lower disease severity at the study baseline, as indicated by the Expanded Disability Status Scale, EDSS) (**P = 0.0221, Mann-Whitney test) (A), and significantly lower median EDSS during the study period (**P = 0.0063, Mann-Whitney test) (B). (C) The patients with ventricle contractions also had significantly shorter total disease duration (***P = 0.046, Student’s t test). (DF) There were no significant differences between contracting and noncontracting patients (n = 9) in volume of CEL (D), T2 (E), or BH lesions (F) over the course of the study.
Figure 9
Figure 9. Time-series analysis of ventricle volume changes in MS.
(A) For each individual patient with ventricle volume contractions > 6% (n = 24), we calculated the cross-correlation function (CCF) between the time series of ventricle volume (as the X variable) and the time series of the other 8 MRI and 4 clinical measures (as the Y variables). The CCF yielded 25 significant cross-correlation coefficients, within a time lag of ± 2 months, after FDR correction for multiple comparisons. The significant coefficients are depicted as lollipops in the 3D plot; color is scaled to the magnitude of the coefficient. Individual patients are arranged on the x axis; the MRI and clinical parameters are arranged on the y axis. The absolute values of the time lags are shown on the z axis, and size of the lollipop is scaled to the time lag (lag 0, largest). (B) Using the time series of CEL volume as the X variable and the other MRI and clinical parameters (including ventricle volume) as the Y variables, the CCF analysis yielded 23 significant cross-correlation coefficients after correction for multiple comparisons. Of these, 9 of 23 were correlations between CEL volume and CEL count at 0 time lags. (C) Repeating the analysis using the time series of performance in the 9-hole peg test as the X variable yielded 5 significant cross correlation coefficients after correction for multiple comparisons.

Similar articles

Cited by

References

    1. Kivisäkk P, et al. Human cerebrospinal fluid central memory CD4+ T cells: evidence for trafficking through choroid plexus and meninges via P-selectin. Proc Natl Acad Sci USA. 2003;100(14):8389–8394. doi: 10.1073/pnas.1433000100. - DOI - PMC - PubMed
    1. Ghersi-Egea JF, Strazielle N, Catala M, Silva-Vargas V, Doetsch F, Engelhardt B. Molecular anatomy and functions of the choroidal blood-cerebrospinal fluid barrier in health and disease. Acta Neuropathol. 2018;135(3):337–361. doi: 10.1007/s00401-018-1807-1. - DOI - PubMed
    1. Filippi M, Preziosa P, Rocca MA. Multiple sclerosis. Handb Clin Neurol. 2016;135:399–423. doi: 10.1016/B978-0-444-53485-9.00020-9. - DOI - PubMed
    1. Rovira A, de Stefano N. MRI monitoring of spinal cord changes in patients with multiple sclerosis. Curr Opin Neurol. 2016;29(4):445–452. doi: 10.1097/WCO.0000000000000343. - DOI - PubMed
    1. Filippi M, et al. Assessment of lesions on magnetic resonance imaging in multiple sclerosis: practical guidelines. Brain. 2019;142(7):1858–1875. doi: 10.1093/brain/awz144. - DOI - PMC - PubMed

Publication types