. 2020 Nov 5;5(21):e134882.
doi: 10.1172/jci.insight.134882.

Elevated CCL2 causes Leydig cell malfunction in metabolic syndrome

Affiliations

Elevated CCL2 causes Leydig cell malfunction in metabolic syndrome

Qingkui Jiang et al. JCI Insight. .

Abstract

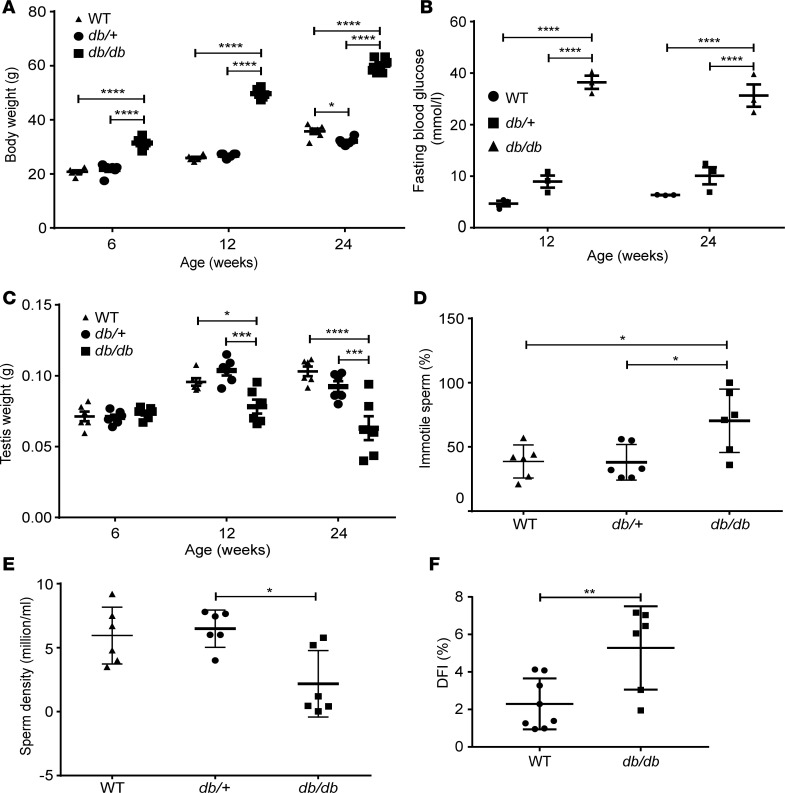
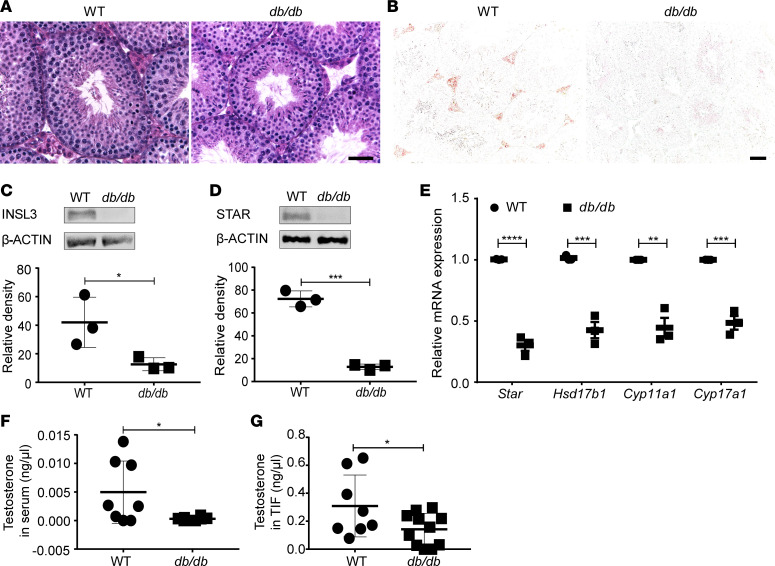
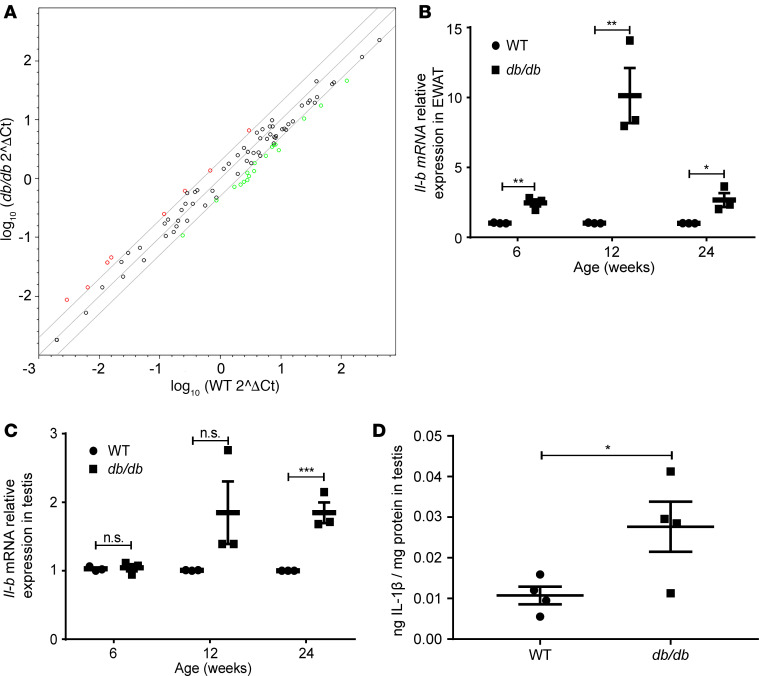
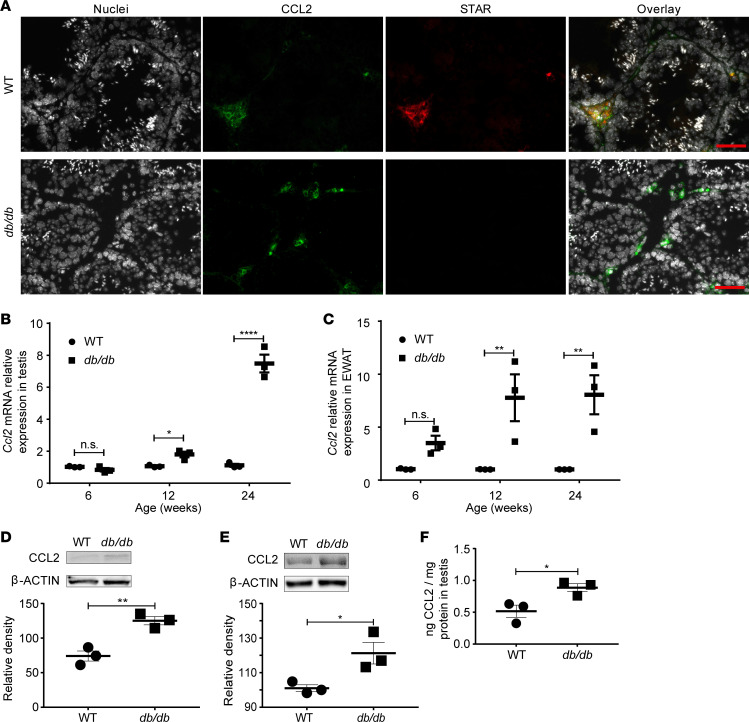
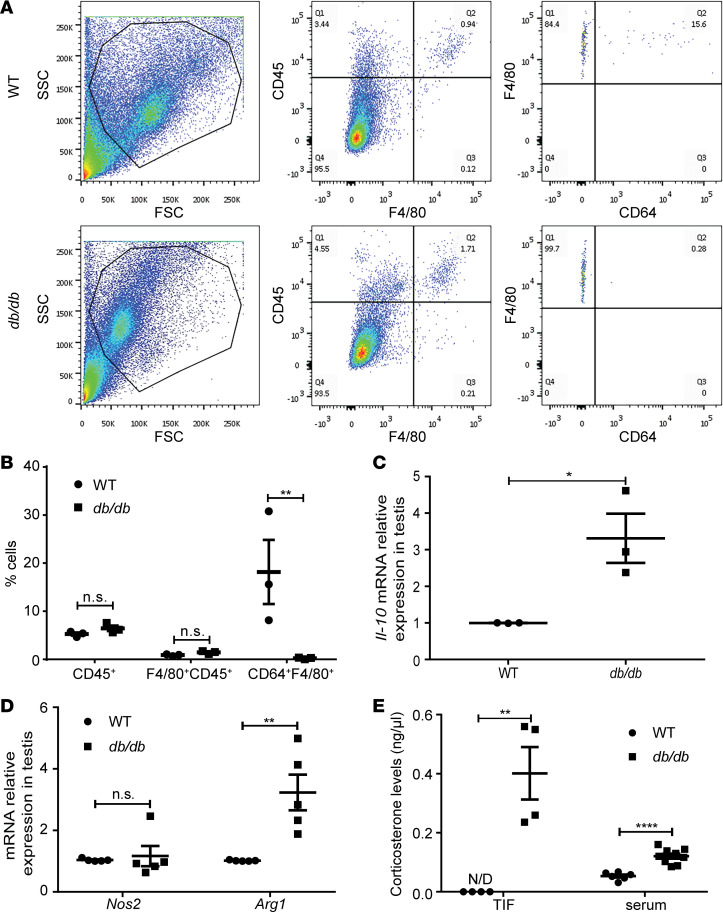
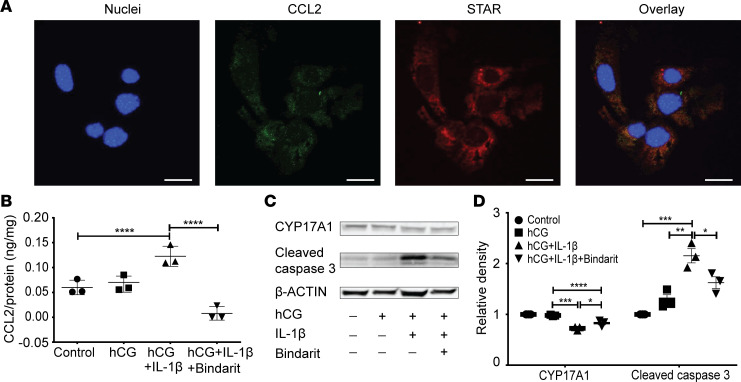
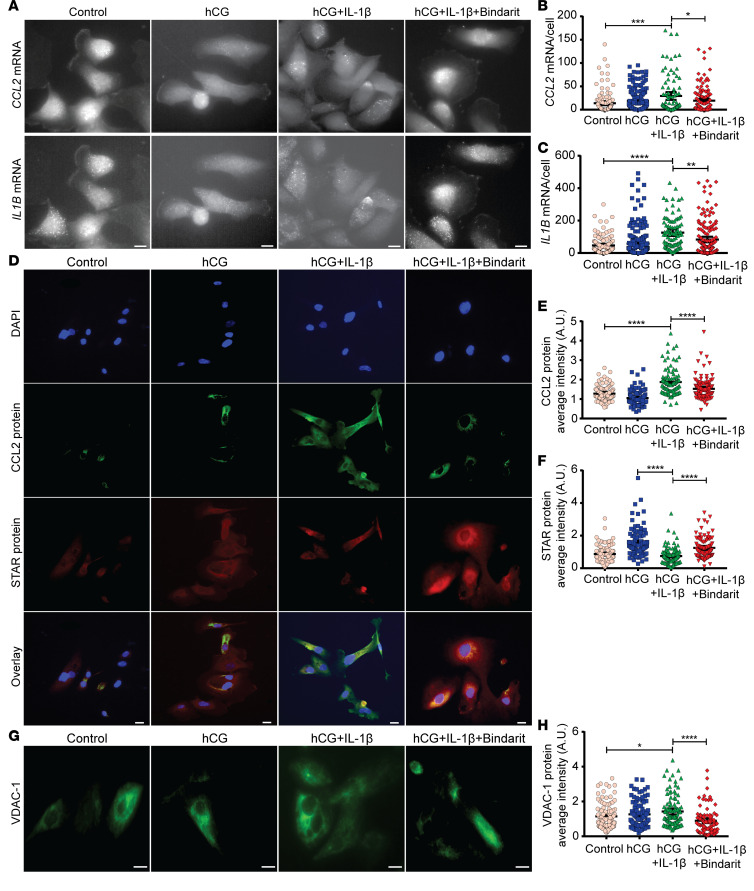
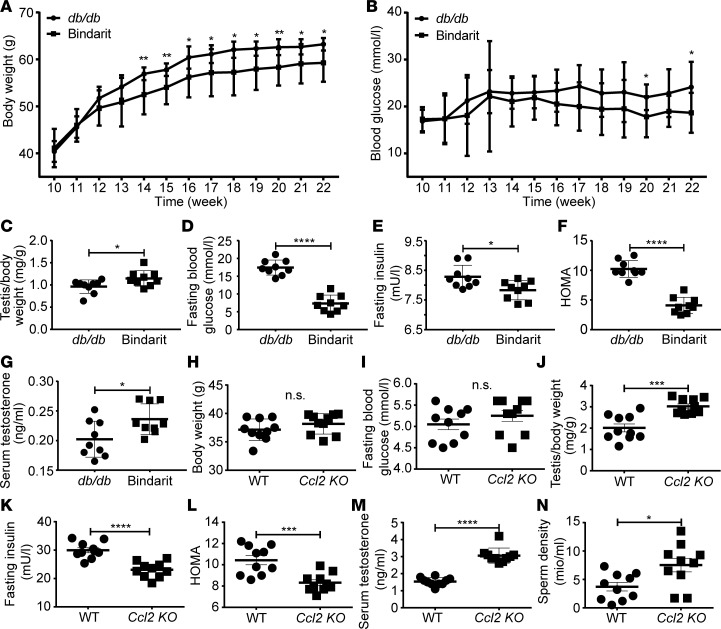
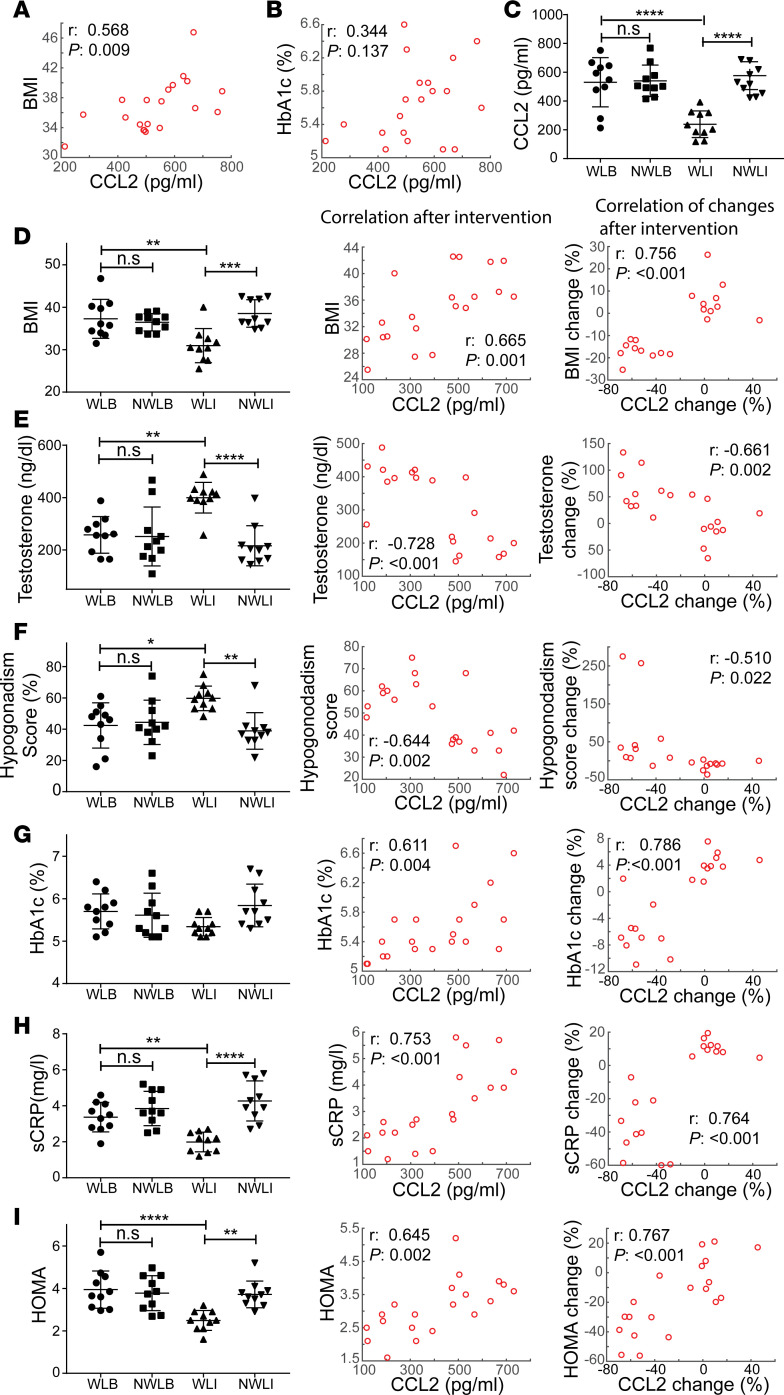
Metabolic syndrome (MetS), which is associated with chronic inflammation, predisposes males to hypogonadism and subfertility. The underlying mechanism of these pathologies remains poorly understood. Homozygous leptin-resistant obese db/db mice are characterized by small testes, low testicular testosterone, and a reduced number of Leydig cells. Here we report that IL-1β, CCL2 (also known as MCP-1), and corticosterone concentrations were increased in the testes of db/db mice relative to those in WT controls. Cultured murine and human Leydig cells responded to cytokine stress with increased CCL2 release and apoptotic signals. Chemical inhibition of CCL2 rescued Leydig cell function in vitro and in db/db mice. Consistently, we found that Ccl2-deficient mice fed with a high-energy diet were protected from testicular dysfunction compared with similarly fed WT mice. Finally, a cohort of infertile men with a history of MetS showed that reduction of CCL2 plasma levels could be achieved by weight loss and was clearly associated with recovery from hypogonadism. Taken together, we conclude that CCL2-mediated chronic inflammation is, to a large extent, responsible for the subfertility in MetS by causing damage to Leydig cells.

Keywords: Chemokines; Endocrinology; Fertility; Reproductive Biology; Urology.


Conflict of interest statement

Conflict of interest: The authors have declared that no conflict of interest exists.

Figures

Figure 1
Figure 1. Characteristics of phenotype and reproductivity of db/db mice.
(A) Body weight of WT, db/+, and db/db mice (n = 6) at 6, 12, and 24 weeks of age. (B) Blood glucose levels in WT, db/+, and db/db mice at 12 and 24 weeks of age (n = 6). (C) Testis weight of WT, db/+, and db/db mice at 6, 12, and 24 weeks of age; n = 3 in each group. (D and E) Sperm motility (D) and density (E) in 12- to 24-week-old mice; n = 6 in each group. (F) DNA fragmentation index (DFI) of epididymal sperm from age-matched 12- to 24-week-old db/db (n = 6) and WT (n = 7) mice. Data represent 1 of 3 independent experiments and are shown as means ± standard error of the mean (SEM). Student’s 2-tailed t test was used to compare means between 2 groups, and 1-way ANOVA was used to compare means between 3 groups followed by Tukey’s post hoc comparisons. *P < 0.05, **P < 0.01, ***P < 0.001, ****P < 0.0001.
Figure 2
Figure 2. db/db mice showed impaired expression of specific Leydig cell products.
(A and B) H&E (A) and insulin-like 3 (INSL3) (B) staining on representative testicular sections; scale bar: 20 μm. (C and D) Protein expression of INSL3 (C) and STAR (D), respectively, as analyzed by Western blot. (E) mRNA levels of steroidogenic genes in WT and db/db mice. (F and G) Mean testosterone levels in serum (F) and testicular interstitial fluid (TIF) (G). Data given in CG were from n = 3–8 mice, 12–24 weeks old, in each group. Data are shown as means ± SEM. Student’s 2-tailed t test was used to compare means between 2 groups. *P < 0.05, **P < 0.01, ***P < 0.001, ****P < 0.0001.
Figure 3
Figure 3. The expression of proinflammatory factors in testes of WT and db/db mice.
(A) Log transformation plot of the relative gene expression levels in testes of db/db compared with in testes of WT mice. Colored dots indicate 2-fold or greater changes in mRNA levels (red, reregulation; green, downregulation). Samples were pooled from 4 mice in each group. (B) The Ilb mRNA levels in epididymal white adipose tissue (EWAT). N = 3 in each group. (C) The Ilb mRNA levels in testes. N = 3 in each group. (D) IL-1β protein in testes. N = 4 in each group. Data represent 1 of 3 independent experiments and are shown as means ± SEM. Student’s 2-tailed t test was used to compare means between 2 groups. *P < 0.05, **P < 0.01, ***P < 0.001.
Figure 4
Figure 4. CCL2 expression was increased in db/db mice.
(A) Representative sections show colocalization of CCL2 in STAR-positive cells of WT controls. Scale bar: 20 μm. CCL2 is present in STAR-negative cells close to the basal membrane of the tubuli. (B) The Ccl2 mRNA levels in testes. N = 3 in each group. (C) The Ccl2 mRNA levels in EWAT. N = 3 in each group. (D) CCL2 protein in testes as determined by Western blot and followed by quantification. N = 3 in each group. (E) CCL2 protein expression in EWAT as determined by Western blot and followed by quantification. N = 3 in each group. (F) CCL2 protein concentration in testes as determined by ELISA. N = 3 in each group. Panels A, D, and E show representative images of 1 analysis per mouse. Data represent 1 of 3 independent experiments and are shown as means ± SEM. Student’s 2-tailed t test was used to compare means between 2 groups. *P < 0.05, **P < 0.01, ****P < 0.0001.
Figure 5
Figure 5. Testicular immune cells and corticosterone levels in db/db mice.
(A) Total testicular cells were isolated as described in Methods and examined by FACS. Representative flow cytometry gating schemes for testicular cells from WT and db/db mice are demonstrated. The gating strategy is shown for CD45+F4/80+ and F4/80+CD64+ cells. (B) Frequencies of testicular F4/80+ within CD45+ cells and CD64+ within F4/80+CD45+ cells from WT and db/db mice. (C) The Il-10 mRNA expression in testes. (D) The Nos2 and Arg1 mRNA expression in testes. (E) Corticosterone levels in TIF and serum. N= 3–8 mice, 12 to 24 weeks old, in each group. Data are shown as means ± SEM. Student’s 2-tailed t test was used to compare means between 2 groups. *P < 0.05, **P < 0.01, ****P < 0.0001.
Figure 6
Figure 6. CCL2 regulated function and apoptosis of MLTC-1 cells.
(A) Representative pictures showing MLTC-1 cells express CCL2 under basal cultivating conditions. (B) Amount of CCL2 in the culture medium. (C and D) Western blot analysis of CYP17A1 and cleaved caspase-3 in MLTC-1 cells after 48 hours’ treatment with human chorionic gonadotropin (hCG) in the absence or presence of IL-1β (1 ng/mL), with or without the CCL2 inhibitor Bindarit (100 μM). N = 3 in each group. Data represent one of 3 independent experiments and are shown as means ± SEM. One-way ANOVA was used to compare means between groups followed by Tukey’s post hoc comparisons. *P < 0.05, **P < 0.01, ****P < 0.0001.
Figure 7
Figure 7. CCL2 regulated function and apoptosis of primary human Leydig cells.
(AC) Representative pictures showing CCL2 and ILB mRNA expressions in HLC after 48 hours’ treatment with hCG in the absence or presence of IL-1β (1 ng/mL), with or without Bindarit (100 μM) (A), followed by quantification: number of CCL2 (B) and ILB (C) mRNA molecules per HLC. (DF) Representative pictures showing CCL2 and STAR protein expressions in HLC after 48 hours’ treatment with hCG in the absence or presence of IL-1β (1 ng/mL), with or without Bindarit (100 μM) (D), followed by quantification: average fluorescence intensity of CCL2 (E) and STAR (F) per HLC. (G and H) Representative pictures showing voltage-dependent anion-selective channel 1 (VDAC-1) protein expression in HLC after 48 hours’ treatment with hCG in the absence or presence of IL-1β (1 ng/mL), with or without Bindarit (100 μM) (G), followed by quantification, average fluorescence intensity of VDAC-1 per HLC (H). Data represent at least 3 independent experimental runs. Scale bar: 10 μm. N = ~100–180 cells in each group. Data represent 1 of 3 independent experiments and are shown as means ± SEM. One-way ANOVA was used to compare means between groups followed by Tukey’s post hoc comparisons. *P < 0.05, **P < 0.01, ***P < 0.001, ****P < 0.0001.
Figure 8
Figure 8. Pharmacological or genetic blockage of CCL2 ameliorated MetS and hypogonadism.
(AG) db/db mice were treated with vehicle or Bindarit (100 mg/kg/d) for 12 weeks. Weekly body weight (A), weekly random blood glucose levels (B), testis/body weight ratio at 12 weeks posttreatment (C), fasting blood glucose (D), fasting insulin (E), homeostatic model assessment (HOMA) index (F), and testosterone level in serum (G) were recorded and/or calculated 12 weeks post-treatment. (HN) WT and Ccl2-KO mice were fed with a high-energy diet (HED) for 12 weeks. Body weight (H), fasting blood glucose (I), testis/body weight ratio (J) fasting insulin (K), HOMA index (L), serum testosterone (M), and sperm density (N) were recorded and/or calculated 12 weeks posttreatment. N = 9–14 mice in each group. Data are shown as means ± SEM. Student’s 2-tailed t test was used to compare means between 2 groups. *P < 0.05, **P < 0.01, ***P < 0.001, ****P < 0.0001.
Figure 9
Figure 9. Clinical relevance of CCL2 in amelioration of MetS-related male hypogonadism.
(A and B) Correlation of plasma CCL2 with BMI (A) and hemoglobin A1c (HbA1c) (B) at basal level in all participants (n = 20). (C) CCL2 levels in the weight loss after intervention group (WLI) was compared with its basal level (WLB), the non–weight loss after intervention group (NWLI) and its basal level (NWLB), respectively. (DI) BMI (D), testosterone (E), hypogonadism score (F), HbA1c (G), sCRP (H), and HOMA (I) in different groups were compared at basal level and after intervention levels. Levels of each parameter after intervention were correlated to those of CCL2 (DI, middle panels). Similar correlations were performed between changes of each parameter and those of CCL2 (basal vs. after intervention levels) (DI, right panels). r, Pearson correlation coefficient. N = 10 patients in each group. Data are shown as means ± SEM. One-way ANOVA was used to compare means between 3 groups followed by Tukey’s post hoc comparisons. *P < 0.05, **P < 0.01, ***P < 0.001, ****P < 0.0001.

Similar articles

Cited by

References

    1. Agarwal A, Mulgund A, Hamada A, Chyatte MR. A unique view on male infertility around the globe. Reprod Biol Endocrinol. 2015;13:37. - PMC - PubMed
    1. Öztekin Ü, Caniklioğlu M, Sarı S, Selmi V, Gürel A, Işıkay L. Evaluation of male infertility prevalence with clinical outcomes in middle Anatolian region. Cureus. 2019;11(7):e5122. - PMC - PubMed
    1. Vermeulen A. Decreased androgen levels and obesity in men. Ann Med. 1996;28(1):13–15. doi: 10.3109/07853899608999068. - DOI - PubMed
    1. Kasturi SS, Tannir J, Brannigan RE. The metabolic syndrome and male infertility. J Androl. 2008;29(3):251–259. doi: 10.2164/jandrol.107.003731. - DOI - PubMed
    1. Tavares RS, Portela JMD, Sousa MI, Mota PC, Ramalho-Santos J, Amaral S. High glucose levels affect spermatogenesis: an in vitro approach. Reprod Fertil Dev. 2017;29(7):1369–1378. doi: 10.1071/RD15475. - DOI - PubMed

Publication types