. 2020 Nov 4;11(1):5590.
doi: 10.1038/s41467-020-18967-8.

Polyandry blocks gene drive in a wild house mouse population

Affiliations

Polyandry blocks gene drive in a wild house mouse population

Andri Manser et al. Nat Commun. .

Abstract

Gene drives are genetic elements that manipulate Mendelian inheritance ratios in their favour. Understanding the forces that explain drive frequency in natural populations is a long-standing focus of evolutionary research. Recently, the possibility to create artificial drive constructs to modify pest populations has exacerbated our need to understand how drive spreads in natural populations. Here, we study the impact of polyandry on a well-known gene drive, called t haplotype, in an intensively monitored population of wild house mice. First, we show that house mice are highly polyandrous: 47% of 682 litters were sired by more than one male. Second, we find that drive-carrying males are particularly compromised in sperm competition, resulting in reduced reproductive success. As a result, drive frequency decreased during the 4.5 year observation period. Overall, we provide the first direct evidence that the spread of a gene drive is hampered by reproductive behaviour in a natural population.


Conflict of interest statement

The authors declare no competing interests.

Figures

Fig. 1
Fig. 1. The frequency of polyandry in the study population.
a Black line and squares depict the frequency of genetic polyandry among the 682 litters (proportion of litters with >1 father, mean ± binomial standard error) during the observation period. Absolute numbers of monogamous litters (sired by one male only) and polyandrous litters are shown in blue and violet to red gradient colours (representing two, three, and four sires), respectively. b Positive relationship between the frequency of polyandry and adult population density as predicted by the generalized animal model (red line). The raw data were grouped in quarter-year time intervals, indicating mean (squares) and binomial standard errors (vertical lines) in genetic polyandry rates, as well as mean (squares) and standard errors (horizontal lines) in adult population size. Source data are provided as a Source data file.
Fig. 2
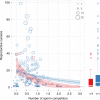
Fig. 2. Sperm competition damages the fitness of t haplotype males.
The figure shows the reproductive success of 249 males as a function of sperm competition intensity (measured as the number of sperm competitors a male encountered during his lifetime) and t genotype (red for +/t and blue +/+ males). Dot size is proportional to the number of litters in which a male sired at least one offspring. Red/dotted and blue/solid lines with shaded areas show mean GLM model predictions and 95% confidence bands for +/t and +/+ males, respectively (based on a hypothetical male that reproduced 10 times). Reproductive success was lower in males that were exposed to elevated levels of sperm competition, but the effect is particularly strong in drive carrying males. Low drive male fitness under sperm competition translated into a lower reproductive output of +/t males overall, as illustrated by boxplots on the right (showing median (line), 0.25 and 0.75 quartiles (box) ± 1.58 times the inter-quartile range (whiskers)). Source data are provided as a Source data file.
Fig. 3
Fig. 3. The impact of polyandry on drive frequency dynamics.
Observed t frequencies in the study population were lower than expected by monandry, but are in line with polyandry model predictions. a The frequency of +/t heterozygotes among 3126 offspring over the 4.5 year observation period in relative (black squares and lines for mean and binomial standard error, respectively) and absolute numbers (blue/red shaded areas). The grey dotted line shows the expected 66% +/t genotypes expected under monandry. The violet dashed line denotes the 0% prediction based on observed levels of polyandry and +/t male sperm competitive disadvantage. The polyandry model correctly predicts the observed frequency trend. b Predicted and observed +/t genotype frequency as a function of +/t male sperm competitiveness and polyandry rate (for drive strength d = 0.9) based on the polyandry model (Supplementary Note 3). The dotted line denotes the monandry prediction of 66% (where +/t males have no sperm competition disadvantage). The red curve corresponds to the average observed drive genotype frequency during the observation period (11.8%). The square with horizontal and vertical lines shows the empirically measured mean and 95% confidence intervals for both parameters (Supplementary Note 4, polyandry rate: 682 litters, sperm competitiveness: 57 mating trials). Again, observed genotype frequencies agree with the (parameterised) polyandry model, but do not align with the monandry prediction. Source data of observed +/t genotype frequency are provided as a Source data file.

References

    1. Burt, A. & Trivers, R. Genes in Conflict: The Biology of Selfish Genetic Elements (Belknap Press, Cambridge, 2006).
    1. Lindholm AK, et al. The ecology and evolutionary dynamics of meiotic drive. Trends Ecol. Evolution. 2016;31:316–326. - PubMed
    1. Champer J, Kim IK, Champer SE, Clark AG, Messer PW. Performance analysis of novel toxin-antidote CRISPR gene drive systems. BMC Biol. 2020;18:1–17. - PMC - PubMed
    1. Godwin J, et al. Rodent gene drives for conservation: opportunities and data needs. Proc. R. Soc. B. 2019;286:20191606. - PMC - PubMed
    1. Champer J, Buchman A, Akbari OS. Cheating evolution: engineering gene drives to manipulate the fate of wild populations. Nat. Rev. Genet. 2016;17:146. - PubMed

Publication types