. 2020 Nov 4;11(1):5566.
doi: 10.1038/s41467-020-19412-6.

Type I IFN exacerbates disease in tuberculosis-susceptible mice by inducing neutrophil-mediated lung inflammation and NETosis

Affiliations

Type I IFN exacerbates disease in tuberculosis-susceptible mice by inducing neutrophil-mediated lung inflammation and NETosis

Lúcia Moreira-Teixeira et al. Nat Commun. .

Abstract

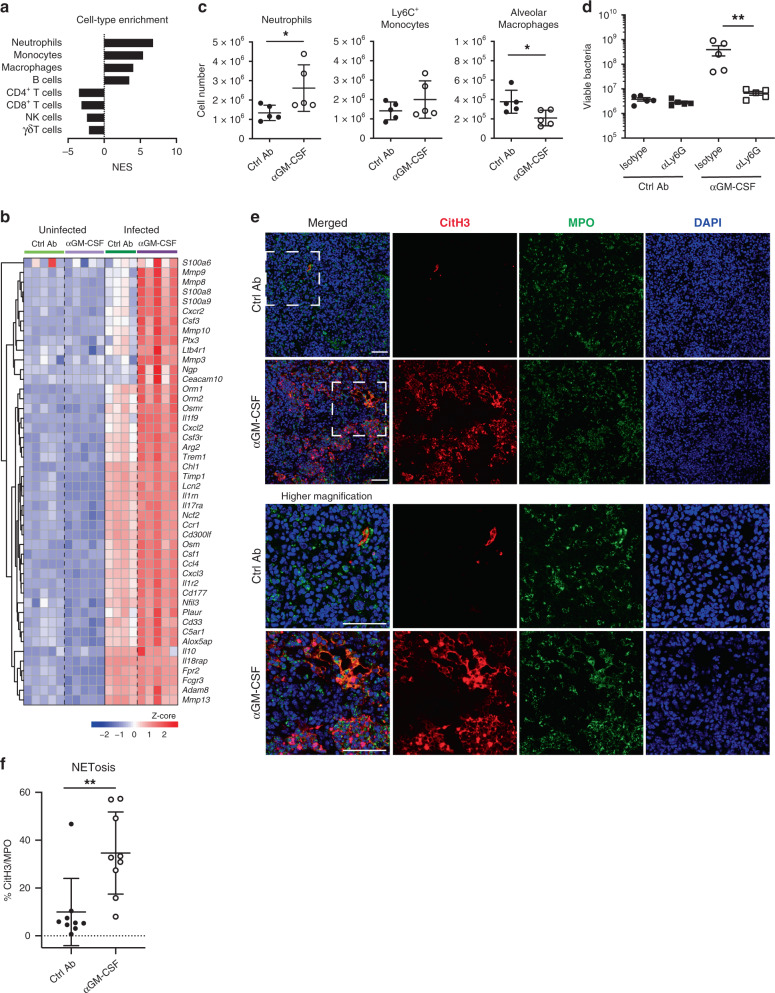
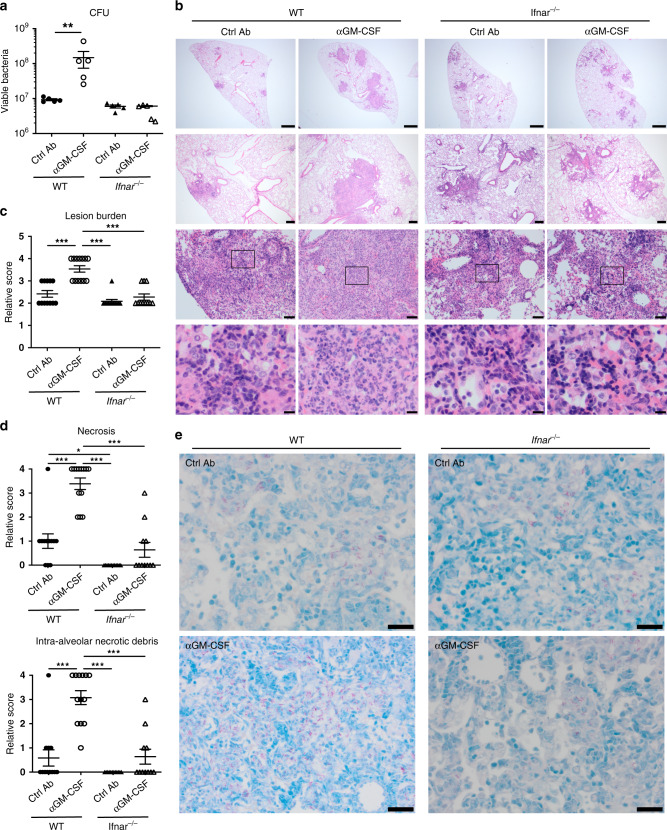
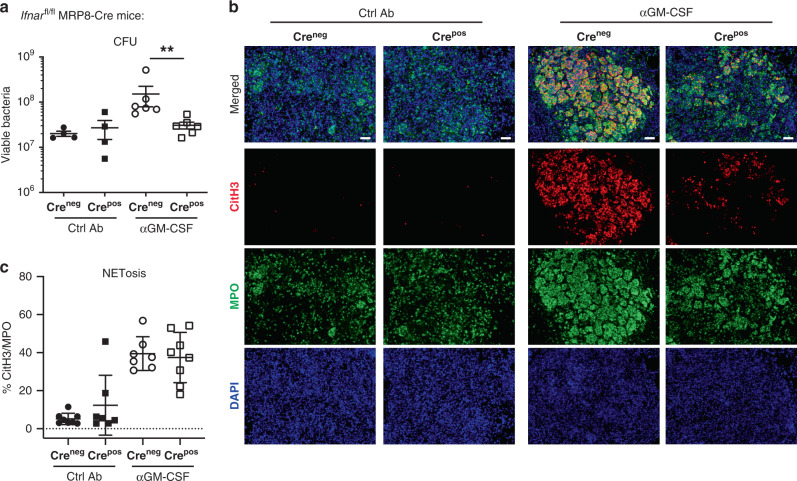
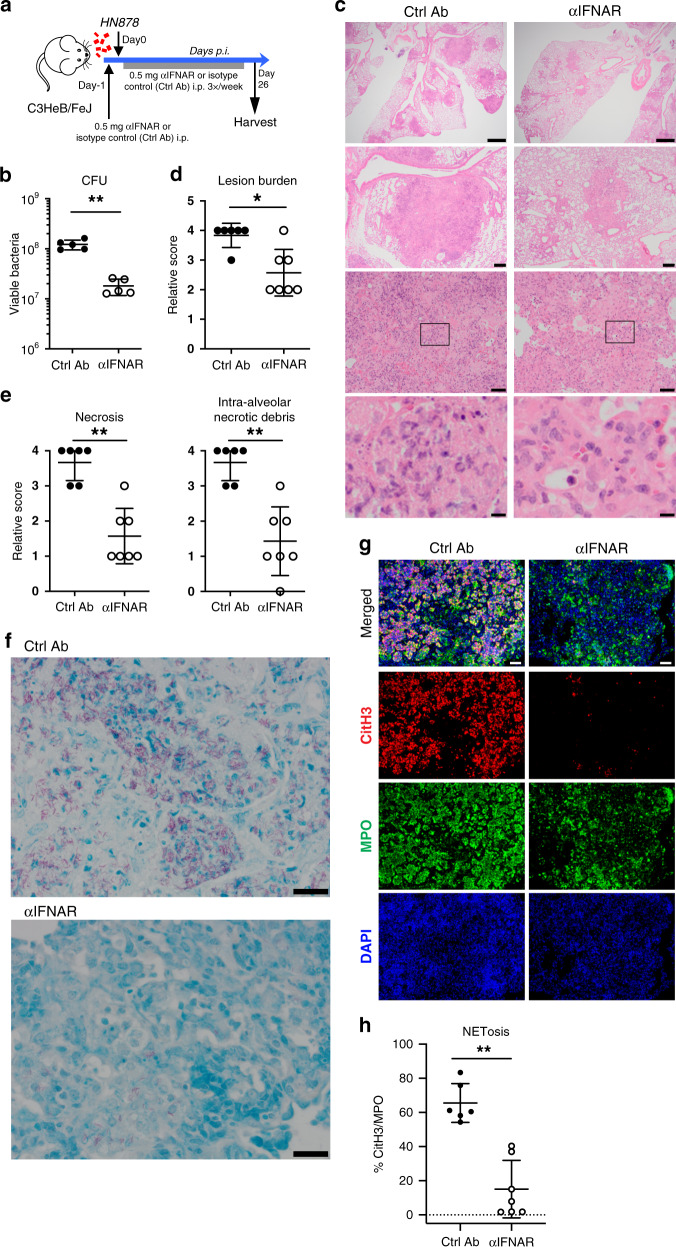
Tuberculosis (TB) is a leading cause of mortality due to infectious disease, but the factors determining disease progression are unclear. Transcriptional signatures associated with type I IFN signalling and neutrophilic inflammation were shown to correlate with disease severity in mouse models of TB. Here we show that similar transcriptional signatures correlate with increased bacterial loads and exacerbate pathology during Mycobacterium tuberculosis infection upon GM-CSF blockade. Loss of GM-CSF signalling or genetic susceptibility to TB (C3HeB/FeJ mice) result in type I IFN-induced neutrophil extracellular trap (NET) formation that promotes bacterial growth and promotes disease severity. Consistently, NETs are present in necrotic lung lesions of TB patients responding poorly to antibiotic therapy, supporting the role of NETs in a late stage of TB pathogenesis. Our findings reveal an important cytokine-based innate immune effector network with a central role in determining the outcome of M. tuberculosis infection.


Conflict of interest statement

The authors declare no competing interests.

Figures

Fig. 1
Fig. 1. GM-CSF controls lung bacterial growth and necrotic inflammation.
a Schematic of experimental design for GM-CSF blockade during M. tuberculosis infection: intraperitoneal (i.p.) injection of 1 mg anti-GM-CSF (αGM-CSF; open circles) or isotype control (labelled as Ctrl Ab; closed circles) monoclonal antibodies (mAbs) the day prior to aerosol infection with HN878 strain, followed by i.p. injections of 0.3 mg of αGM-CSF or Ctrl mAbs, twice weekly for 3 weeks. b Change in body weight at various days post-infection (n = 8 mice/group; mean ± SD). ***P < 0.0001. c Viable bacterial loads determined in the lungs at day 21 post-infection. **P = 0.0079. d Representative hematoxylin and eosin (H&E) staining of infected lung sections (n = 3 mice/group). Scale bars from top to bottom: 1 mm; 200 µm; 50 µm, 10 µm. e Relative lung lesion burden from H&E stained sections (Supplementary Data 1). 0 = no lesions, 1 = focal lesion, 2 = multiple focal lesions, 3 = one or more focal severe lesions, 4 = multiple focal lesions that are extensive and coalesce, 5 = extensive lesions that occupy the majority of the lung lobe. ***P < 0.0001. f Relative necrosis (left) and intra-alveolar necrotic debris (right) scores from H&E stained lung sections (Supplementary Data 1). 0 = not present, 1 = minimal, 2 = mild, 3 = moderate, 4 = marked. ***P < 0.0001. g Representative Ziehl–Neelsen staining of infected lung sections (n = 3 mice/group). Scale bars, 20 µm. Data representative (bd, g) or pooled (e, f) of five biological experiments. Represented is the mean ± SD; each dot represents an individual mouse: n = 5 mice/group (c) or n = 15 mice/group (e, f). Source data are provided as a Source Data file. Statistical analysis was performed using two-way ANOVA (b) or two-tailed Mann–Whitney test (c, e, f).
Fig. 2
Fig. 2. GM-CSF controls transcriptional signatures associated with TB pathogenesis.
WT mice were infected and/or treated as in Fig. 1a. Blood and lungs were collected from M. tuberculosis HN878-infected and uninfected mice for RNA-Seq analysis (n = 4–5 mice/group). a Blood modules of co-expressed genes derived using WGCNA from human TB datasets are shown for blood RNA-Seq datasets obtained from infected mice treated with αGM-CSF or Ctrl mAbs, compared to uninfected Ctrl Ab treated mice (Supplementary Data 3). c Lung modules of co-expressed genes derived using WGCNA from mouse lung disease modules are shown for lung RNA-Seq datasets obtained from infected mice treated with αGM-CSF or Ctrl mAbs, compared to uninfected Ctrl Ab treated mice (Supplementary Data 5). a, c Fold enrichment scores derived using QuSAGE are depicted, with red and blue indicating modules over- or under-abundant, compared to the controls. Colour intensity and size of the dots represents the degree of perturbation, indicated by the colour scale, with the largest dot representing the highest degree of perturbation within the plot. Only modules with fold enrichment scores with FDR P-value < 0.05 were considered significant and depicted here. Module name indicates biological processes associated with the genes within the module. b, d Boxplots depicting the module eigengene expression, i.e., the first principal component for all genes within the module, are shown for uninfected Ctrl Ab (light green) or αGM-CSF (light purple) and infected Ctrl Ab (dark green) or αGM-CSF (dark purple) treated groups (n = 4–5 mice/group), for (b) blood modules: Inflammasome/Granulocyte (HB3), Innate/hemopoietic mediators (HB5), Innate Immunity/PRR/C’/Granulocyte (HB8), Interferon/PRR (HB12) and Interferon/C’/Myeloid (HB23); and (d) lung modules: Type I IFN/Ifit/Oas (L5), Myeloid/granulocyte function (L10), IL-17 pathway/granulocytes (L11), Inflammation/IL-1 signalling/myeloid cells (L12), and Myeloid cells/Il1b/Tnf (L13). Gene expression profiles are shown using boxplots, where the upper and lower box limits show the interquartile range (limits of second and third quartiles), a thick horizontal bar within the box shows the median, whiskers show the minimum and maximum values, and each dot represents an individual mouse (n = 4–5 mice/group). C’, complement.; PRR, pathogen recognition receptor. GCC, glucocorticoid; K-channel, potassium channel; TM, transmembrane; Ubiq, ubiquitination.
Fig. 3
Fig. 3. Disease exacerbation upon GM-CSF blockade is neutrophil-dependent and correlates with NETosis.
a GSEA of immune cell-type associated gene sets showing normalized enrichment scores (NES) for lung RNA-Seq data from infected αGM-CSF versus infected Ctrl Ab treated mice. b Heatmap showing relative expression of genes in the neutrophil-associated gene set for individual lung samples from uninfected Ctrl Ab (light green) or αGM-CSF (light purple) and infected Ctrl Ab (dark green) or αGM-CSF (dark purple) treated mice (n = 4–5 mice/group). Gene expression values were averaged and scaled across the row to indicate the number of standard deviations above (red) or below (blue) the mean, denoted as row Z-score. The dendrogram shows unsupervised hierarchical clustering of genes. c WT mice were infected and treated with Ctrl Ab (closed circles) or αGM-CSF (open circles) as in Fig. 1a. Lung cell suspensions were prepared and stained for the detection of myeloid cells (Supplementary Fig. 5). Cell numbers for neutrophils (CD11b+Ly6G+), Ly6C+ monocytes (CD11b+Ly6GLy6C+) and alveolar macrophages (CD11blowCD11c+) are shown. *P = 0.0317. d WT mice were infected and treated with Ctrl Ab (closed symbols) or αGM-CSF (open symbols) as in Fig. 1a with the exception that from day 7 post-infection, mice also received 0.2 mg of anti-Ly6G (αLy6G; squares) or isotype control (labelled as Isotype; circles) mAbs every other day by i.p. injection. Lung viable bacterial loads were determined. **P = 0.0079. e Representative images of lung sections stained with citrullinated histone H3 (citH3; red), MPO (green), and DAPI (blue). NETs are visualized by colocalization of citH3 and DAPI staining (merged images; n = 3 mice/group). Bottom rows show detail from the top rows for each group. Scale bars, 50 µm. f Percentage of NET area in the lung normalized to MPO positive signal. **P = 0.0019. Data representative of one (a, b), two (d) or five (c, e) biological experiments; or data pooled of three independent experiments (f). Represented is the mean ± SD (c, f) or mean ± SEM (d); each dot represents an individual mouse: n = 5 mice/group (c, d) or n = 9 mice/group (f). Source data are provided as a Source Data file. Statistical analysis was performed using two-tailed Mann–Whitney test.
Fig. 4
Fig. 4. NETs are detected in lung lesions of TB-susceptible C3HeB/FeJ mice.
a C3HeB/FeJ mice were aerosol infected with M. tuberculosis HN878 treated by i.p. injection with 0.2 mg of anti-Ly6G (αLy6G; open circles) or isotype control (labelled as Isotype; closed circles) mAbs every other day, from day 7 post-infection until harvest on day 26 post-infection. Lung viable bacterial loads were determined. **P = 0.0079. Represented is the mean ± SD; each dot represents an individual mouse: n = 5 mice/group. Source data are provided as a Source Data file. Statistical analysis was performed using two-tailed Mann–Whitney test. b C3HeB/FeJ mice were aerosol infected with M. tuberculosis HN878 and their lungs harvested at day 35 post-infection. Formalin-fixed paraffin-embedded lung sections were stained with citrullinated histone H3 (citH3; red), MPO (green), and DAPI (blue). NETs are visualized by colocalization of citH3 and DAPI staining (merged image; n = 3 mice/group). Scale bars, 50 μm. Data from one experiment.
Fig. 5
Fig. 5. NETs are detected in necrotic lung lesions of human pulmonary TB.
Formalin-fixed paraffin-embedded lung sections from a total of thirteen patients with pulmonary TB (1 section per TB patient; Supplementary Table 1) were labelled with antibodies specific for citrullinated histone H3 (citH3; red) MPO (green) and DAPI (blue). NETs, visualized by colocalization of citH3 and DAPI staining (merged images, left), are shown for 6 TB patients. Scale bars, 50 µm. (All thirteen slides were stained and scanned together. See also Supplementary Fig. 6a).
Fig. 6
Fig. 6. IFNAR deletion abrogates disease exacerbation prompted by GM-CSF blockade during infection.
WT (circles) and Ifnar-/- (triangles) mice were infected and treated with Ctrl Ab (closed symbols) or αGM-CSF (open symbols) as in Fig. 1a. a Viable bacterial loads determined in the lungs at day 21 post-infection. **P < 0.0079. Represented is the mean ± SEM; each dot represents an individual mouse: n = 5 mice/group. Source data are provided as a Source Data file. Data representative of two biological experiments. Statistical analysis was performed using the two-tailed Mann–Whitney test. b Representative H&E staining of infected lung sections (n = 2–4 mice/group). Scale bars from top to bottom: 1 mm; 200 µm; 50 µm; 10 µm. c Relative lung lesion burden from H&E stained sections (Supplementary Data 1). 0 = no lesions, 1 = focal lesion, 2 = multiple focal lesions, 3 = one or more focal severe lesions, 4 = multiple focal lesions that are extensive and coalesce, 5 = extensive lesions that occupy the majority of the lung lobe. ***P < 0.0001. d Relative necrosis and intra-alveolar necrotic debris scores from H&E stained lung sections (Supplementary Data 1). 0 = not present, 1 = minimal, 2 = mild, 3 = moderate, 4 = marked. ***P < 0.0001; *P = 0.0294. c, d Data pooled from four biological experiments. Represented is the mean ± SD; each dot represents an individual mouse: n = 11–13 mice/group. Source data are provided as a Source Data file. Statistical analysis was performed using one-way ANOVA Tukey’s multiple comparisons test. e Representative Ziehl–Neelsen staining of infected lung sections (n = 2–4 mice/group). Scale bars, 20 µm. Data representative of four biological experiments (b, e).
Fig. 7
Fig. 7. IFNAR deletion abrogates NET formation prompted by GM-CSF blockade during infection.
WT (circles) and Ifnar−/− (triangles) mice were infected and treated with Ctrl Ab (closed symbols) or αGM-CSF (open symbols) as in Fig. 1a. a Representative images of lung sections stained with citrullinated histone H3 (citH3; red), MPO (green), and DAPI (blue). NETs are visualized by colocalization of citH3 and DAPI staining (merged images; n = 3 mice/group). Scale bars, 50 µm. Data representative of two biological experiments. b Percentage of NET area in the lung normalized to MPO positive signal. **P = 0.0022. Data pooled from two biological experiments. Represented is the mean ± SD; each dot represents an individual mouse: n = 6 mice/group. Source data are provided as a Source Data file. Statistical analysis was performed using the two-tailed Mann–Whitney test.
Fig. 8
Fig. 8. Type I IFN activates neutrophils to promote bacterial growth.
Ifnarfl/fl MRP8-Cre negative (Creneg; circles) or positive (Crepos; squares) mice were infected and treated with Ctrl Ab (closed symbols) or αGM-CSF (open symbols) as in Fig. 1a. a Viable bacterial loads determined in the lungs at day 21 post-infection. **P < 0.0022. Data representative of two biological experiments. Represented is the mean ± SEM; each dot represents an individual mouse: n = 4–6 mice/group/experiment. b Representative images of lung sections stained with citrullinated histone H3 (citH3; red), MPO (green), and DAPI (blue). NETs are visualized by colocalization of citH3 and DAPI staining (merged images). Scale bars, 50 µm. Data representative of two biological experiments (n = 3–4 mice/group/experiment). c Percentage of NET area in the lung normalized to MPO positive signal. Data pooled from two biological experiments. Represented is the mean ± SD; each dot represents an individual mouse: n = 7–8 mice/group. Source data are provided as a Source Data file. Statistical analysis was performed using two-tailed Mann–Whitney test.
Fig. 9
Fig. 9. IFNAR signalling is required for severity of lung NETosis in C3HeB/FeJ mice.
a Schematic of experimental design: C3HeB/FeJ mice were treated by intraperitoneal (i.p.) injection of 0.5 mg of anti-IFNAR (αIFNAR; open circles) or isotype control (labelled as Ctrl Ab; closed circles) mAbs the day prior low dose HN878 aerosol infection, followed by i.p. injections of 0.5 mg of αIFNAR or Ctrl mAbs, three times per weekly until harvest on day 26 post-infection. b Viable bacterial loads were determined. **P = 0.0079. c Representative hematoxylin and eosin (H&E) staining of infected lung sections (n = 3 mice/group). Scale bars from top to bottom: 1 mm; 200 µm; 50 µm, 10 µm. d Relative lung lesion burden from H&E stained sections (Supplementary Data 1). 0 = no lesions, 1 = focal lesion, 2 = multiple focal lesions, 3 = one or more focal severe lesions, 4 = multiple focal lesions that are extensive and coalesce, 5 = extensive lesions that occupy the majority of the lung lobe. *P = 0.0152. e Relative necrosis (left) and intra-alveolar necrotic debris (right) scores from H&E stained lung sections (Supplementary Data 1). 0 = not present, 1 = minimal, 2 = mild, 3 = moderate, 4 = marked. **P = 0.0023. f Representative Ziehl–Neelsen staining of infected lung sections. Scale bars, 20 µm. g Representative images of lung sections labelled with citrullinated histone H3 (citH3; red), MPO (green), and DAPI (blue). NETs are visualized by colocalization of citH3 and DAPI staining (merged images). Scale bars, 50 μm. h Percentage of NET area in the lung normalized to MPO positive signal. **P < 0.0012. b, c, f, g Data representative of two biological replicate experiments. d, e, h Data pooled from two biological experiments. Represented is the mean ± SD; each dot represents an individual mouse: n = 5 mice/group (b) or n = 6–7 mice/group (d, e, h). Source data are provided as a Source Data file. Statistical analysis was performed using the two-tailed Mann–Whitney test.

References

    1. WHO. Global Tuberculosis Report 2019. (World Health Organization, 2019).
    1. Cooper AM. Cell-mediated immune responses in tuberculosis. Annu. Rev. Immunol. 2009;27:393–422. doi: 10.1146/annurev.immunol.021908.132703. - DOI - PMC - PubMed
    1. Mayer-Barber KD, Sher A. Cytokine and lipid mediator networks in tuberculosis. Immunol. Rev. 2015;264:264–275. doi: 10.1111/imr.12249. - DOI - PMC - PubMed
    1. O’Garra A, et al. The immune response in tuberculosis. Annu. Rev. Immunol. 2013;31:475–527. doi: 10.1146/annurev-immunol-032712-095939. - DOI - PubMed
    1. Singhania A, Wilkinson RJ, Rodrigue M, Haldar P, O’Garra A. The value of transcriptomics in advancing knowledge of the immune response and diagnosis in tuberculosis. Nat. Immunol. 2018;19:1159–1168. doi: 10.1038/s41590-018-0225-9. - DOI - PMC - PubMed

Publication types

MeSH terms

Substances