. 2020 Nov 4;10(1):19073.
doi: 10.1038/s41598-020-76014-4.

Driven progressive evolution of genome sequence complexity in Cyanobacteria

Affiliations

Driven progressive evolution of genome sequence complexity in Cyanobacteria

Andrés Moya et al. Sci Rep. .

Abstract

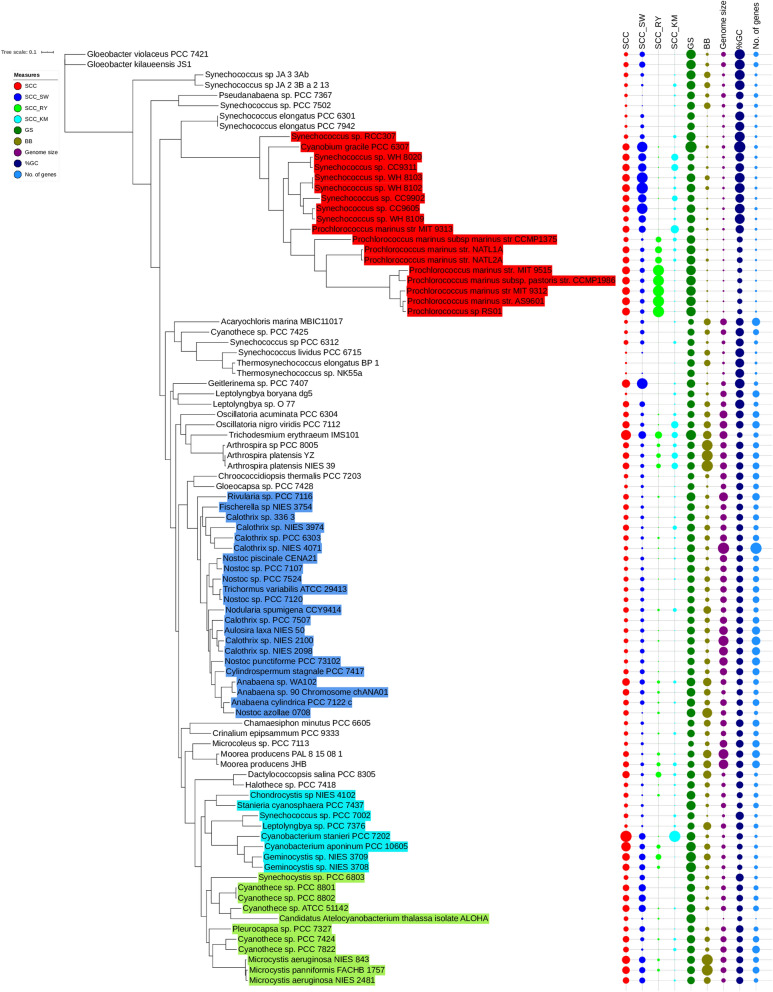
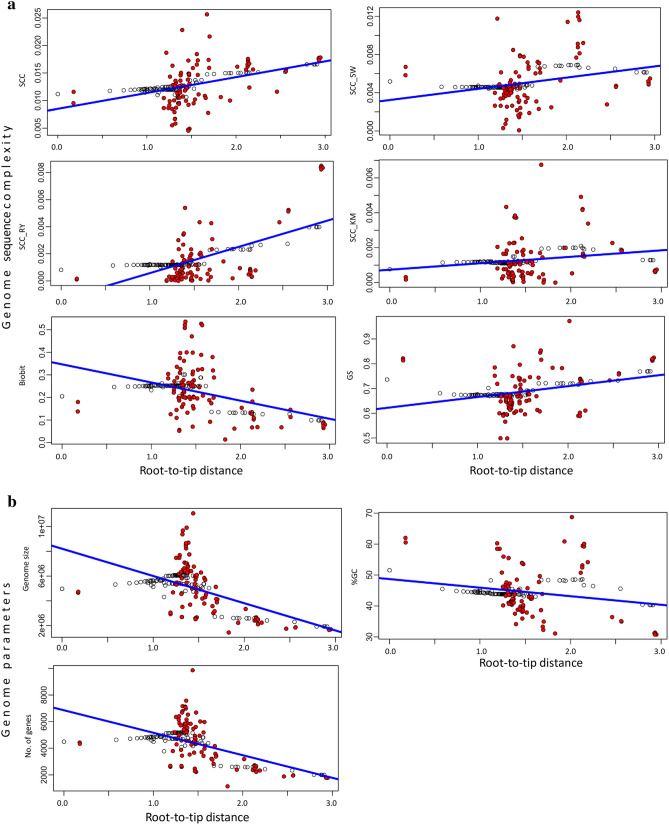
Progressive evolution, or the tendency towards increasing complexity, is a controversial issue in biology, which resolution entails a proper measurement of complexity. Genomes are the best entities to address this challenge, as they encode the historical information of a species' biotic and environmental interactions. As a case study, we have measured genome sequence complexity in the ancient phylum Cyanobacteria. To arrive at an appropriate measure of genome sequence complexity, we have chosen metrics that do not decipher biological functionality but that show strong phylogenetic signal. Using a ridge regression of those metrics against root-to-tip distance, we detected positive trends towards higher complexity in three of them. Lastly, we applied three standard tests to detect if progressive evolution is passive or driven-the minimum, ancestor-descendant, and sub-clade tests. These results provide evidence for driven progressive evolution at the genome-level in the phylum Cyanobacteria.


Conflict of interest statement

The authors declare no competing interests.

Figures

Figure 1
Figure 1
Phylogeny of Cyanobacteria with the metrics of sequence complexity and genome parameters for each chosen genome. The values of metrics and parameters are proportional to circle size. The colored species correspond to four monophyletic sub-clades that were used to test evidence of a driven trend for each sub-clade (see also Fig. S2).
Figure 2
Figure 2
Phylogenetic trends of genomic complexity metrics (a) and standard genome parameters (b). The estimated genomic value for each tip (red circles) or node (white circles) in the phylogenetic tree is regressed against its evolutionary age (i.e., distance from the root). The statistical significance of the regression is tested against 10,000 slopes obtained under simulated Brownian evolution. The slopes and their P values are shown in Table S2.
Figure 3
Figure 3
Distribution of metrics and parameters according to root-to-tip distance. The interior dashed line corresponds to the value of the basal clade, xb. The histograms that appear above each figure correspond to the number of accumulated values of metrics and parameters (regardless of the age) ranging from lower (left) to higher (right) values than xb.
Figure 4
Figure 4
Mapping of the SCC complexity metric on the Cyanobacteria tree.

References

    1. Moya A. The Calculus of Life. New York: Springer; 2014.
    1. Gould SJ. Full House: The Spread of Excellence from Plato to Darwin. New York: Harmony Books; 1996.
    1. McShea DW, Brandon RN. Biology’s First Law. Chicago: Chicago University Press; 2010.
    1. Day T. Computability, Gödel’s incompleteness theorem, and an inherent limit on the predictability of evolution. J. R. Soc. Interface. 2012;9:624–639. doi: 10.1098/rsif.2011.0479. - DOI - PMC - PubMed
    1. Corominas-Murtra B, Seoane LF, Solé R. Zipf’s Law, unbounded complexity and open-ended evolution. J. R. Soc. Interface. 2018;15:20180395. doi: 10.1098/rsif.2018.0395. - DOI - PMC - PubMed

Publication types