. 2020 Nov 4;11(1):5581.
doi: 10.1038/s41467-020-19319-2.

Common schizophrenia risk variants are enriched in open chromatin regions of human glutamatergic neurons

Affiliations

Common schizophrenia risk variants are enriched in open chromatin regions of human glutamatergic neurons

Mads E Hauberg et al. Nat Commun. .

Abstract

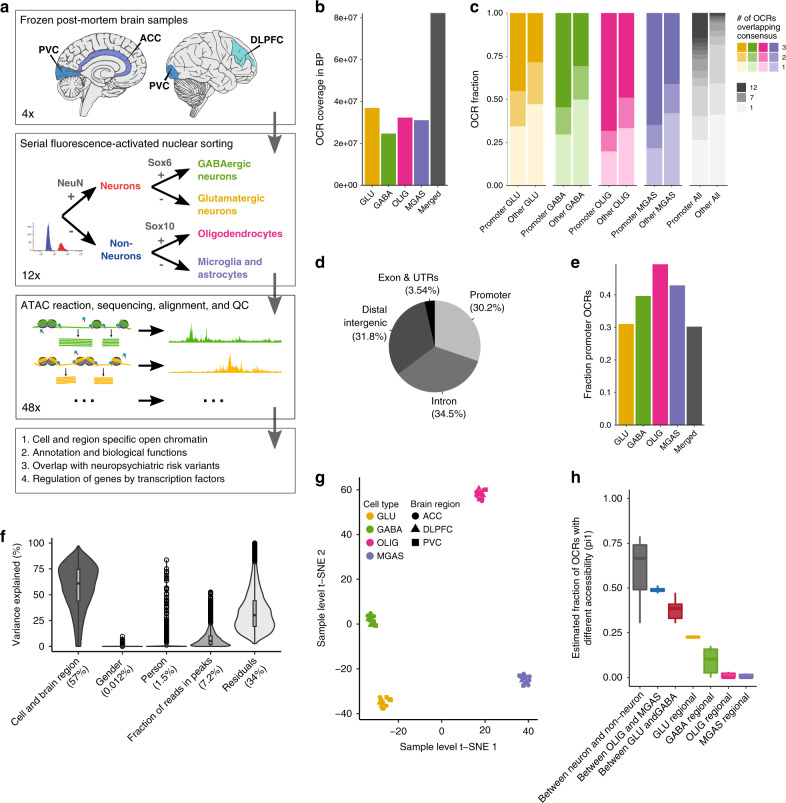
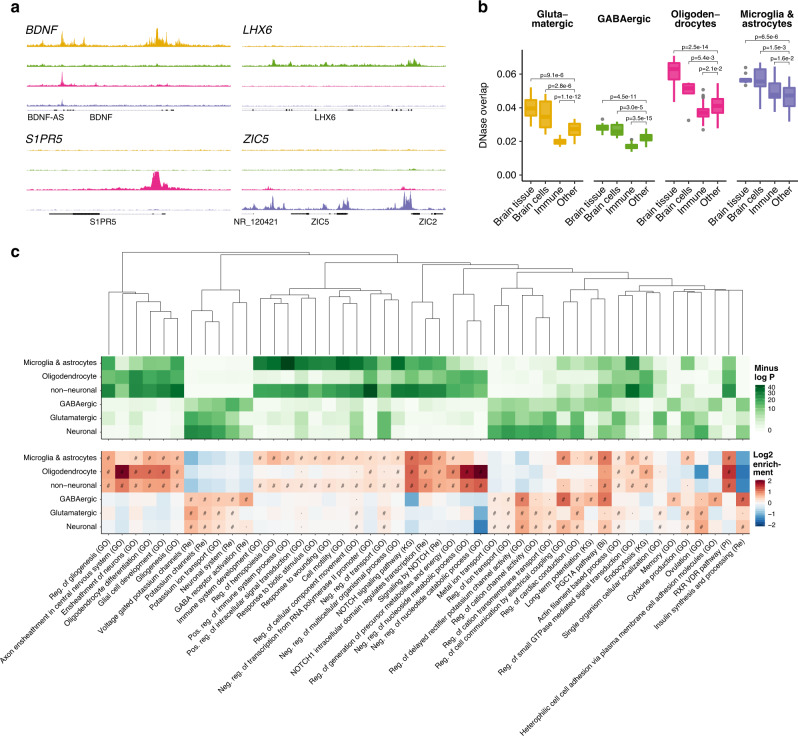
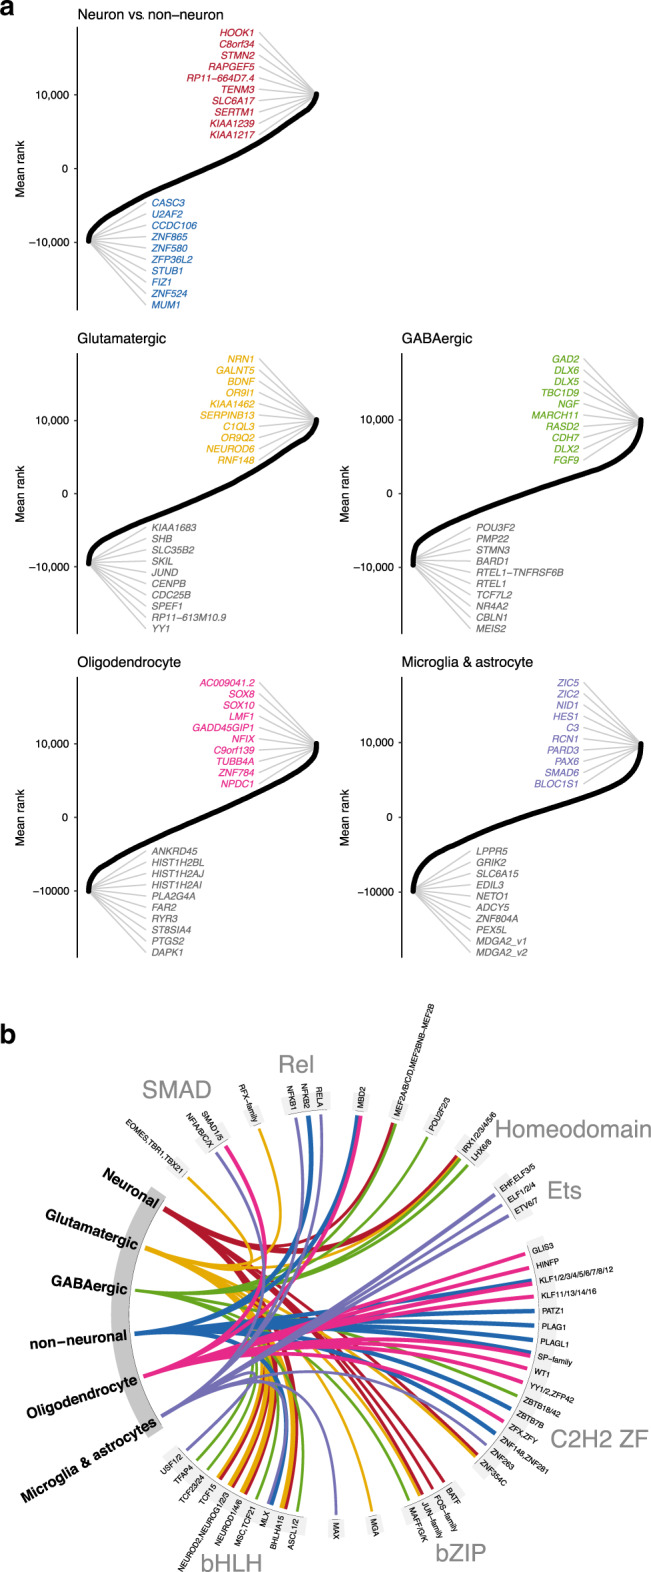
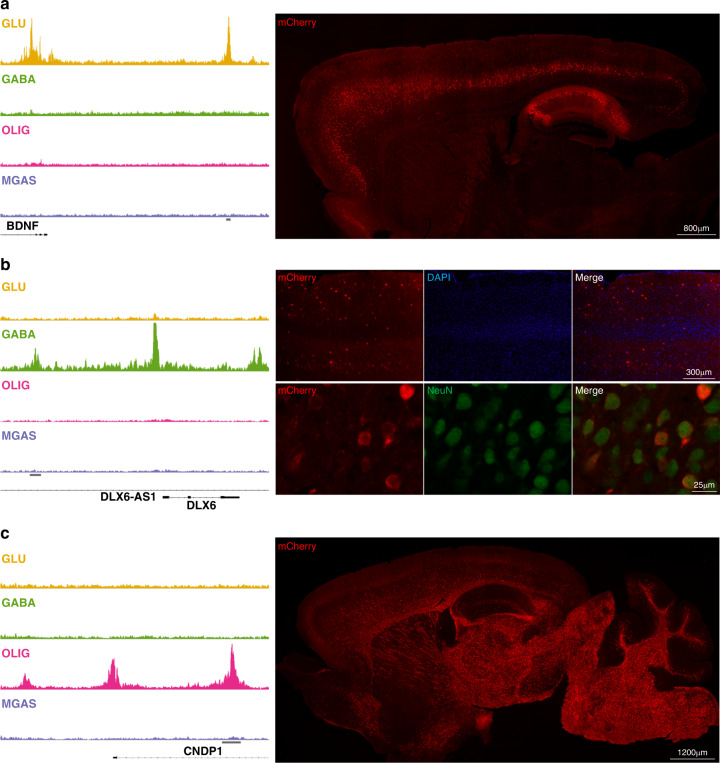
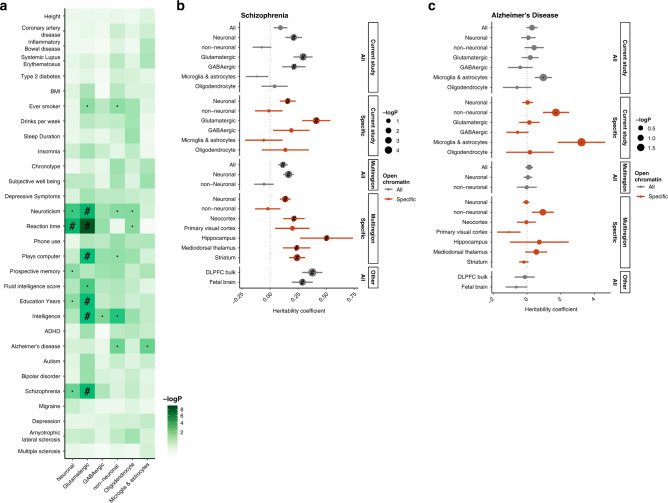
The chromatin landscape of human brain cells encompasses key information to understanding brain function. Here we use ATAC-seq to profile the chromatin structure in four distinct populations of cells (glutamatergic neurons, GABAergic neurons, oligodendrocytes, and microglia/astrocytes) from three different brain regions (anterior cingulate cortex, dorsolateral prefrontal cortex, and primary visual cortex) in human postmortem brain samples. We find that chromatin accessibility varies greatly by cell type and, more moderately, by brain region, with glutamatergic neurons showing the largest regional variability. Transcription factor footprinting implicates cell-specific transcriptional regulators and infers cell-specific regulation of protein-coding genes, long intergenic noncoding RNAs and microRNAs. In vivo transgenic mouse experiments validate the cell type specificity of several of these human-derived regulatory sequences. We find that open chromatin regions in glutamatergic neurons are enriched for neuropsychiatric risk variants, particularly those associated with schizophrenia. Integration of cell-specific chromatin data with a bulk tissue study of schizophrenia brains increases statistical power and confirms that glutamatergic neurons are most affected. These findings illustrate the utility of studying the cell-type-specific epigenome in complex tissues like the human brain, and the potential of such approaches to better understand the genetic basis of human brain function.


Conflict of interest statement

The authors declare no competing interests.

Figures

Fig. 1
Fig. 1. Outline of study and chromatin accessibility across four cell types.
a Study design: Dissections from three brain regions of four early adulthood control subjects were obtained from frozen human postmortem tissue (ACC: anterior cingulate cortex; DLPFC: dorsolateral prefrontal cortex; and PVC: primary visual cortex). Nuclei were subjected to fluorescence-activated nuclear sorting to yield four-cell subpopulations, followed by ATAC-seq profiling and subsequent downstream analyses to identify cell type-specific open chromatin regions and differences in biology. b Genomic coverage in base pairs of identified OCRs by cell type. c Number of OCRs called per sample groups. For the individual cell types three overlaps mean that the OCR was detected in all three brain regions and for “All” 12 overlaps means the OCR was detected in all brain regions and cell types. d Genomic annotation of consensus OCRs. OCRs within 3 kb of a TSS were considered promoter OCRs. e Fraction of OCRs considered as promoter OCRs by cell type. f Violin plot that illustrated the proportion of variation in chromatin accessibility explained by biological and technical covariates. The fraction of reads in peaks can be considered a signal to noise parameter. Numbers in parentheses indicate median. g t-SNE clustering of chromatin accessibility using adjusted read counts in 47 independent samples. h Quantification of statistical differences between various cell types by brain region comparisons using the pi1 metric. The center shows the median, the box shows the interquartile range, whiskers indicate the highest/lowest values within 1.5x the interquartile range, and potential outliers from this are shown as dots. From left to right, the number of independent contrasts represented by each boxplot are: 54, 9, 9, 3, 3, 3, and 3. The pi1 estimates the proportion of non-null tests. The boxplot shows the pi1 estimate between the relevant sample groups. For instance, “Between OLIG and MGAS” are all pairwise comparisons of the three OLIG sample groups (ACC/DLPFC/PVC) and the three MGAS sample groups (ACC/DLPFC/PVC). OCR open chromatin region, GLU glutamatergic neurons, GABA GABAergic neurons, OLIG oligodendrocytes, MGAS microglia and astrocytes, ACC anterior cingulate cortex, DLPFC dorsolateral prefrontal cortex, and PVC primary visual cortex.
Fig. 2
Fig. 2. Cell-specific OCRs, overlap with DNAse-seq, and biological functions.
a Examples of genes with cell-specific open chromatin. Cell types from top to bottom are; glutamatergic neurons, GABAergic neurons, oligodendrocytes, and microglia/astrocytes. b Overlap between cell-specific open chromatin (ATAC-seq) and 127 samples from REMC (DNase-seq). The overlap was calculated by the Jaccard index of the base pair overlap. Samples from REMC were aggregated into four groups: brain tissue, brain-derived cells, immune cells/tissues, and other non-brain cells/tissues. The center shows the median, the box shows the interquartile range, whiskers indicate the highest/lowest values within 1.5x the interquartile range, and outliers from this are shown as dots. The number of independent sample overlaps represented by the boxplot groups are as follows: Brain tissue: 10, Brain cells: 6, Immune: 30, and Other: 81. To assess the significance of the differences in overlap for our cell-specific OCRs with the four REMC categories, a multiple regression analysis with the “Other” category as the intercept was done. P-values indicate significance of enrichment/depletion against the other category uncorrected for multiple testing. c Overlap between cell-specific open chromatin (ATAC-seq) and gene sets representing biological processes and pathways. Only those that were within the top ten most significant gene sets in one or more ATAC-seq categories are shown. Pathways were clustered by the Jaccard index using the WardD method. “#”: one-sided binomial FDR < 0.001, “·”: one-sided binomial FDR < 0.05, “Bi”: BIOCARTA, “GO”: gene ontology, “KG”: KEGG, “Re”: REACTOME, “Reg.”: regulation, “Pos.” positive, “Neg.” negative.
Fig. 3
Fig. 3. Gene regulation inferred from genomic footprinting.
a Identification of protein-coding genes showing cell-specific regulation. Aggregated ranking of pairwise comparisons of protein-coding gene regulation between neuronal/non-neuronal cells and each of the four different cell types. In neuronal/non-neuronal cell comparison, positive and negative values indicated a higher burden of gene regulation in neuronal and non-neuronal samples, respectively. For the GABA, GLU, OLIG, and MGAS analyses, each of the four different cell types was compared to the remaining three cell types. Positive values indicated a higher burden of gene regulation in the given cell type and negative value a lower burden of gene regulation than in the other cell types. b Top 10 most cell-specific TF motifs based on fold enrichment in cell-specific OCRs. Fold enrichments for a given cell type were determined from the number of footprinted binding sites overlapping cell-specific OCRs compared to the number of footprinted binding sites overlapping OCRs specific to the other cells. The statistical significance of the enrichments was assessed using a one-sided binomial test. All associations illustrated here were significant after Bonferroni corrections for multiple testing. The line width indicates the log2 fold enrichment. Motifs are grouped based on the TF family to which they belong.
Fig. 4
Fig. 4. Transgenic evaluation of putative cell-type-specific enhancers.
Left column: Cell-type-specific OCRs identified by ATAC-seq and nearby genes: (a) glutamatergic (BDNF), (b) GABAergic (DLX6), and (c) oligodendrocytes (CNDP1). The horizontal gray bars denote OCR assayed in directed transcription via transgenesis. Right: Representative immunofluorescent images showing mCherry (red) expression in 30 µm thick sagittal sections from (a) BDNF and (c) CNPD1 transgenic mice. In (a), specific mCherry expression is identified in Layer V of the cortex and in hippocampus. In (b) representative images of mCherry (red) staining in the cortex of DLX6 transgenic mice (top panel) and double labeling with NeuN (green; bottom panel), showing expression restricted to neurons and scattered in the cortex, similar to the distribution of GABAergic interneurons. In (c) mCherry expression is shown to be restricted to white matter. Four image frames of three independent brain slices per each mouse were analyzed (BDNF enhancer n = 5; DLX6 enhancer n = 6; CNDP1 enhancer n = 4).
Fig. 5
Fig. 5. Overlap of OCRs with trait- and disease-associated genetic variants.
a P-value for enrichment of trait-associated genetic variants in cell-specific OCRs. The heritability coefficient of genetic variants overlapping different sets of OCRs in (b) SCZ and (c) AD. Positive coefficient signifies enrichment in heritability. “Multiregion” was our previous study of neuronal and non-Neuronal cells across multiple regions of the adult human brain. The region-specific OCRs are neuronal, as only neuronal cells showed a marked region variability. In all cases, the overlap was assessed using LD-score partitioned heritability where the OCRs were padded with 1000 bp to also capture adjacent genetic variants and corrected for the general genomic background. ”#”: Significant for enrichment in LD score regression after FDR correction of multiple testing across all tests in the plot (Benjamini & Hochberg); ”·”: Nominally significant for enrichment; DLPFC: dorsolateral prefrontal cortex. Error bars indicate standard errors from LD score regression using respectively 1,021,224 and 1,034,664 SNPs.
Fig. 6
Fig. 6. Using cell-specific OCRs for deconvolution of bulk ATAC-seq data.
a Violin plot illustrating the proportion of variation in chromatin accessibility explained by biological, technical, and cell-type deconvolution covariates. The GC ratio can be considered a signal to noise parameter. Numbers in parentheses indicate the median. b In various scenarios the proportion of non-null tests, pi1, was estimated for OCRs. Higher estimates indicate more significant differences between schizophrenia cases and controls. First, the effect of deconvolution on the pi1 was assessed, and the addition of a deconvolution parameter was seen to increase power to detect case-control differences. Secondly, the pi1 estimates were calculated in just cell-specific OCRs. Here the largest case-control differences were seen in GLU-specific OCRs.

References

    1. Gusev A, et al. Partitioning heritability of regulatory and cell-type-specific variants across 11 common diseases. Am. J. Hum. Genet. 2014;95:535–552. doi: 10.1016/j.ajhg.2014.10.004. - DOI - PMC - PubMed
    1. Kundaje A, et al. Integrative analysis of 111 reference human epigenomes. Nature. 2015;518:317–330. doi: 10.1038/nature14248. - DOI - PMC - PubMed
    1. Arner E, et al. Transcribed enhancers lead waves of coordinated transcription in transitioning mammalian cells. Science. 2015;347:1010–1014. doi: 10.1126/science.1259418. - DOI - PMC - PubMed
    1. Kozlenkov A, et al. A unique role for DNA (hydroxy) methylation in epigentic regulation of human inhibitory neurons. Sci. Adv. 2018;4:eaau6190. doi: 10.1126/sciadv.aau6190. - DOI - PMC - PubMed
    1. Fullard JF, et al. An atlas of chromatin accessibility in the adult human brain. Genome Res. 2018;28:1243–1252. doi: 10.1101/gr.232488.117. - DOI - PMC - PubMed

Publication types

MeSH terms