

Evolution from adherent to suspension: systems biology of HEK293 cell line development
- PMID: 33149219
- PMCID: PMC7642379
- DOI: 10.1038/s41598-020-76137-8
Evolution from adherent to suspension: systems biology of HEK293 cell line development
Erratum in
-
Author Correction: Evolution from adherent to suspension: systems biology of HEK293 cell line development.Sci Rep. 2021 Mar 2;11(1):5407. doi: 10.1038/s41598-021-85105-9. Sci Rep. 2021. PMID: 33654173 Free PMC article. No abstract available.
Abstract
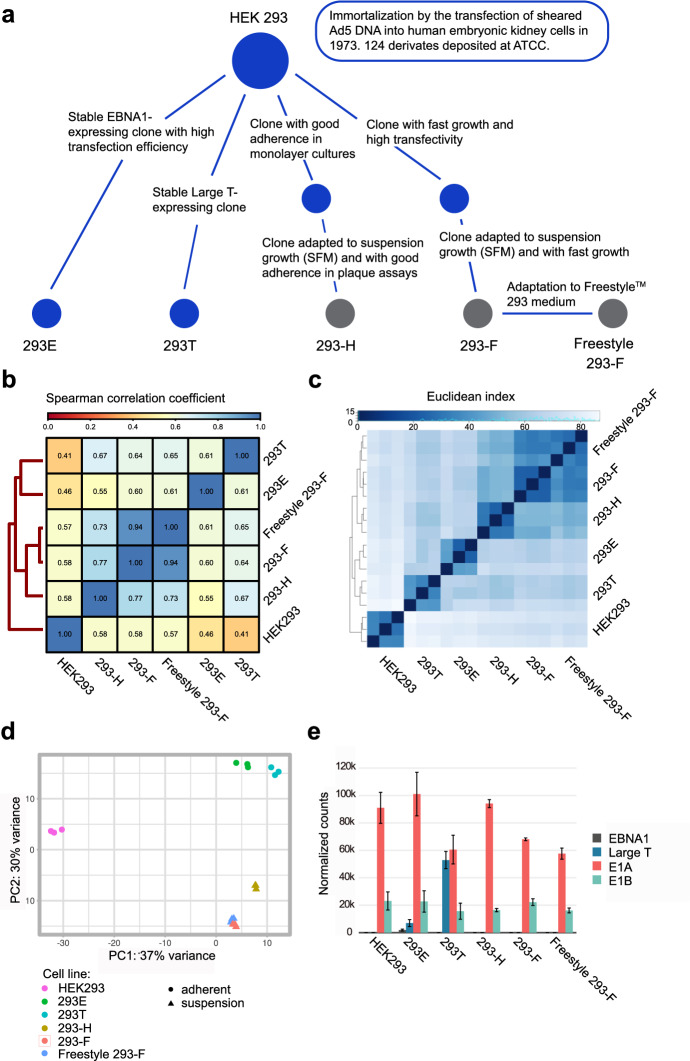
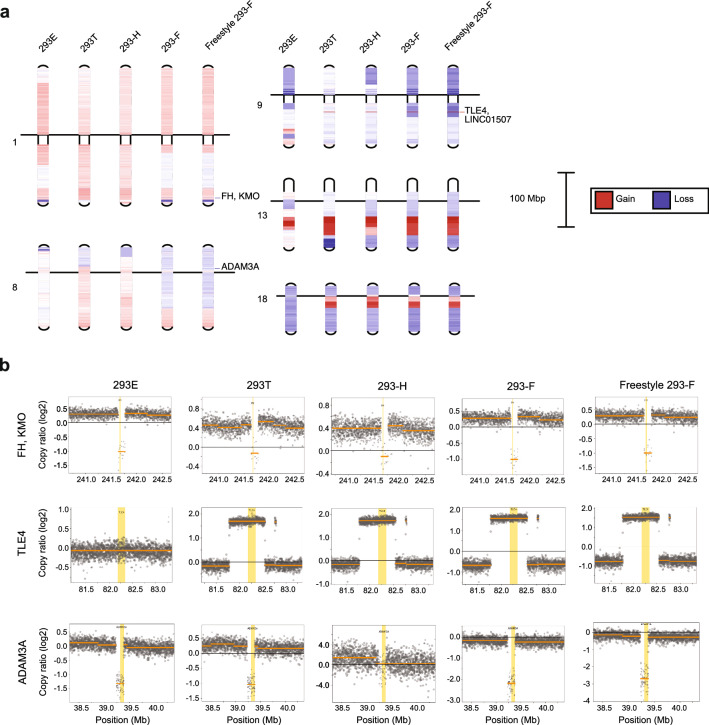
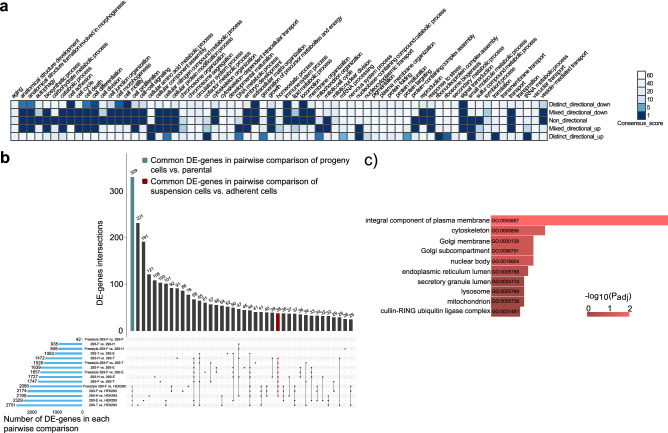
The need for new safe and efficacious therapies has led to an increased focus on biologics produced in mammalian cells. The human cell line HEK293 has bio-synthetic potential for human-like production attributes and is currently used for manufacturing of several therapeutic proteins and viral vectors. Despite the increased popularity of this strain we still have limited knowledge on the genetic composition of its derivatives. Here we present a genomic, transcriptomic and metabolic gene analysis of six of the most widely used HEK293 cell lines. Changes in gene copy and expression between industrial progeny cell lines and the original HEK293 were associated with cellular component organization, cell motility and cell adhesion. Changes in gene expression between adherent and suspension derivatives highlighted switching in cholesterol biosynthesis and expression of five key genes (RARG, ID1, ZIC1, LOX and DHRS3), a pattern validated in 63 human adherent or suspension cell lines of other origin.
Conflict of interest statement
The authors declare no competing interests.
Figures


Similar articles
-
Affecting HEK293 Cell Growth and Production Performance by Modifying the Expression of Specific Genes.Cells. 2021 Jul 2;10(7):1667. doi: 10.3390/cells10071667. Cells. 2021. PMID: 34359846 Free PMC article. Review.
-
Reprogramming anchorage dependency to develop cell lines for recombinant protein expression.Biotechnol J. 2024 May;19(5):e2400104. doi: 10.1002/biot.202400104. Biotechnol J. 2024. PMID: 38700448
-
Retroviral vector production using suspension-adapted 293GPG cells in a 3L acoustic filter-based perfusion bioreactor.Biotechnol Bioeng. 2006 Nov 5;95(4):653-60. doi: 10.1002/bit.20947. Biotechnol Bioeng. 2006. PMID: 16947907
-
Production of Recombinant Adeno-associated Virus Vectors Using Suspension HEK293 Cells and Continuous Harvest of Vector From the Culture Media for GMP FIX and FLT1 Clinical Vector.Mol Ther. 2016 Feb;24(2):287-297. doi: 10.1038/mt.2015.187. Epub 2015 Oct 6. Mol Ther. 2016. PMID: 26437810 Free PMC article.
-
HEK293 Cell Line as a Platform to Produce Recombinant Proteins and Viral Vectors.Front Bioeng Biotechnol. 2021 Dec 13;9:796991. doi: 10.3389/fbioe.2021.796991. eCollection 2021. Front Bioeng Biotechnol. 2021. PMID: 34966729 Free PMC article. Review.
Cited by
-
Adherent and suspension baby hamster kidney cells have a different cytoskeleton and surface receptor repertoire.PLoS One. 2021 Jun 4;16(6):e0246610. doi: 10.1371/journal.pone.0246610. eCollection 2021. PLoS One. 2021. PMID: 34086711 Free PMC article.
-
Expression of UCOE and HSP27 Molecular Elements to Improve the Stable Protein Production on HEK293 Cells.Biomed Res Int. 2025 Feb 25;2025:5556353. doi: 10.1155/bmri/5556353. eCollection 2025. Biomed Res Int. 2025. PMID: 40041570 Free PMC article.
-
Impact of Light-Chain Variants on the Expression of Therapeutic Monoclonal Antibodies in HEK293 and CHO Cells.Antibodies (Basel). 2025 Jun 24;14(3):53. doi: 10.3390/antib14030053. Antibodies (Basel). 2025. PMID: 40700293 Free PMC article.
-
Gene regulatory activity associated with polycystic ovary syndrome revealed DENND1A-dependent testosterone production.Nat Commun. 2025 Aug 18;16(1):7697. doi: 10.1038/s41467-025-62884-7. Nat Commun. 2025. PMID: 40825976 Free PMC article.
-
Interaction of human CRX and NRL in live HEK293T cells measured using fluorescence resonance energy transfer (FRET).Sci Rep. 2022 Apr 28;12(1):6937. doi: 10.1038/s41598-022-10689-9. Sci Rep. 2022. PMID: 35484285 Free PMC article.
References
-
- Leader B, Baca QJ, Golan DE. Protein therapeutics: a summary and pharmacological classification. Nat. Rev. Drug Discov. 2008;7:21–39. - PubMed
-
- Alex Philippidis. The Top 15 Best-Selling Drugs of 2016 | The Lists | GEN. (2017).
-
- Walsh G. Biopharmaceutical benchmarks 2014. Nat. Biotechnol. 2014;32:992–1000. - PubMed
-
- Wlaschin KF, et al. EST sequencing for gene discovery in Chinese hamster ovary cells. Biotechnol. Bioeng. 2005;91:592–606. - PubMed
Publication types
MeSH terms
Substances
LinkOut - more resources
Full Text Sources
Other Literature Sources
