. 2020 Nov 4;10(1):18995.
doi: 10.1038/s41598-020-75972-z.

Epitope similarity cannot explain the pre-formed T cell immunity towards structural SARS-CoV-2 proteins

Affiliations

Epitope similarity cannot explain the pre-formed T cell immunity towards structural SARS-CoV-2 proteins

Ulrik Stervbo et al. Sci Rep. .

Abstract

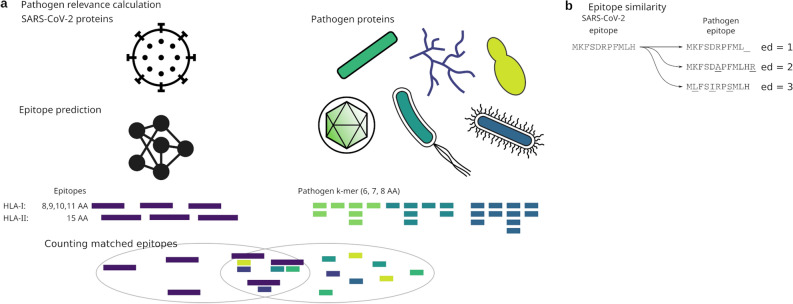
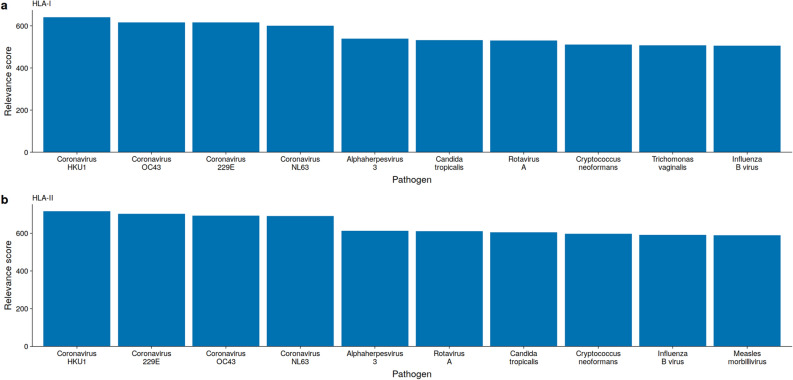
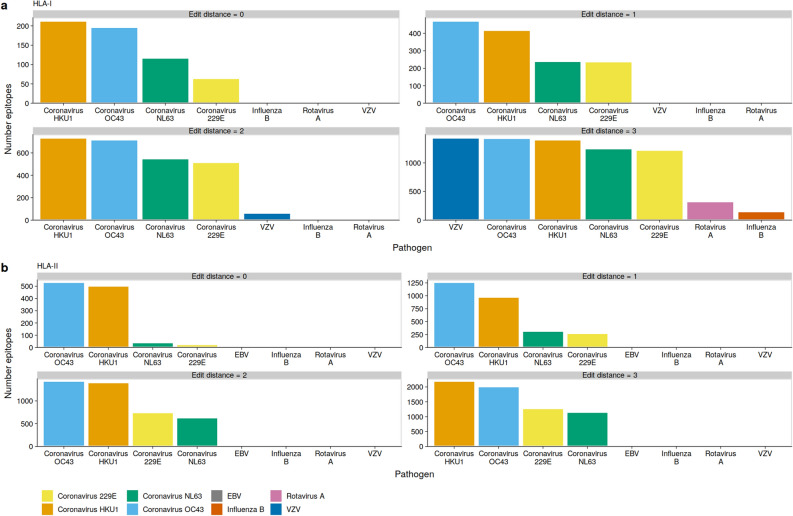
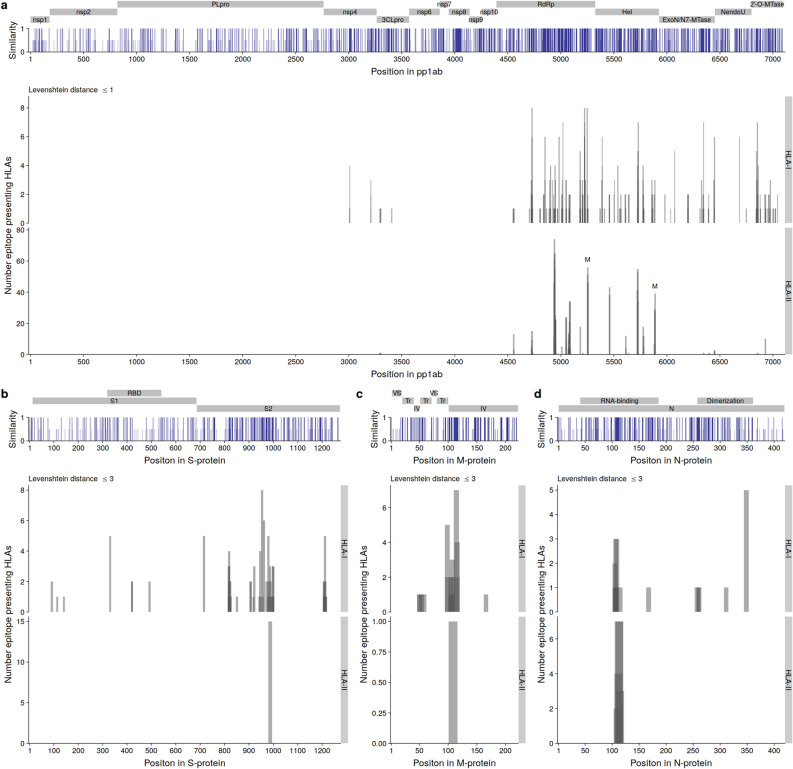
The current pandemic is caused by the SARS-CoV-2 virus and large progress in understanding the pathology of the virus has been made since its emergence in late 2019. Several reports indicate short lasting immunity against endemic coronaviruses, which contrasts studies showing that biobanked venous blood contains T cells reactive to SARS-CoV-2 S-protein even before the outbreak in Wuhan. This suggests a preformed T cell memory towards structural proteins in individuals not exposed to SARS-CoV-2. Given the similarity of SARS-CoV-2 to other members of the Coronaviridae family, the endemic coronaviruses appear likely candidates to generate this T cell memory. However, given the apparent poor immunological memory created by the endemic coronaviruses, immunity against other common pathogens might offer an alternative explanation. Here, we utilize a combination of epitope prediction and similarity to common human pathogens to identify potential sources of the SARS-CoV-2 T cell memory. Although beta-coronaviruses are the most likely candidates to explain the pre-existing SARS-CoV-2 reactive T cells in uninfected individuals, the SARS-CoV-2 epitopes with the highest similarity to those from beta-coronaviruses are confined to replication associated proteins-not the host interacting S-protein. Thus, our study suggests that the observed SARS-CoV-2 pre-formed immunity to structural proteins is not driven by near-identical epitopes.


Conflict of interest statement

The authors declare no competing interests.

Figures

Figure 1
Figure 1
Analysis approach. (a) k-mers for k ϵ {6, 7, 8} were extracted from the proteins of relevant human pathogens and compared to epitopes predicted in the SARS-CoV-2 proteins. The epitope prediction was by netMHCpan and netMHCIIpan. Pathogens were ranked based on exact k-mer hits to the epitopes. (b) Principle of edit distance determination of epitopes. The SARS-CoV-2 epitope MKFSDRPFMLH has a edit distance of 1 when compared to the putative pathogen epitope MKFSDRPFML_ because of the missing histidine at the C-terminus. The distance between MKFSDRPFMLH and MKFSDAPFMLHR is 2 because of the D6A exchange and the additional arginine at the C-terminus. The K2L, D5I, and F8S exchanges give rise to an edit distance of 3 between MKFSDRPFMLH and MLFSIRPSMLH.
Figure 2
Figure 2
Some viruses and bacteria have peptides (k-mers) matching SARS-CoV-2 epitopes. The top 10 pathogen relevance scores were averaged over k = 6,7,8 amino acids for (a) HLA-I, and (b) HLA-II. Pathogen relevance score for each pathogen and k are presented in Supplementary Figs. 1 and 2.
Figure 3
Figure 3
OC43 and HKU1 epitopes can be presented on many HLAs. Epitopes were predicted using netMHCpan and netMHCIIpan in selected pathogens. The similarity between each SARS-CoV-2 epitope and pathogen epitope was calculated using the edit distance, and the number of shortest matches was enumerated. (a) Total number of HLA-I epitopes with a edit distance between 0 and 3. (b) Total number of HLA-II epitopes with a edit distance between 0 and 3. The pathogens are ordered per plot from highest to lowest, while the fill color is preserved.
Figure 4
Figure 4
SARS-CoV-2 epitopes from conserved regions are nearly identical to OC43 and HKU1 epitopes. (a) Upper panel: Protein sequence for the polyprotein pp1ab from SARS-CoV-2, OC43, and HKU1 were aligned and the similarity between OC43 and HKU1 amino acids to SARS-CoV-2 was calculated. The individual proteins are marked above the similarity graph. Lower panel: The number of HLA-alleles that present SARS-CoV-2 pp1ab epitopes with a edit distance of 1 or less to epitopes predicted in both OC43 and HKU1. Two epitopes previously identified as cross reactive are marked by ‘M’. (b) Upper panel: Protein sequence for the S-protein from SARS-CoV-2, OC43, and HKU1 were aligned and the similarity between OC43 and HKU1 amino acids to SARS-CoV-2 was calculated. The individual proteins are marked above the similarity graph, where RBD gives the receptor binding domain. Lower panel: The number of HLA-alleles presenting SARS-CoV-2 S-protein epitopes with an edit distance of 3 or less to epitopes predicted in both OC43 and HKU1. (c) Upper panel: Protein sequence for the M-protein from SARS-CoV-2, OC43, and HKU1 were aligned and the similarity between OC43 and HKU1 amino acids to SARS-CoV-2 was calculated. The individual proteins are marked above the similarity graph: ‘VS’ indicates the portion of the M-protein on the virion surface, ‘Tr’ the transmembrane region, and ‘IV’ the intraviron portion. Lower panel: The number of HLA-alleles presenting SARS-CoV-2 M-protein epitopes with an edit distance of 3 or less to epitopes predicted in both OC43 and HKU1. (d) Upper panel: Protein sequence for the N-protein from SARS-CoV-2, OC43, and HKU1 were aligned and the similarity between OC43 and HKU1 amino acids to SARS-CoV-2 was calculated. The individual domains of the N-protein are marked above the similarity graph. Lower panel: The number of HLA-alleles presenting SARS-CoV-2 N-protein epitopes with an edit distance of 3 or less to epitopes predicted in both OC43 and HKU1. The height and color of the similarity graphs designate similarity such that white bars indicate no similarity, light blue bars with half height indicate 50% similarity and dark blue bars with full height indicate 100% similarity. The width of the bar in the lower panels indicates the length of the epitopes. Darker regions indicate overlapping epitopes.

References

    1. Huang C, et al. Clinical features of patients infected with 2019 novel coronavirus in Wuhan, China. Lancet. 2020;395:497–506. doi: 10.1016/S0140-6736(20)30183-5. - DOI - PMC - PubMed
    1. Guan W, et al. Clinical characteristics of Coronavirus disease 2019 in China. N. Engl. J. Med. 2020;382:1708–1720. doi: 10.1056/NEJMoa2002032. - DOI - PMC - PubMed
    1. Chen G, et al. Clinical and immunological features of severe and moderate coronavirus disease 2019. J. Clin. Invest. 2020;130:2620–2629. doi: 10.1172/JCI137244. - DOI - PMC - PubMed
    1. Giamarellos-Bourboulis EJ, et al. Complex immune dysregulation in COVID-19 patients with severe respiratory failure. Cell Host. Microbe. 2020;27:992–1000.e3. doi: 10.1016/j.chom.2020.04.009. - DOI - PMC - PubMed
    1. Mehta P, et al. COVID-19: consider cytokine storm syndromes and immunosuppression. Lancet. 2020;395:1033–1034. doi: 10.1016/S0140-6736(20)30628-0. - DOI - PMC - PubMed

Publication types