. 2020 Nov 4;10(1):19055.
doi: 10.1038/s41598-020-76118-x.

Inhibition of red blood cell development by arsenic-induced disruption of GATA-1

Affiliations

Inhibition of red blood cell development by arsenic-induced disruption of GATA-1

Xixi Zhou et al. Sci Rep. .

Abstract

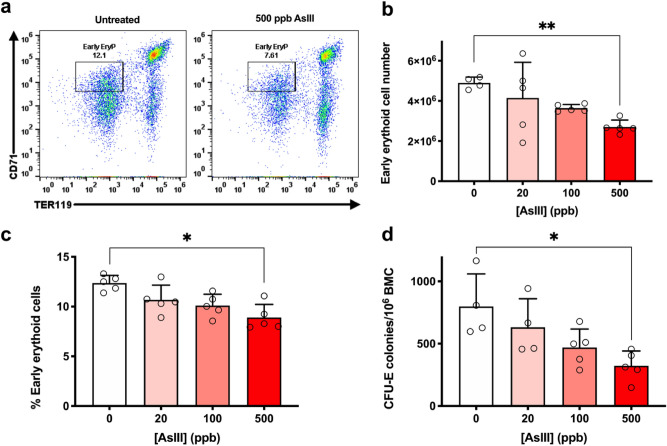
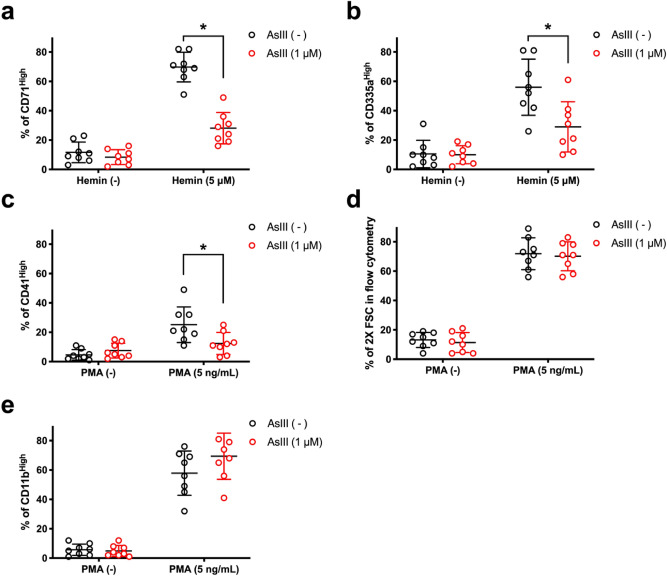
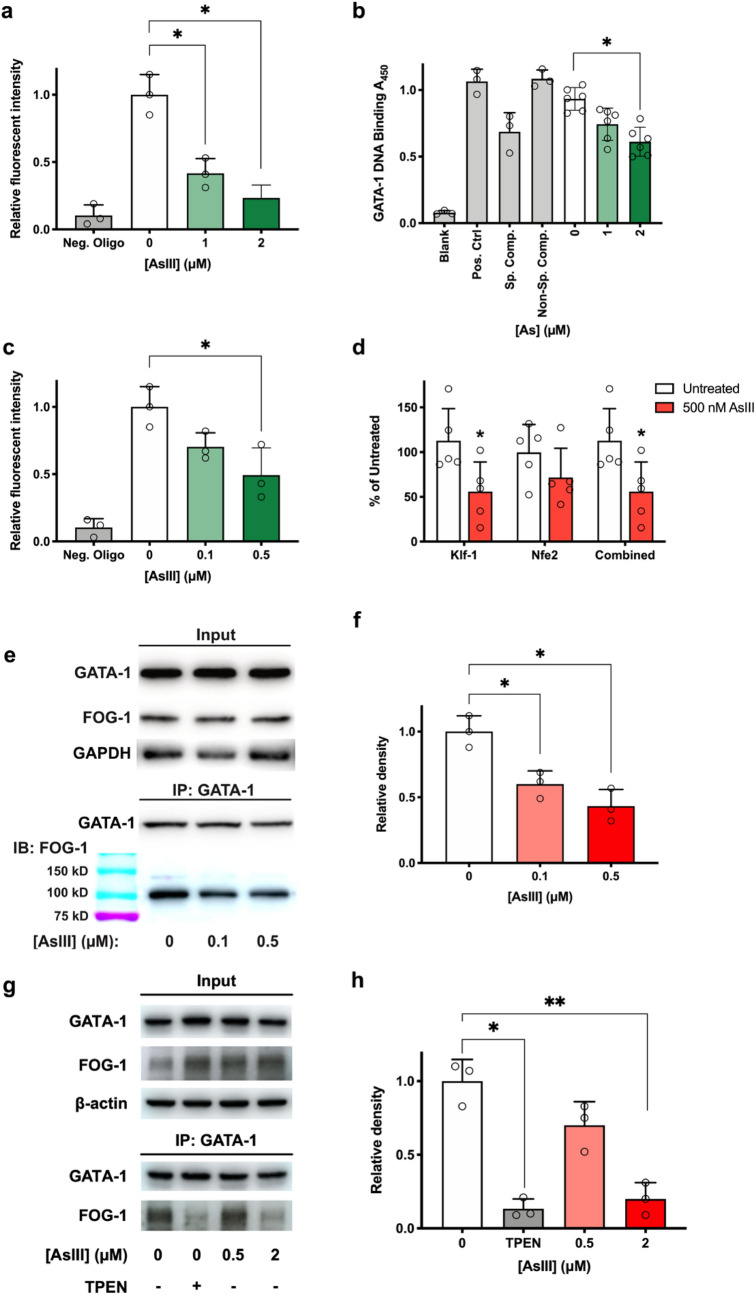
Anemia is a hematological disorder that adversely affects the health of millions of people worldwide. Although many variables influence the development and exacerbation of anemia, one major contributing factor is the impairment of erythropoiesis. Normal erythropoiesis is highly regulated by the zinc finger transcription factor GATA-1. Disruption of the zinc finger motifs in GATA-1, such as produced by germline mutations, compromises the function of this critical transcription factor and causes dyserythropoietic anemia. Herein, we utilize a combination of in vitro and in vivo studies to provide evidence that arsenic, a widespread environmental toxicant, inhibits erythropoiesis likely through replacing zinc within the zinc fingers of the critical transcription factor GATA-1. We found that arsenic interacts with the N- and C-terminal zinc finger motifs of GATA-1, causing zinc loss and inhibition of DNA and protein binding activities, leading to dyserythropoiesis and an imbalance of hematopoietic differentiation. For the first time, we show that exposures to a prevalent environmental contaminant compromises the function of a key regulatory factor in erythropoiesis, producing effects functionally similar to inherited GATA-1 mutations. These findings highlight a novel molecular mechanism by which arsenic exposure may cause anemia and provide critical insights into potential prevention and intervention for arsenic-related anemias.


Conflict of interest statement

The authors declare no competing interests.

Figures

Figure 1
Figure 1
Inhibition of bone marrow erythropoiesis in vivo by AsIII exposure. Male C57BL/6 J mice were exposed to 0, 20, 100, and 500 ppb AsIII (0, 0.3, 1.3, and 6.7 µM, respectively) in drinking water for 30 days. Bone marrow cells were isolated from the femurs of each mouse and utilized for flow cytometry and CFU-E colony forming assays. (a) Representative flow cytometry dot plot depicting effects of 0 and 500 ppb AsIII on early erythroid progenitor cells (EryP; CD71+, Ter119; late BFU-E and CFU-E) defined by CD71 and TER119 surface marker expression. (b) Total numbers or (c) percentages of early erythroid progenitor cells measured by CD71 and TER119 surface marker expression using flow cytometry. (d) Inhibition of CFU-E colony formation (shown as number of colonies/106 bone marrow cells). Data are expressed as mean ± SD, n = 5 mice/group, *p < 0.05, ** p < 0.001 in one-way ANOVA, followed by Tukey’s post hoc test compared to no treatment group.
Figure 2
Figure 2
AsIII suppresses erythropoiesis, not myelopoiesis, of primary mouse bone marrow hematopoietic progenitor cells (HPC). Primary mouse bone marrow HPC were stimulated with erythropoietin and stem cell factor to induce erythroid differentiation in the presence of 0, 0.1, or 0.5 AsIII for 24 h. (a) Representative flow cytometry plot depicting effects of 0 and 0.5 μM AsIII on erythro-megakaryocytic and myeloid progenitor cell subsets. (b) Total numbers of surface marker defined erythro-megakaryocytic progenitors: CMP (Lin, cKit+, SCA-1, CD16/32, CD34+); PreMegE (Lin, cKit+, SCA-1, CD16/32, CD150+, CD105−, low); MEP (Lin-, cKit+, SCA-1, CD16/32, CD34), BFU-E (Lin, cKit+, SCA-1, CD16/32, CD150+, CD105+), CFU-E (Lin, cKit+, SCA-1, CD16/32, CD150, CD105+), and (c) myeloid progenitors: Pre-GM (Lin, cKit+, SCA-1, CD16/32, CD150, CD105); GMP (Lin, cKit+, SCA-1, CD16/32+, CD150-) after 24 h exposure to AsIII. Total numbers of later-stage erythroblast subsets after 24, 48, and 72 h exposure to 0, 0.1, or 0.5 μM AsIII (d) early erythroblasts, CD71low/high, Ter119−,low, (e) basophilic (EryA), CD71highTer119highFSChigh, (f) late basophilic and polychromatic (EryB), CD71highTer119highFSClow, (g) orthochromatic (EryC), CD71lowTer119highFSClow). Data are expressed as mean ± SD, n = 3, *p < 0.05, ** p < 0.001 in one-way ANOVA, followed by Tukey’s post hoc test compared to no treatment group.
Figure 3
Figure 3
AsIII disrupts erythroid and megakaryocytic differentiation, not monocyte or myeloid differentiation of K562 cells. Human K562 erythroleukemia cells were treated with 1 μM AsIII for 48 h. Erythroid, megakaryocyte, monocyte, and myeloid differentiation was induced with hemin or PMA for 24 h, respectively. Percentages of erythroid differentiated K562 cells as indicated by (a) CD71+ or (b) CD235a+. (c) PMA-induced megakaryocyte differentiation of K562 cells (CD41high). (d) PMA-induced monocyte (CD11b+ and 2X forward scatter) and (e) myeloid differentiation CD11bhigh. Data are expressed as mean ± SD, n = 3, *p < 0.05 in two-tailed Student’s t-test compared to no treatment group.
Figure 4
Figure 4
AsIII impairs GATA-1 DNA binding and FOG-1 interaction activities. K562 cells were treated with 0, 1 or 2 µM AsIII for 48 h (a,b,g), and primary mouse bone marrow erythroid cells were treated with 0, 0.1 or 0.5 μM AsIII for 24 h (c,d,e). (a) GATA-1 DNA binding measured with an ELISA Protein-DNA Binding Assay Kit in K562 cells. (b) GATA-1 DNA binding activity determined by colorimetric Human GATA-1 Transcription Factor Activity Assay in K562 cells. (c) GATA-1 DNA binding measured with ELISA Kit in primary bone marrow erythroid cells. (d) GATA-1 DNA binding activity analyzed by chromatin immunoprecipitation coupled with qPCR of two GATA-1 regulated genes, Klf-1 and Nfe2 (or the combination of both sites). Data are expressed as percentage of untreated control and were derived from the fold enrichment of GATA-1 binding at each site over negative control primers. (e) GATA-1 and FOG-1 were co-immunoprecipitated using GATA-1 antibody after AsIII exposure in primary mouse bone marrow erythroid cells. Western blotting of FOG-1 interaction with GATA-1. (f) Densitometry of FOG-1 western blotting in primary mouse bone marrow erythroid cells. (g) Western-blotting analysis of GATA-1 and FOG-1 binding in K562 cells using co-immunoprecipitation. TPEN is a zinc chelator. (h) Densitometry of FOG-1 western blotting in K562 cells. Data are expressed as mean ± SD; n = 3 for panels a, c, f, and h; n = 6 for panel b; for panel d, n = 5–6 (Klf-1 and Nfe2) or n = 10–11 (combined). Panels a–c,f,h: *p < 0.05, **p < 0.01 in one-way ANOVA, followed by Tukey’s post hoc test compared to no treatment group. Panel d: *p < 0.05 in two-tailed Student’s t-test compared to no treatment group.
Figure 5
Figure 5
AsIII binds to GATA-1 causing zinc loss but does not bind to PU.1. GATA-1 and PU.1 were immunoprecipitated and zinc/arsenic contents were analyzed by ICP-MS. (a) Zinc content in GATA-1 from K562 cells treated with 0, 1 or 2 μM AsIII for 48 h. (b) Arsenic bound to GATA-1 protein in AsIII treated K562 cells. (c) Zinc and (d) arsenic content in PU.1 collected from AsIII treated K562 cells. (e) Zinc content in GATA-1 from primary mouse bone marrow erythroid cells after 24 h exposure to 0, 0.1 or 0.5 μM AsIII. (f) Arsenic bound to GATA-1 from primary mouse bone marrow erythroid cells. (g) Zinc and (h) arsenic content in PU.1 from primary mouse bone marrow erythroid cells. Data are expressed as mean ± SD, n = 3, *p < 0.05 in one-way ANOVA, followed by Tukey’s post hoc test compared to no treatment group.
Figure 6
Figure 6
AsIII disrupts GATA-1 zinc finger in vivo. Male C57BL/6J mice were exposed to 500 and 1000 ppb AsIII (6.7 and 13.3 µM) in drinking water for 2 weeks. (a) Zinc content and (b) arsenic content were measured in GATA-1 immunoprecipitated from bone marrow cells by ICP-MS. Data are expressed as mean ± SD, n = 6 mice/group, *p < 0.05 in one-way ANOVA, followed by Tukey’s post hoc test compared to no treatment group.
Figure 7
Figure 7
AsIII inhibits erythropoiesis, but not myelopoiesis through interactions with the zinc finger transcription factor, GATA-1. AsIII interacts with the zinc finger motifs (C4) of GATA-1 causing zinc loss and inhibition of DNA and protein binding activities. However, AsIII does not interact with PU.1, a non-zinc finger transcription factor important for myeloid differentiation. The selective effect of AsIII on GATA-1 versus PU.1, results in dyserythropoiesis and produces a shift in the differentiation fate of hematopoietic progenitor cells from erythropoiesis in favor of myelopoiesis.

References

    1. Kassebaum NJ, GBD Collaborators Anemia. The global burden of anemia. Hematol. Oncol. Clin. N. Am. 2016;30:247–308. doi: 10.1016/j.hoc.2015.11.002. - DOI - PubMed
    1. Kassebaum NJ, et al. A systematic analysis of global anemia burden from 1990 to 2010. Blood. 2014;123:615–624. doi: 10.1182/blood-2013-06-508325. - DOI - PMC - PubMed
    1. Organization, World Health. The Global Prevalence of Anaemia in 2011.www.who.int/nutrition/publications/micronutrients/global_prevalence_anae... (2015). Accessed 17 Dec 2019.
    1. Gangat N, Wolanskyj AP. Anemia of chronic disease. Semin. Hematol. 2013;50:232–238. doi: 10.1053/j.seminhematol.2013.06.006. - DOI - PubMed
    1. Hodges VM, Rainey S, Lappin TR, Maxwell AP. Pathophysiology of anemia and erythrocytosis. Crit. Rev. Oncol. Hematol. 2007;64:139–158. doi: 10.1016/j.critrevonc.2007.06.006. - DOI - PubMed

Publication types