. 2021 Jan;589(7840):88-95.
doi: 10.1038/s41586-020-2879-3. Epub 2020 Nov 4.

Neuronal diversity and convergence in a visual system developmental atlas

Affiliations

Neuronal diversity and convergence in a visual system developmental atlas

Mehmet Neset Özel et al. Nature. 2021 Jan.

Abstract

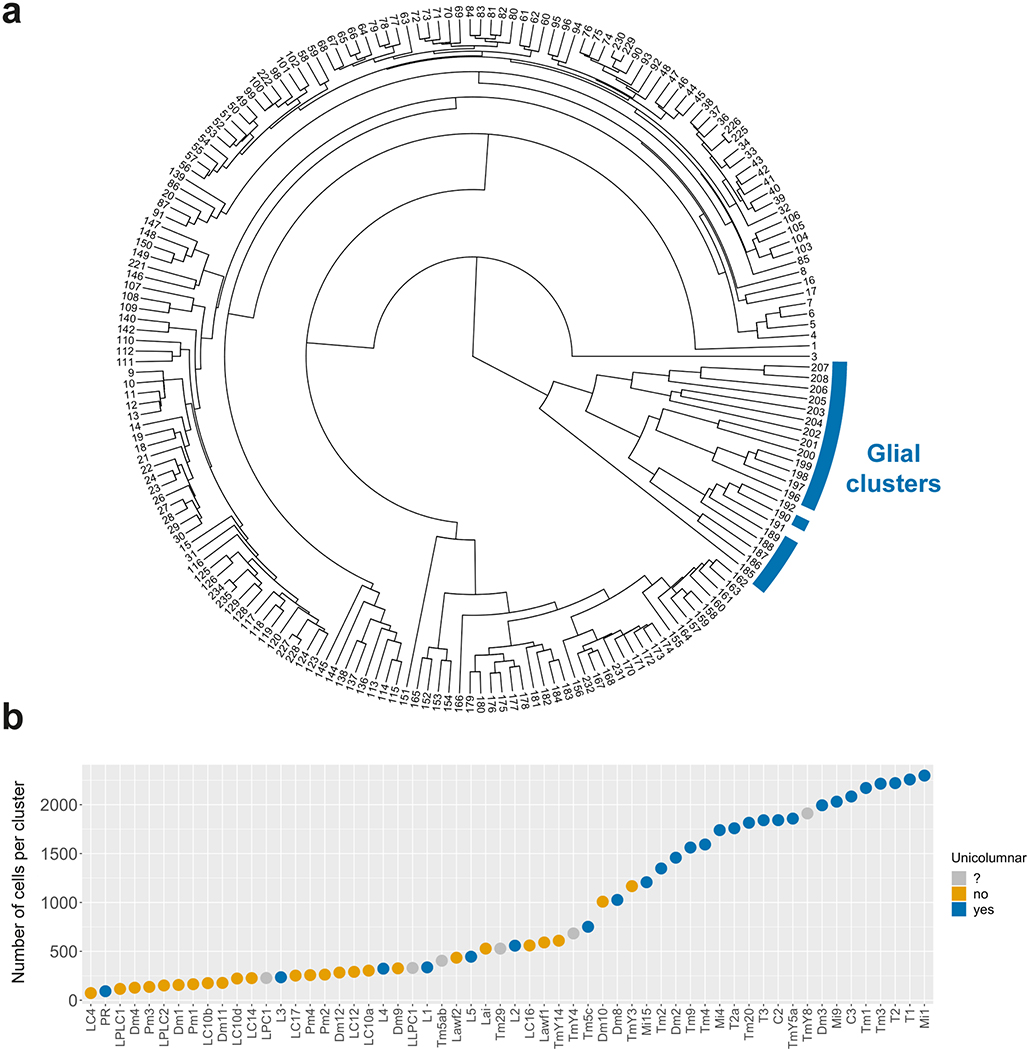
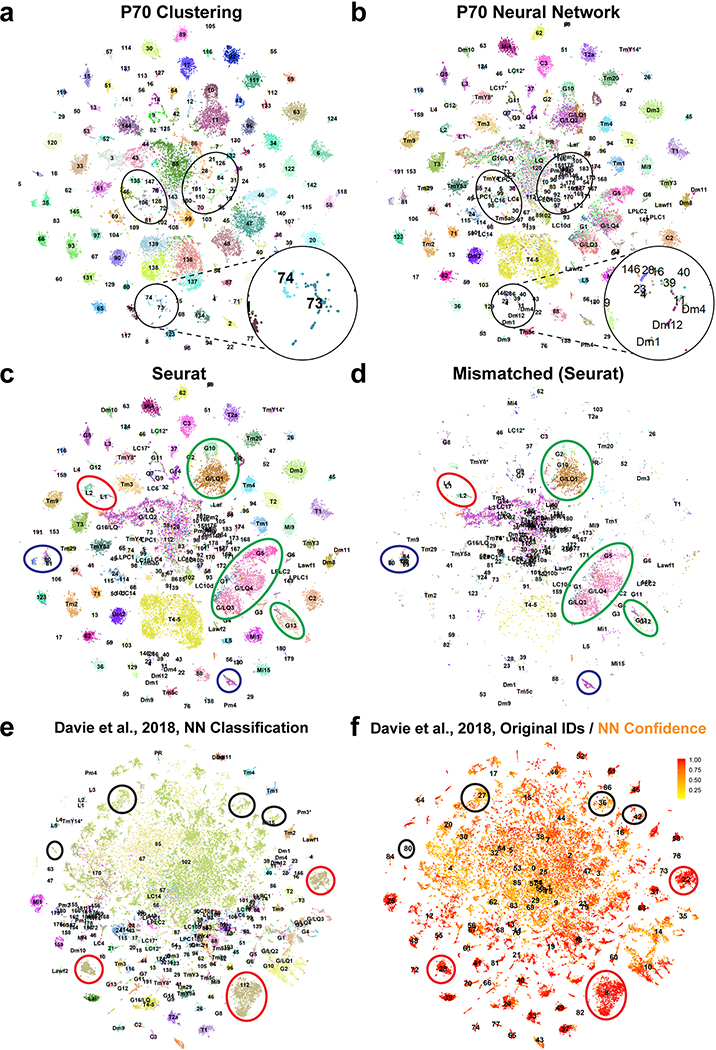
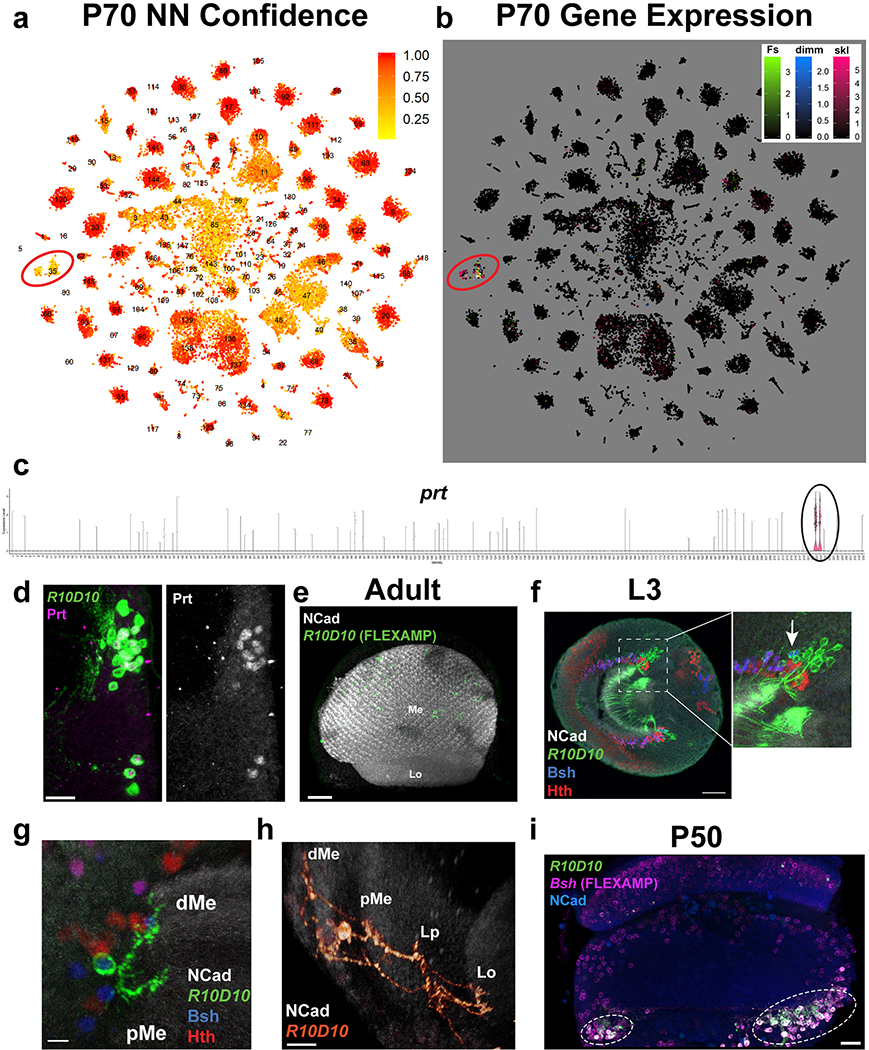
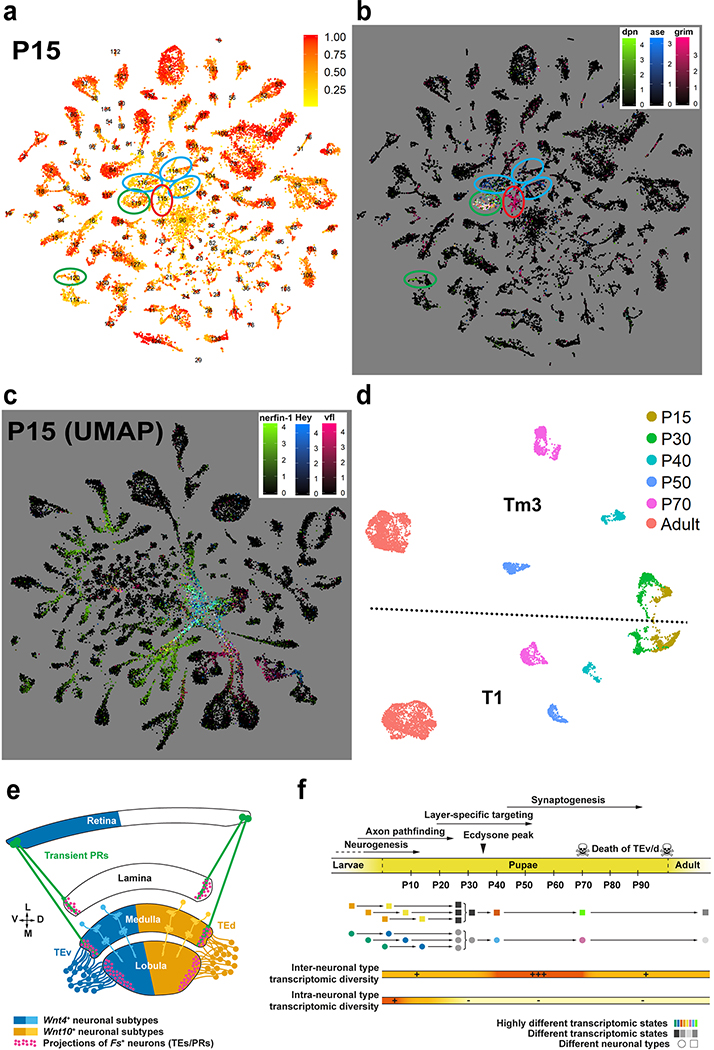
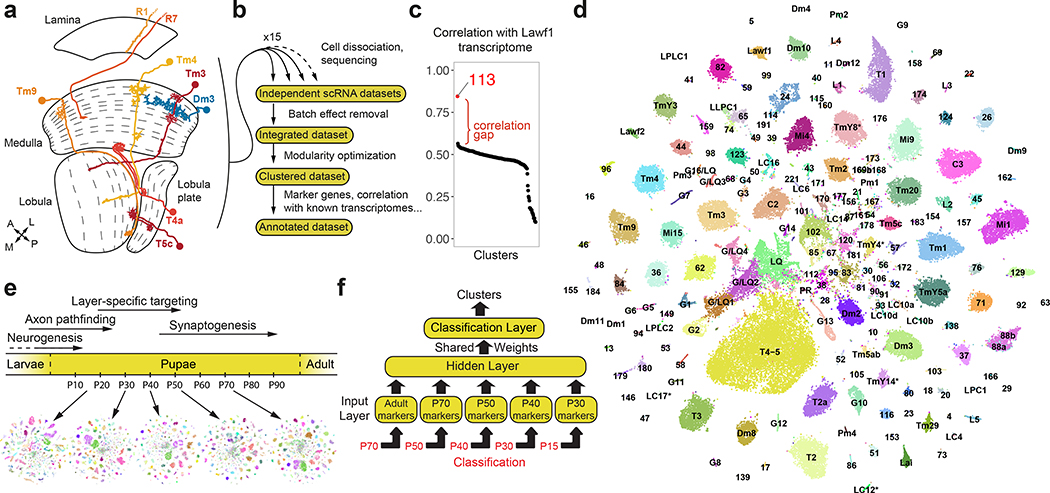
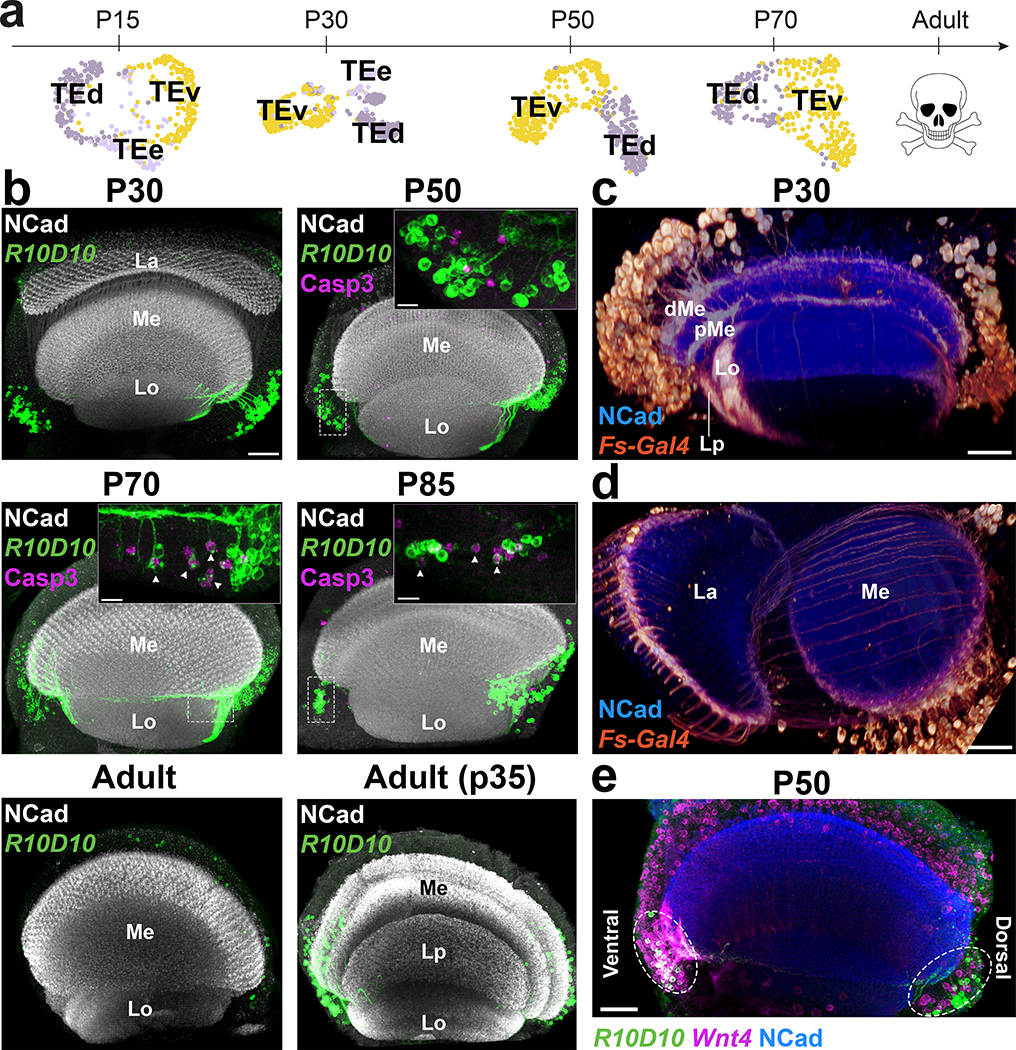
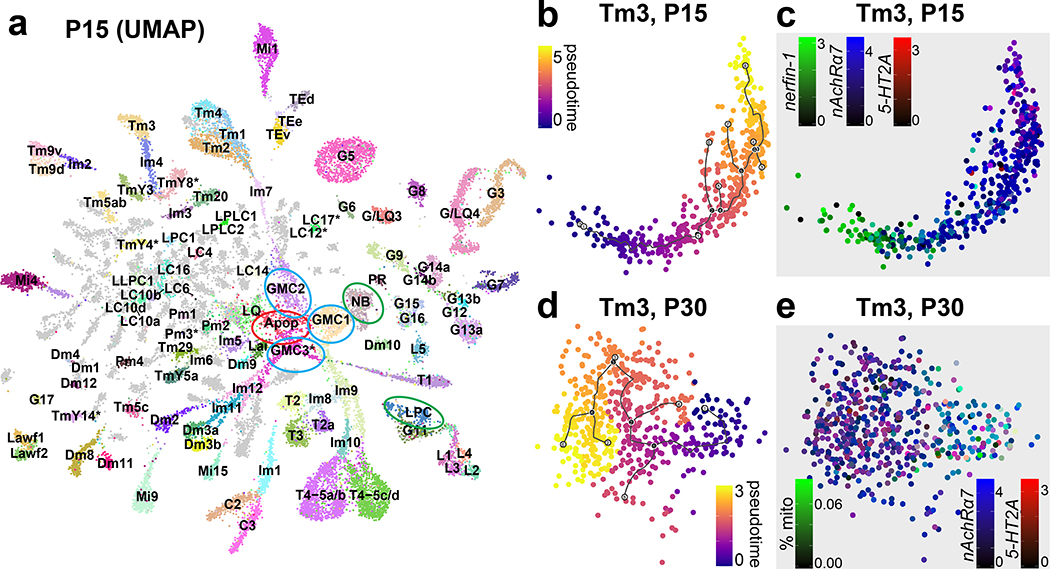
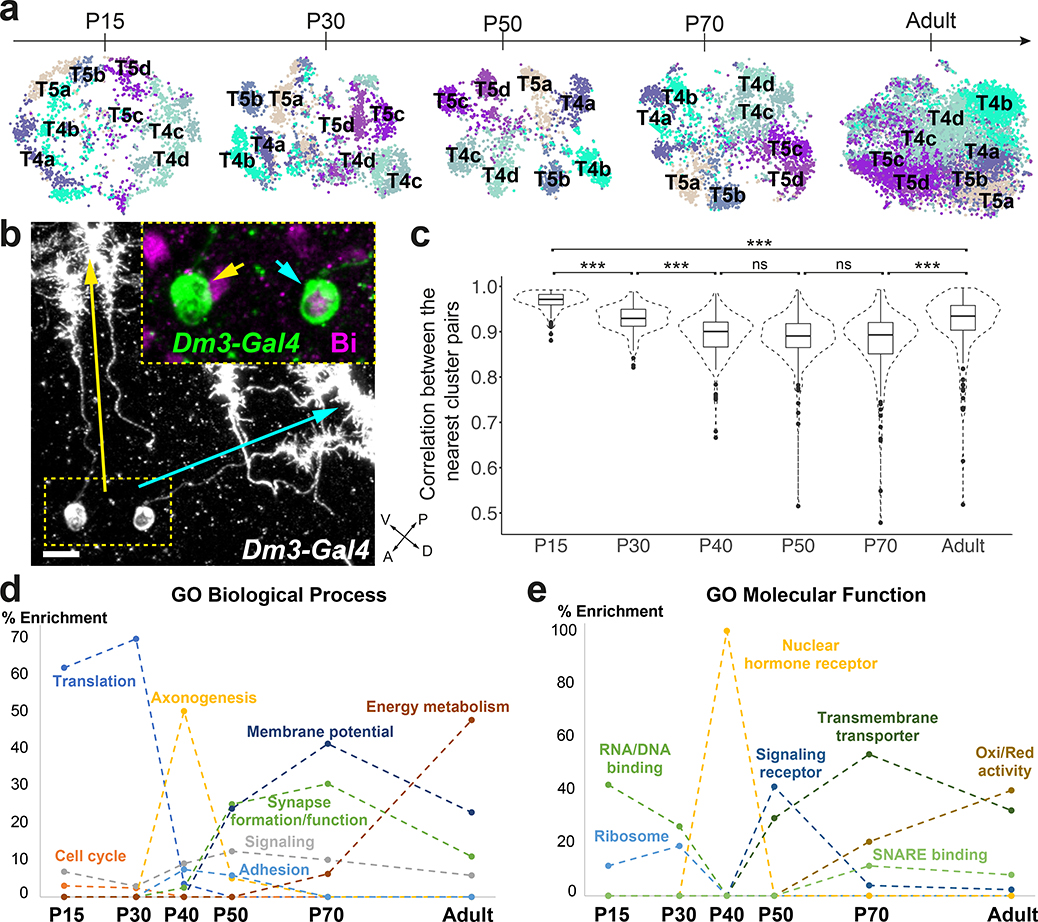
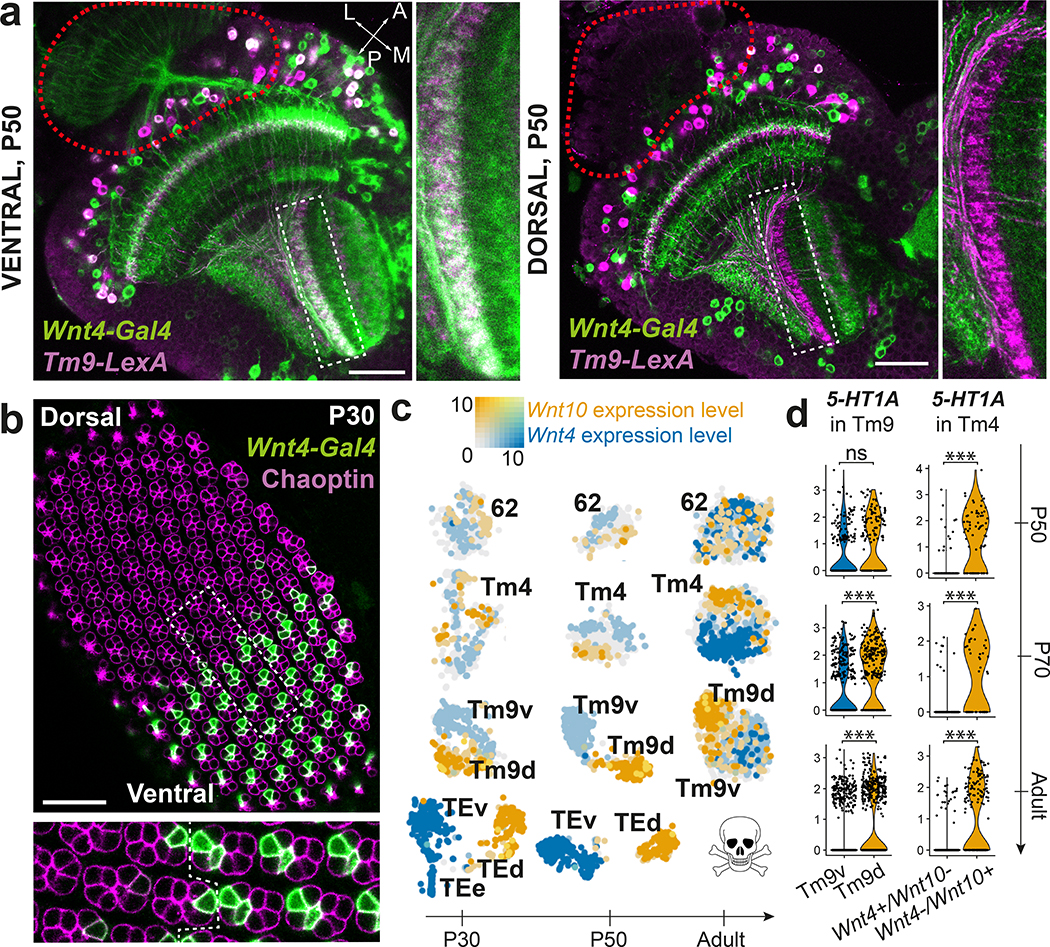
Deciphering how neuronal diversity is established and maintained requires a detailed knowledge of neuronal gene expression throughout development. In contrast to mammalian brains1,2, the large neuronal diversity of the Drosophila optic lobe3 and its connectome4-6 are almost completely characterized. However, a molecular characterization of this neuronal diversity, particularly during development, has been lacking. Here we present insights into brain development through a nearly complete description of the transcriptomic diversity of the optic lobes of Drosophila. We acquired the transcriptome of 275,000 single cells at adult and at five pupal stages, and built a machine-learning framework to assign them to almost 200 cell types at all time points during development. We discovered two large neuronal populations that wrap neuropils during development but die just before adulthood, as well as neuronal subtypes that partition dorsal and ventral visual circuits by differential Wnt signalling throughout development. Moreover, we show that the transcriptomes of neurons that are of the same type but are produced days apart become synchronized shortly after their production. During synaptogenesis we also resolved neuronal subtypes that, although differing greatly in morphology and connectivity, converge to indistinguishable transcriptomic profiles in adults. Our datasets almost completely account for the known neuronal diversity of the Drosophila optic lobes, and serve as a paradigm to understand brain development across species.


Conflict of interest statement

Declaration of Interests

Authors declare no conflicts of interest.

Figures

Extended Data Figure 1:
Extended Data Figure 1:. Batch effect removal and biological significance of the adult clusters
a. The proportions of UMIs from mitochondrial genes per cell (n = number of cells in each library, indicated on the right) and the total number of cells passing filters in each of the 15 libraries comprising the adult dataset. Names indicated correspond to the names in the Seurat object provided (Adult.rds, GSE142787). Boxplots display the first, second and third quartiles. Whiskers extend from the box to the highest or lowest values in the 1.5 inter-quartile range, and outlying datapoints are represented by a dot. b, Origin of the cells in the final adult clusters, colored as in (a). Green arrows: clusters whose unique library distribution can be explained by variable contamination from surrounding tissues (cluster 3 is photoreceptors, 112 is likely Kenyon Cells from the central brain) or the number of lamina neuropils dissociated (clusters 107, 108, 109 are lamina neurons). Red arrows: clusters likely enriched in low quality transcriptomes, as they are enriched in cells from libraries with high number of mitochondrial genes (38, 120, 192) or high number of cells sequenced (102, likely corresponding to multiplets). Brackets: Glial clusters, some of them enriched in libraries with high number of mitochondrial genes as ambient RNA is more similar to RNA from glial vs. neuronal cells (Extended Data Fig.2). c, Number of clusters obtained with different pairs of clustering parameters. Red rectangle: pair of parameters used. d, Left: Legend as in Fig.1C. Right: Number of isolated neuronal type transcriptomes matching to 1–5 of our adult clusters, for each pair of parameters in (c), which we used as a measure of the biological relevance of our clusters. Matching was defined by the presence of a correlation gap above 0.05 (Methods). We took into account any correlation gap between the 6 best correlated clusters, since similar cell types or overclustering can affect the size of the first correlation gap as illustrated on the left graphs. Red rectangle: pair of parameters used. e, tSNE visualization of the adult optic lobe single-cell transcriptomes, using 120 principal components calculated on the log-normalized integrated gene expression. Cell colors indicate the cluster they belonged to before we merged artificially split clusters (red circles, Methods). f, Heatmap showing scaled log-normalized non-integrated expression of the top20 cluster markers between the merged clusters. Merged clusters had almost indistinguishable gene expression patterns, but often differed by their proportions of UMI from mitochondrial genes per cell or the expression levels of the genes highlighted in red, which are enriched in the “ambient RNA cluster” 192 (see also Extended Data Fig.3).
Extended Data Figure 2:
Extended Data Figure 2:. Identification of neuronal and glial clusters.
a, Pearson correlation between the average log-normalized non-integrated expression of the top10 cluster markers of the adult dataset clusters (x-axis) and the transcriptome of isolated Repo+ (glial marker) or Elav+ (neuronal marker) populations. LQ = clusters containing a proportion of cells with features of lower quality transcriptomes. b, Violin plots of features tending to be higher (proportions of UMI from mitochondrial genes) or lower (number of UMIs or genes per cell) in low quality cells ,. c, Heatmap showing the scaled log-normalized non-integrated expression of the top5 cluster markers of the adult dataset. The first 5 neuronal adult clusters (1 to 6, cluster 1 and 2 having been merged) are plotted for reference as they clearly have specific gene expression patterns. Clusters 38, 85, 102 and 120 present much less defined gene expression patterns and likely contain low quality neuronal transcriptomes (see also Extended Data Fig.1). Clusters 188 and 189 could be further separated in two groups with different gene expression patterns, as illustrated by the dashed line in the insert. Cluster 191 expresses several markers found in no other clusters and likely correspond to neither glia nor optic-lobe neuron. Cluster 192 expresses mainly low levels of glia-specific genes, without specific markers. It likely corresponds to ambient RNA, which would be enriched in RNA from burst glial cells.
Extended Data Figure 3:
Extended Data Figure 3:. Identification of the adult neuronal clusters.
a, Pearson correlation between the average log-normalized non-integrated expression of the top10 cluster markers of the adult dataset clusters (x-axis) and the transcriptome of isolated neurons,. We represented Dm3, Tm9, T4 and T5 before their split into Dm3a/b, Tm9v/d, T4/T5ab and T4/T5cd. When two transcriptomes were published for a given neuronal type, the one presenting the highest correlation gap is displayed in this figure. R1–8: average gene expression of all photoreceptors. KC: Kenyon Cells, cluster 112 therefore likely corresponds to contamination from the central brain. b, Legend as in (a). We indicated several matching clusters to highlight the high similarity between LC cells transcriptomes, which explains the lower correlation gaps observed for these neurons. c, Left: Legend as in (a). Right: mixture modelling of Pm3 markers (y axis). Clusters are spread on the x-axis, with the probability of expression of the markers figured by the size of the black dots.
Extended Data Figure 4:
Extended Data Figure 4:. Marker gene expressions in TmY4, TmY8, TmY14, LC12 and LC17 neurons.
a, Expression pattern of TmY4-LexA (green) in the adult optic lobe (n=7 brains) with anti-NCad immunostaining (white). The LexA line shows weak or no expression in the most anterior medulla region. b-d, Expression pattern of TmY4-LexA (green) in the adult optic lobe with anti-Dichaete (D) (b), anti-Vvl (c) and anti-Toy (d) immunostainings (magenta), n=15 neurons for each. TmY4 cell bodies express Dichaete but not Vvl or Toy. e, Sparse labeling of cell types (anti-FLAG, green) expressing CG42548 in the adult optic lobe using MCFO and immunostained with anti-Brp (white) and anti-Vvl (magenta). A TmY8 neuron (n=4 neurons) is labeled (arborized layers shown by arrows) and expresses Vvl. Adult flies were heat-shocked for 5 minutes and dissected after 6 days. f-h, Expression pattern of R24F10-Gal4 (green) in late L3 optic lobes with anti-NCad (white, f), anti-Dac (magenta, f), anti-Dichaete (magenta, g) and anti-Toy (magenta, h) immunostainings, n=15 neurons for each. R24F10-Gal4 is expressed in TmY14 neurons during larval stage (unpublished data). TmY14 neurons express Toy (h) but not Dac or D (f-g). i, Expression pattern of LC12-Gal4 (green) in the adult optic lobe (n=7 brains) with anti-NCad immunostaining (magenta) showing processes in lobula layers 2–4, and a projection to an optic glomerulus in the posterior ventrolateral protocerebrum (PVLP) of the central brain (white outline). The cell bodies of LC12 are located in the lateral cell body rind, the region separating the optic lobe and central brain. j, Expression pattern of beat-Ic (green) in the adult optic lobe (n=6 brains) with anti-NCad immunostaining (magenta) showing a strong expression profile in the optic glomerulus corresponding to LC12 in the PVLP (white outline). k-m. Expression pattern of LC12-Gal4 (green) in the adult optic lobes with anti-Cut (k, magenta-top panel, grey-bottom panel), anti-Acj6 (l, magenta-top panel, grey-bottom panel), and anti-Toy (m, magenta-top panel, grey-bottom panel) immunostainings, n=77 neurons. All LC12 cells bodies are cut+, Acj6+ and toy+. Red line delineates LC12 cell body location. n, Expression pattern of LC17-Gal4 (green) in the adult optic lobe (n=5 brains) with anti-NCad immunostaining (magenta) showing processes in lobula layers 2–5. LC17 project to the PVLP optic glomerulus (white outline) adjacent to that of LC12 (asterisk, see also i). o, Expression pattern of Kn-Gal4 (green) in the adult optic lobe (n=3 brains) with anti-NCad immunostaining (magenta) showing a strong expression profile in the optic glomerulus corresponding to LC17 in the PVLP (white outline). Note its absence from LC12 neurons (asterisk). p-q, Expression pattern of LC17-Gal4 (green) in the adult optic lobes with anti-Acj6 (p, magenta-top panel, grey-bottom panel) and anti-Toy (q, magenta-top panel, grey-bottom panel) immunostainings, n=62 neurons. All LC17 cells bodies are Acj6+ and toy+. Red line delineates LC17 cell body location (p-q). Me, medulla; Lo, lobula; LoP, lobula plate. Scale bars correspond to 25 μm in a-i, j, n, o and to 15 μm in k-m and p-q.
Extended Data Figure 5:
Extended Data Figure 5:. Overview of the final adult clusters.
a, Hierarchical clustering tree of our adult clusters, based on the average log-normalized non-integrated expression of the 2,000 most variable genes of the dataset (the genes used to define the unsupervised clusters, Methods). Indicated in blue are the glial clusters. b, Number of cells in our identified neuronal clusters, excluding the T4/T5 cluster that contains 10,780 cells, with unicolumnar neurons in blue and multicolumnar neurons in orange. Importantly, photoreceptors (PR) and lamina neurons L1-L5 clusters contain fewer cells, as these neuronal types were not included in equal proportions in all libraries. As the number of cells per optic lobe for a given neuronal type is rarely formally counted, unicolumnar vs. multicolumnar character is based both on general knowledge and the following references,,,.
Extended Data Figure 6:
Extended Data Figure 6:. Benchmarking of the neural network (NN) classifier.
a-b, tSNE visualization of the P70 optic lobe single-cell transcriptomes, using 120 principal components calculated on the log-normalized integrated gene expression. Cells colors indicate the clusters they belonged to according to unsupervised clustering (a), or the adult clusters they were classified as by the neural network (b, same as in Fig.1e). Black circles indicate high granularity regions, where less frequent cell types were grouped together by unsupervised clustering but could be resolved accurately by the neural network (b). c, Same as in (a-b) but cells are named and colored by the adult cluster they were classified as by Seurat label transfer (Methods). d, tSNE visualizations (same as c) including only the cells that were assigned inconsistent identities by Seurat and the neural network. Highest rates of inconsistencies were observed in the center (LQ cells), in L1 and L2 clusters (red ellipses), in most glia clusters (green ellipses), the TE neurons and a glia-like cluster (identity 214, Suppl. Table 1) with no adult correspondence (blue ellipses). e-f, tSNE visualizations of 56,902 cells sequenced from whole fly brains, using 120 principal components calculated on the log-normalized gene expression. e, Cells are named and colored by the clusters they were classified as by our neural network. f, Cells are named by the cluster identities from the original study and colored by the confidence score they received from our neural network. Black circles mark the following central brain clusters (from left to right): Poxn, OPN, clock neurons and dopaminergic neurons, that all received low scores from the neural network. Kenyon cells (red circles) were assigned with high confidence as our adult dataset was contaminated by them (cluster 112).
Extended Data Figure 7:
Extended Data Figure 7:. High resolution transcriptomic atlases of the optic lobe across development.
tSNE visualizations of all optic lobe single-cell transcriptomes acquired for this study, using 120 principal components calculated on the log-normalized integrated gene expression. The cells are named and colored consistently at all stages by the neural network classifications with manual adjustments as detailed in Methods. Blue ellipses: Dm3 and Tm9 neuronal subtypes, which could only be resolved at P50 and earlier.
Extended Data Figure 8:
Extended Data Figure 8:. Transient Extrinsic neurons.
a-b, tSNE visualization of the P70 optic lobe single-cell transcriptomes, using 120 principal components calculated on the log-normalized integrated gene expression. Cells are named by the unsupervised cluster they were assigned to and colored by (a) the confidence score they received from the neural network (NN) or by (b) the log-normalized non-integrated expression of Fs (green), dimm (blue), and skl (red), which are co-expressed in TE neurons (red ellipses). c, Violin plot of log-normalized non-integrated prt expression in all clusters at P50. TE neuron clusters are indicated by circle. d, R10D10-Gal4 co-expression with anti-Prt staining in a P50 optic lobe (n=15 neurons). Scale bar: 10 μm. e, FLEXAMP memory cassette labeling of R10D10-Gal4 in an adult optic lobe (n=28 brains) with anti-NCad staining. Scale bar: 30 μm. f, R10D10-Gal4 expression pattern in L3 optic lobe (n=15 brains), with anti-NCad, anti-Bsh and anti-Hth staining. Arrow: Bsh+, Hth- neurons labeled by R10D10-Gal4. Scale bar: 30 μm. g-h, R10D10-Gal4 sparse expression at P30 (n=40 neurons), with anti-NCad, anti-Bsh and anti-Hth staining. Scale bars = 5 μm (g) and 15 μm (h). d/pMe: distal/proximal Medulla, Lo: Lobula, Lp: Lobula plate. I, Co-labeling of R10D10-LexA expression and bsh-Gal4 FLEXAMP memory cassette with anti-nCad staining in a P50 optic lobe (n=13 brains). Dashed ellipses: TE neurons. Scale bar: 20 μm.
Extended Data Figure 9:
Extended Data Figure 9:. Early differentiation and transcriptomic synchronization of optic lobe neurons and summary of the main findings.
a-b, tSNE visualization of the P15 optic lobe single-cell transcriptomes, using 120 principal components calculated on the log-normalized integrated gene expression. Cells are named by the unsupervised cluster they were assigned to and colored by (a) the confidence score they received from the neural network or by (b) the log-normalized non-integrated expression of dpn (green), ase (blue), and grim (red). Circles match to those of Figure 3a. c, UMAP visualization of the P15 optic lobe single-cell transcriptomes, using 120 principal components calculated on the log-normalized integrated gene expression. Cells are colored by the log-normalized non-integrated expression of nerfin-1 (green), Hey (blue), and vfl (red) d, UMAP visualization of Tm3 and T1 cells (above and below the dashed line, respectively) from all stages sequenced in this study, using 25 principal components calculated on the log-normalized non-integrated gene expression. Cells are colored by their developmental stage. e, Ventral and dorsal Transient Extrinsic (TE) neurons as well as transient photoreceptors (PRs) line the edges of all optic lobe neuropils and express Follistatin (Fs). Moreover, TE and at least 3 other neuronal types express Wnt4 in the ventral medulla/lobula but express Wnt10 in the dorsal part of these neuropils. f, The transcriptome of neurons from the same neuronal type but produced days apart converge towards a similar transcriptomic state, which they reach by P30. Moreover, the inter-neuronal type transcriptomic diversity is highest during P40-P70.
Extended Data Figure 10:
Extended Data Figure 10:. Increased transcriptomic diversity during synaptogenesis.
a, Log-normalized and scaled (to the max of 1 for each gene across all time points) expression of top10 (by logFC, calculated at P50) subcluster markers between T4 and T5 subtypes at all stages. TF: Transcription Factor, CSM: Cell Surface Molecule. b-c, GO enrichment analysis of all (269) differentially expressed genes between the T4-T5 subclusters at P50. All Biological Process (b) and Molecular Function (c) terms with greater than 2-fold enrichment were summarized by REVIGO to eliminate redundant terms and group related ones together. Inner rings in the CirGO plots indicate the summarized terms (names in bold). Some individual terms (outer ring) relevant to neuronal function and development are also labeled. Areas within the graphs are determined by the p-values of the terms. d, Average normalized number of presynaptic sites from Dm3 neurons with orthogonally oriented dendritic arbors (Since we could not assign the anatomical directions from the EM data, we plotted them as Dm3x and Dm3y) to indicated neuronal types (Methods). Only the outputs showing differences between the subtypes are plotted. Error bars denote SEM. p-value: 0.004 (Dm3x), 0.006 (Dm3y), 0.04 (Tm28), unpaired parametric two-tailed t-tests (n = 5 and 7 Dm3 cells per type). e, Number of genes differentially expressed between the indicated subtypes with a p-value < 0.01 (two-sided Wilcoxon Rank Sum), calculated after down-sampling the number of cells in each group to 150 for consistency.
Extended Data Figure 11:
Extended Data Figure 11:. GO enrichment analysis of the cluster and stage markers.
GO terms were determined from a, the most differentially expressed genes between neuronal clusters (ranked top20 by logFC for at least one cluster) at all stages separately or b, all genes differentially expressed between stages (Methods) in all neurons (aggregated).. All terms with greater than 2-fold enrichment were summarized by REVIGO to eliminate redundant terms and group related ones together. Inner rings (labeled within the graphs or in bold) indicate the summarized terms. Some individual terms (outer ring, not bold), if non-redundant with the summary terms, are also labeled. Areas within the graphs are determined by the p-values of the terms.
Extended Data Figure 12.
Extended Data Figure 12.. Dorsal and ventral visual circuits are partitioned by differential Wnt signaling.
a, Tm9-Gal4 sparse labeling in the ventral and dorsal part of the same adult optic lobe (n=4 neurons) with anti-NCad immunostaining (gray). b, Expression pattern of Wnt4-Gal4 (green) with anti-Chaoptin immunostaining (magenta) in the adult optic lobe (n=8 brains). c, Expression pattern of Wnt4-Gal4 (green) with anti-Chaoptin (magenta) and anti-Dve (cyan) immunostainings, in the ventral retina at P30 (n=6 eye discs). Chaoptin marks all photoreceptors, and Dve is expressed in the photoreceptors R1–6 and a subset of R7 (yellow R7), but not in R8 and the rest of R7. d, Expression pattern of Tm4-Gal4 (green) with anti-Aop immunostaining (magenta) at P50 (n=3 brains), showing that almost all Aop+ neurons are co-labelled by Tm4-Gal4. Arrow heads: Aop+ neurons not co-labelled by Tm4-Gal4. e, Wnt4-Gal4 expression pattern with anti-Aop staining (Tm4 marker, see d) at P50 (n=6 brains). Aop+ neurons co-express Wnt4-Gal4 in the ventral (white arrows) but not dorsal (white arrowheads) optic lobe. f, fz2, mamo or CG9896 differential expression between either Tm9v and Tm9d cells, TEv and TEd cells, Wnt4+/Wnt10- and Wnt4-/Wnt10+ Tm4 cells or Wnt4+/Wnt10- and Wnt4-/Wnt10+ cluster 62 cells (log-normalized non-integrated expression). Two-sided Wilcoxon Rank Sum test, p-values are indicated on the figure, ns: not significant. Scale bars = 10 μm (a, c) or 30 μm (b, d, e).
Figure 1:
Figure 1:. High resolution transcriptomic atlases of the optic lobe across development.
a, Optic lobe cross-section, with drawings of unicolumnar (orange shades) and multicolumnar (blue) neurons. Dashed lines: boundaries between layers. A: anterior, L: lateral, M: medial, P: posterior. b, Approach followed to produce the adult dataset. c, Pearson correlation between the average gene expression of the adult dataset clusters (x-axis) and the transcriptome of isolated Lawf1 neurons (Methods). d, tSNE visualization of the final adult dataset, using 120 principal components calculated on the log-normalized integrated gene expression. The 61 identified neuronal clusters are labeled by their standard abbreviation, G1–16: glial clusters, LQ: low-quality cells, G/LQ1–4: glial clusters with some features of low-quality cells, *: clusters with less confident annotations (Suppl. Table 1). e, Approximate time frames of different steps of optic lobe development, and tSNE visualizations of the pupal datasets. Colors match to the adult dataset as classified by the neural network. f, Multi-task neural network classifier used at each stage to sequentially match developing cells to the adult clusters, as detailed in Methods.
Figure 2:
Figure 2:. Transient Extrinsic neurons demarcate the optic lobe neuropils and undergo apoptosis during late pupal development.
a, UMAP visualization of TE neurons, using 10 principal components calculated on the log-normalized integrated gene expression, across development. b, R10D10-Gal4 expression pattern (max projection) at the indicated stages (n=10 brains per stage), anterior view (with overexpression of anti-apoptotic protein p35 only in the last panel). Insets show z-restricted sections from the regions marked by dashed white rectangles. Staining of anti-NCad marks neuropils and anti-cleaved Dcp1 reports Caspase-3 (Casp3) activity, marking apoptotic cells. La = Lamina, Lo = Lobula, Me = Medulla, Lp = Lobula plate. c-d, Fs-Gal4 expression pattern (3D reconstruction) in P30 optic lobes (n=4 brains) with anti-NCad staining. d/pMe = distal/proximal Medulla. e, R10D10-LexA and Wnt4-Gal4 co-expression (white) pattern in a P50 optic lobe (max projection), with anti-NCad staining (n=8 brains). Dashed ellipses: TE neurons. Scale bars 7 μm (insets) or 30 μm (others).
Figure 3:
Figure 3:. Transcriptomic synchronization of optic lobe neurons.
a, UMAP visualization of the P15 dataset (parameters as in Fig.1d). Ellipses: undifferentiated neurons undergoing apoptosis (red), stem cells (green), intermediate precursors (blue). b-e, UMAP visualization of the Tm3 cluster at P15 and P30. Cells are colored by their position on the pseudotime trajectory inferred by Monocle 3 (Methods) and shown here as black lines (b, d); or by their log-normalized non-integrated expression level of nerfin-1 (c), nAChRα7, 5-HT2A (c, e), and by the ratio of total mitochondrial transcripts they have (e). Scale bars = 30 μm.
Figure 4:
Figure 4:. Increased transcriptomic diversity during synaptogenesis.
a, tSNE visualizations of T4 and T5 neurons, using 20 principal components calculated on the log-normalized integrated gene expression, across development. b, R25F07(Dm3)-Gal4 sparse expression at P50 with anti-Bi (Omb) staining (n=10 brains). Yellow and cyan arrows/arrowheads indicate dendrites/cells bodies of a posterior-ventrally and a posterior-dorsally oriented Dm3, respectively. Scale bar = 5 μm. c, Plot of the highest Pearson correlation between each neuronal cluster (n=175) and all other neuronal clusters, at each stage, using all genes belonging to the top10 cluster markers of at least one stage. ***: adjusted p-value<0.001 (P15–30: 7X10⁻¹¹, P30–40: 4X10⁻¹⁰, P70-Adult: 1X10⁻¹¹, P15-Adult: 3X10⁻¹³), n.s: non-significant, one-way ANOVA with Tukey Honest Significant Differences. Boxplots display the first, second and third quartiles. Whiskers extend from the box to the highest or lowest values in the 1.5 inter-quartile range, and outlying datapoints are represented by a dot. d-e, Summary of GO enrichment analysis performed on the stage markers (Extended Data Fig.11a).
Figure 5:
Figure 5:. Dorsal and ventral visual circuits are partitioned by differential Wnt signaling.
a, Pattern of Wnt4-Gal4 and Tm9-LexA co-expression (white) at P50 in the ventral and dorsal part of the same optic lobe (n=8 brains). Red dashed line: location of photoreceptors. b, Wnt4-Gal4 expression pattern with anti-Chaoptin staining to mark photoreceptors in a P30 retina (n=6 eye discs). Dashed rectangle: inset. Dashed line within inset: equator of the retina. c, tSNE of the indicated clusters throughout development, with Wnt4 and Wnt10 log-normalized non-integrated expression levels. d, 5-HT1A differential expression between either Wnt4+/Wnt10- and Wnt4-/Wnt10+ Tm4 cells, or Tm9v and Tm9d cells (Methods). ***: adjusted p-value < 0.001 (P70 Tm9: 6×10⁻⁹, Adult Tm9: 3×10⁻¹⁸, P50 Tm4: 1×10⁻⁹, P70 Tm4: 2×10⁻⁷, Adult Tm4: 1×10⁻³⁴), ns: not significant, two-sided Wilcoxon Rank Sum test. Scale bars = 30 μm.

References

    1. Lodato S & Arlotta P Generating Neuronal Diversity in the Mammalian Cerebral Cortex. Annual Review of Cell and Developmental Biology 31, 699–720, doi:10.1146/annurev-cellbio-100814-125353 (2015). - DOI - PMC - PubMed
    1. Cembrowski MS & Spruston N Heterogeneity within classical cell types is the rule: lessons from hippocampal pyramidal neurons. Nature Reviews Neuroscience 20, 193–204, doi:10.1038/s41583-019-0125-5 (2019). - DOI - PubMed
    1. Fischbach KF & Dittrich APM The optic lobe of Drosophila melanogaster. I. A Golgi analysis of wild-type structure. Cell Tissue Res. 258, 441–475, doi:10.1007/BF00218858 (1989). - DOI
    1. Takemura S. y. et al. Synaptic circuits and their variations within different columns in the visual system of Drosophila. Proceedings of the National Academy of Sciences 112, 13711–13716, doi:10.1073/pnas.1509820112 (2015). - DOI - PMC - PubMed
    1. Rivera-Alba M et al. Wiring economy and volume exclusion determine neuronal placement in the Drosophila brain. Curr Biol 21, 2000–2005, doi:10.1016/j.cub.2011.10.022 (2011). - DOI - PMC - PubMed

References (online-only)

    1. Lancichinetti A & Fortunato S Limits of modularity maximization in community detection. Phys Rev E Stat Nonlin Soft Matter Phys 84, 066122, doi:10.1103/PhysRevE.84.066122 (2011). - DOI - PubMed
    1. Stoeckius M et al. Cell Hashing with barcoded antibodies enables multiplexing and doublet detection for single cell genomics. Genome Biol 19, 224, doi:10.1186/s13059-018-1603-1 (2018). - DOI - PMC - PubMed
    1. Ilicic T et al. Classification of low quality cells from single-cell RNA-seq data. Genome Biol 17, 29, doi:10.1186/s13059-016-0888-1 (2016). - DOI - PMC - PubMed
    1. Srivastava N, Hinton G, Krizhevsky A, Sutskever I & Salakhutdinov R Dropout: A Simple Way to Prevent Neural Networks from Overfitting. Vol. 15 (2014).
    1. Yarin G & Zoubin G 1050–1059 (PMLR, 2016).

Publication types

MeSH terms