. 2020 Dec;588(7838):491-497.
doi: 10.1038/s41586-020-2884-6. Epub 2020 Nov 4.

IFITM3 functions as a PIP3 scaffold to amplify PI3K signalling in B cells

Affiliations

IFITM3 functions as a PIP3 scaffold to amplify PI3K signalling in B cells

Jaewoong Lee et al. Nature. 2020 Dec.

Erratum in

  • Author Correction: IFITM3 functions as a PIP3 scaffold to amplify PI3K signalling in B cells.
    Lee J, Robinson ME, Ma N, Artadji D, Ahmed MA, Xiao G, Sadras T, Deb G, Winchester J, Cosgun KN, Geng H, Chan LN, Kume K, Miettinen TP, Zhang Y, Nix MA, Klemm L, Chen CW, Chen J, Khairnar V, Wiita AP, Thomas-Tikhonenko A, Farzan M, Jung JU, Weinstock DM, Manalis SR, Diamond MS, Vaidehi N, Müschen M. Lee J, et al. Nature. 2021 Apr;592(7852):E3. doi: 10.1038/s41586-021-03388-4. Nature. 2021. PMID: 33712811 No abstract available.

Abstract

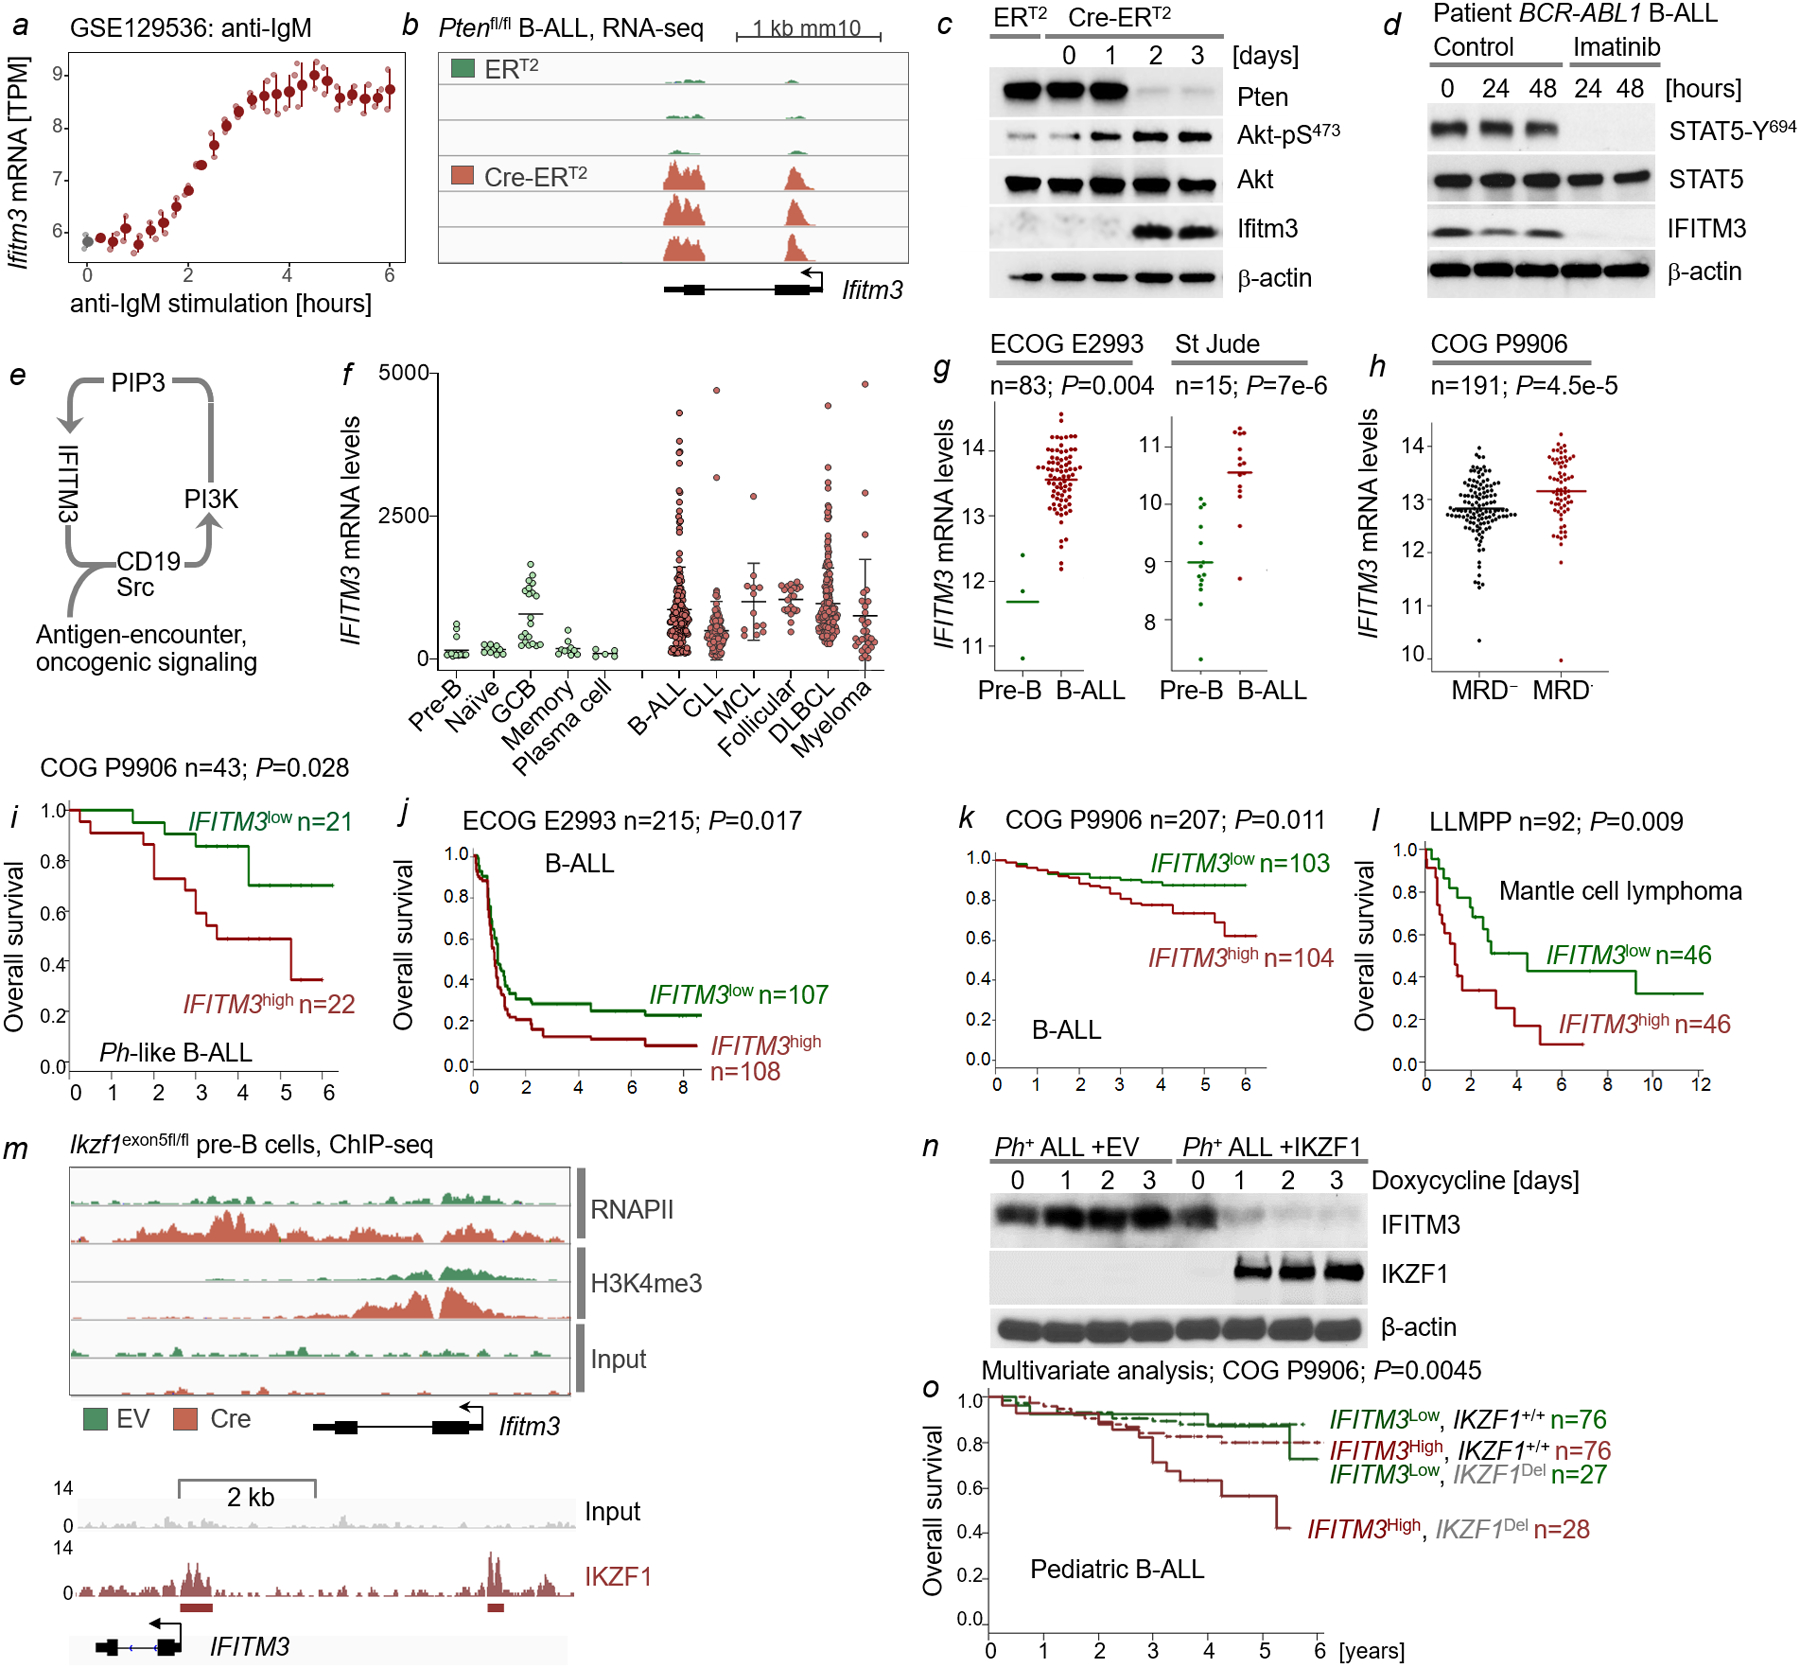
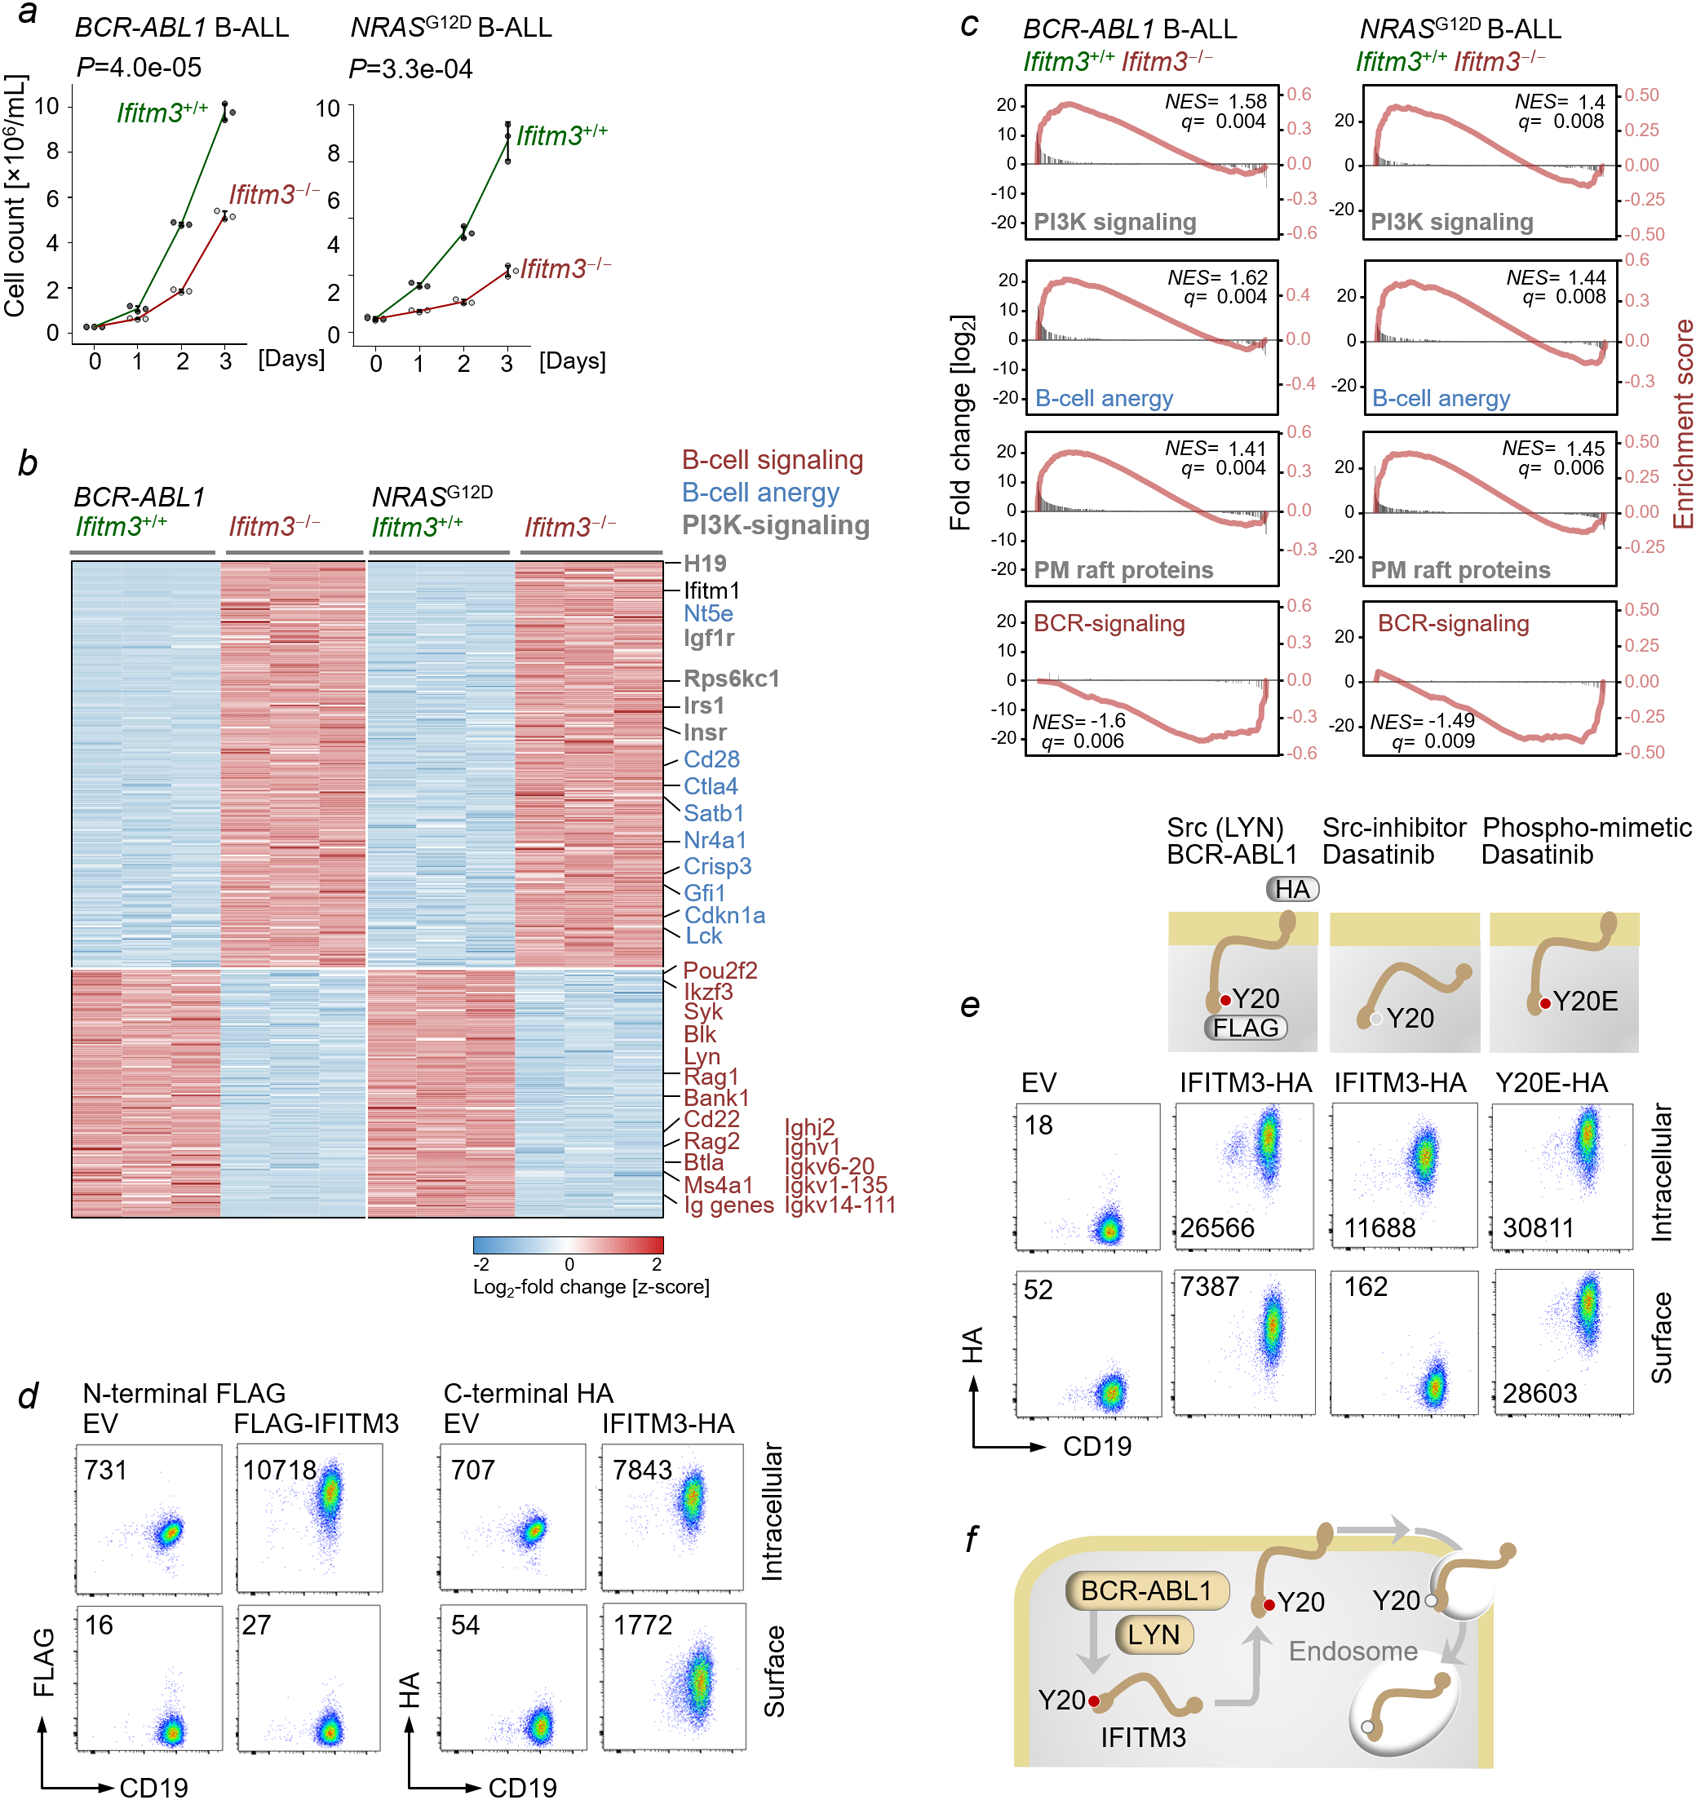
Interferon-induced transmembrane protein 3 (IFITM3) has previously been identified as an endosomal protein that blocks viral infection1-3. Here we studied clinical cohorts of patients with B cell leukaemia and lymphoma, and identified IFITM3 as a strong predictor of poor outcome. In normal resting B cells, IFITM3 was minimally expressed and mainly localized in endosomes. However, engagement of the B cell receptor (BCR) induced both expression of IFITM3 and phosphorylation of this protein at Tyr20, which resulted in the accumulation of IFITM3 at the cell surface. In B cell leukaemia, oncogenic kinases phosphorylate IFITM3 at Tyr20, which causes constitutive localization of this protein at the plasma membrane. In a mouse model, Ifitm3-/- naive B cells developed in normal numbers; however, the formation of germinal centres and the production of antigen-specific antibodies were compromised. Oncogenes that induce the development of leukaemia and lymphoma did not transform Ifitm3-/- B cells. Conversely, the phosphomimetic IFITM3(Y20E) mutant induced oncogenic PI3K signalling and initiated the transformation of premalignant B cells. Mechanistic experiments revealed that IFITM3 functions as a PIP3 scaffold and central amplifier of PI3K signalling. The amplification of PI3K signals depends on IFITM3 using two lysine residues (Lys83 and Lys104) in its conserved intracellular loop as a scaffold for the accumulation of PIP3. In Ifitm3-/- B cells, lipid rafts were depleted of PIP3, which resulted in the defective expression of over 60 lipid-raft-associated surface receptors, and impaired BCR signalling and cellular adhesion. We conclude that the phosphorylation of IFITM3 that occurs after B cells encounter antigen induces a dynamic switch from antiviral effector functions in endosomes to a PI3K amplification loop at the cell surface. IFITM3-dependent amplification of PI3K signalling, which in part acts downstream of the BCR, is critical for the rapid expansion of B cells with high affinity to antigen. In addition, multiple oncogenes depend on IFITM3 to assemble PIP3-dependent signalling complexes and amplify PI3K signalling for malignant transformation.


Conflict of interest statement

Declaration of Interests

The authors have no competing interests.

Figures

Extended Data Figure 1:
Extended Data Figure 1:. Ifitm3 expression is induced by oncogenic PI3K signaling and repressed by IKZF1
a, Changes of Ifitm3 mRNA levels were monitored in murine splenic B cells upon BCR-engagement (mean ± s.e.; n=2). Ptenfl/fl pre-B cells carrying 4-OHT-inducible Cre-ERT2 or ERT2 were treated with 4-OHT and studied by RNA-seq for Ifitm3 transcript expression (b) and Western blot for protein levels of Pten, phospho-Akt-S473, Akt and Ifitm3 (c; n=3). d, Phospho-STAT5-Y694, STAT5 and IFITM3 levels in patient-derived B-ALL cells (PDX2) measured by Western blotting upon Imatinib treatment (n=3). e, Scenario of the PI3K-pathway as positive regulator of IFITM3, which in turn amplifies BCR and oncogenic signaling. f, IFITM3 mRNA levels across human normal and malignant hematopoietic and B-lymphoid samples (source data and statistics Supplementary Table S2; two-tailed t-test). g, IFITM3 mRNA levels in pre-B cells from healthy donors and B-ALL patient samples were compared for two clinical cohorts (ECOG E2993 and St. Jude). In ECOG E2993, bone marrow samples were obtained at diagnosis before treatment from 83 adults with B-ALL with a confirmed purity of >90% leukemic blasts. For the St. Jude data sets, 15 pediatric B-ALL samples prior to treatment were compared to flow-sorted pre-B cells from bone marrow aspirates of healthy donors. (two-tailed Wilcoxon). h, Minimal residual disease (MRD) was determined in the COG P9906 cohort, IFITM3 mRNA levels were compared in MRD+ (n=67) and MRD- (n=124) patients (two-tailed Wilcoxon). i-l, Patients with leukemia and lymphoma from five clinical cohorts were segregated into two groups based on higher (IFITM3high) or lower (IFITM3low) than median IFITM3 mRNA levels. Overall survival was compared by two-tailed log-rank test. m, ChIP-seq enrichment of RNAPII and H3K4me3 at the Ifitm3 locus in pre-B cells (top) from Ikzf1exon5fl/fl mice upon Cre-mediated deletion of Ikzf1 (GSE86897). Binding of IKZF1 to the promoter region of IFITM3 was also analyzed in ChIP-seq data from patient-derived B-ALL cells (bottom, LAX2, GSE58825). n, Human B-ALL cells (BV173) carrying IKZF1-deletions were reconstituted with doxycycline-inducible IKZF1 or EV. Levels of IFITM3 were assessed by Western blotting upon doxycycline-induction (n=3). o, Multivariate analysis of established risk factors in pediatric B-ALL patients (COG P9906, n=207), including mutation or deletion of IKZF1. Patients (n=207) were separated into IKZF+/+ or IKZFDel groups, then further segregated based on higher or lower than median expression levels of IFITM3. The comparison of these four groups established IFITM3 mRNA levels as an independent risk factor regardless of IKZF1-deletion status (two-sided log-rank test; P=0.0045). c-d, n, For gel source data, see Supplementary Fig. 1.
Extended Data Figure 2:
Extended Data Figure 2:. Ifitm3 is essential for the development of B1 and germinal center B-cells
a, Hardy fractions of B-cell subsets isolated from bone marrow of Ifitm3+/+ and Ifitm3ˉ/ˉ littermates analyzed by flow cytometry (n=3). b, Surface expression of IgM, CD20, CD19, IgD, CD2 and CD21 measured by flow cytometry in enriched bone marrow (Gr-1, Nk1.1 and B220+) and splenic B-cells (CD3 and B220+) from Ifitm3+/+ or Ifitm3ˉ/ˉ mice (n=7; mean±s.d.). Mean fluorescence intensities (MFI) values for individual measurement compared by two-tailed t-test. c, Ca2+-mobilization from cytoplasmic stores in response to BCR (IgM)-engagement was measured in Ifitm3+/+ and Ifitm3ˉ/ˉ splenic B cells. Ca2+ release was induced by addition of 10 μg ml−1 anti-mouse IgM 60 seconds after acquisition of background fluorescence. Ca2+ release was measured over 300 seconds with cell permeant Rhod-2 dye; MFI compared between replicates (n=3). d, Ca2+ mobilization in response to BCR-engagement measured upon CRISPR-Cas9-mediated deletion of IFITM3 in Jeko1 mantle cell lymphoma (MCL) cells. Ca2+-release upon addition of 10 μg ml−1 of polyclonal F(ab’)2 anti-human IgM was measured for 300 seconds with cell permeant Fluo-4 dye; MFI compared between replicates (left; n=3). Surface expression of CD19 following deletion of IFITM3 in Jeko1 MCL cells, MFIs for CD19 indicated (right; n=3). e, Jeko1 MCL cells were electroporated with non-targeting RNP (Cas9-gRNA ribonucleoproteins, gNT) or IFITM3-targeting RNP complex (gIFITM3). Following electroporation, MCL cells were treated with vehicle (DMSO) or 25 nmol l−1 of Dasatinib for 3 hours. Cells were stimulated with 10 μg ml−1 of anti-human IgM F(ab’)2 for indicated timepoints and subjected to co-immunoprecipitation with an anti-CD19 antibody. Immunoblots were performed to measure levels of CD19-tyrosine phosphorylation, and binding of LYN to CD19. Levels of IFITM3, Src-pY416 and Lyn were assessed in whole cell lysates (10% input) with β-actin as loading control. (n=3; gel source data Supplementary Fig. 1). f-h, Relative fractions (left) and absolute cell counts (right) of total B-1 (f), B-1a (g) cells in the peritoneal cavity and marginal zone B cells (h) in spleen of Ifitm3+/+ and Ifitm3−/− littermates (n=5) are shown (means ± s.d.; two-tailed t-test).
Extended Data Figure 3:
Extended Data Figure 3:. Ifitm3-deficient B-ALL cells exhibit an anergic phenotype and compensatory upregulation of Ifitm1 and PI3K signaling molecules
a, Numbers of viable Ifitm3+/+ and Ifitm3−/− BCR-ABL1 or NRASG12D B-ALL cells were counted by Trypan blue dye exclusion (n=3; mean±s.d.; two-tailed t-test). b, RNA-seq was performed for Ifitm3+/+ and Ifitm3−/− BCR-ABL1 and NRASG12D B-ALL cells. Relative rlog normalized gene expression values for all strongly differentially expressed genes (P < 1e-5 & L2FC > 1; Wald test with BH correction) in both BCR-ABL1 and NRASG12D conditions plotted as a heatmap with row-scaling. B-cell signaling related genes are labeled in red, anergy-related genes are labeled in blue and PI3K signaling related genes are labeled in gray. c, Gene set enrichment analysis for genes ranked by ratio of Ifitm3−/− to Ifitm3+/+ as log2 fold change; red lines indicates running enrichment score (right axis), gray bars indicates fold change (left axis). Statistical significance was determined by two-tailed Kolmogorov-Smirnov test. d, Patient-derived B-ALL cells (PDX2) were transduced with N-terminally FLAG-tagged or C-terminally HA-tagged IFITM3 constructs. Combinations of intracellular and surface staining were performed to examine IFITM3 topology at the cell membrane. e, Patient-derived B-ALL cells (PDX2) were transduced with C-terminally HA-tagged IFITM3 or the IFITM3Y20E phosphomimetic. Combinations of intracellular and surface staining, with or without Src-kinase inhibition by dasatinib, were performed to examine IFITM3 topology at the cell membrane and its regulation by Src-kinases. d-e, Representative plots from 3 independent experiments f, A scenario of the topology of IFITM3 regulated by Src (Lyn)- or oncogenic tyrosine kinases (BCR-ABL1) at the plasma membrane is shown. Phosphorylation of Y20 hinders the recognition ofYEM endocytosis motif by the AP-2 complex, thereby antagonizes endocytosis and endosomal trafficking of IFITM3.
Extended Data Figure 4:
Extended Data Figure 4:. IFITM3 amplifies PI3K signaling downstream of BCR and integrin receptors
a, Volcano plot of differentially phosphorylated proteins in patient-derived B-ALL (PDX2) cells transduced with IFITM3Y20E compared to empty vector (EV) control (n=3; Wald test with BH correction). b, F(ab) fragments of the anti-HA antibody or isotype control were purified and their identity confirmed by Western blot (left). 8 million patient-derived B-ALL (PDX2) cells carrying IFITM3-HA, IFITM3Y20E-HA or EV control were resuspended into complete medium and treated with either 2.5 μg ml−1 of full antibodies or F(ab) fragments of anti-HA or isotype control for the indicated times. Levels of phospho-AKT-S473, AKT and HA tagged IFITM3 were assessed by Western blots using β-actin as loading control (right). Data from three independent experiments. For gel source data, see Supplementary Fig. 1. c, Ca2+-mobilization in response to TCR-engagement using CD3ɛ-specific antibodies was measured upon CRISPR-Cas9-mediated deletion of IFITM3 in T-ALL cells (Jurkat; left). Ca2+ release from cytoplasmic stores was induced by adding 10 μg ml−1 of monoclonal (OKT3) anti-human CD3ɛ at 50 seconds after acquisition of background fluorescence. Surface expression of CD3 was measured following deletion of IFITM3 in Jurkat cells (right). MFIs for CD3 are indicated. Shown are representative plots from 3 independent biological experiments. MFI values for individual measurement were compared by two-tailed t-test. d, Surface proteins on Ifitm3+/+ and Ifitm3−/− B-ALL cells were labeled with biotin and enriched with streptavidin affinity pull-down followed by on-bead trypsin digestion, mass spectrometry and quantified with Lable-Free Quantification (LFQ). Differentially expressed cell surface proteins on Ifitm3+/+ and Ifitm3−/− B-ALL cells are shown with the mean difference of LFQ plotted against the P-value (Welch’s t-test). All experiments were performed in biological triplicates. e-g, Validation of differential expression of surface receptors between Ifitm3+/+, Ifitm3−/− and Ifitm3Y20E-overexpressing B-ALL cells. Flow cytometry analyses show surface expression of BCR-signaling components (e), integrins and adhesion receptors (f) and other surface receptors (g) in Ifitm3+/+, Ifitm3−/− and B-ALL cells expressing Ifitm3Y20E (n=3).
Extended Data Figure 5:
Extended Data Figure 5:. Inducible membrane-translocation of CD19 does not rescue defective Src- and PI3K signaling in Ifitm3-deficient B-cells
a, Surface expression of Cd19 was assessed by flow cytometry following forced expression of Cd19 for >1 week in Ifitm3+/+ and Ifitm3−/− B-ALL cells. b, Western blot analyses of phospho-Akt-S473, Akt, Myc and Bcl2 upon forced expression of Cd19 for >1 week in murine Ifitm3+/+ and Ifitm3−/− B-ALL cells. Colony forming ability (c) and cell cycle progression (d) of Ifitm3+/+ and Ifitm3−/− B-ALL cells upon forced expression of Cd19 for >1 week was examined. c, Colony numbers for individual measurement were compared by two-tailed t-test. d, Numbers indicate percentage of cells in S phase. e, Numbers of viable Ifitm3+/+ and Ifitm3−/− B-ALL cells following forced expression of Cd19 were counted by Trypan blue dye exclusion (left). Ifitm3ˉ/ˉ B-ALL cells were transduced with GFP-tagged constructs for expression of Cd19 with an intact (Y531) or mutant (Y531F) PI3K-activation motif in its cytoplasmic tail. Relative changes of GFP+ cells (transduced with Cd19-Y531 or Cd19-F531) were plotted over time (means ± s.d.). a-e, Data from three independent experiments. b, For gel source data, see Supplementary Fig. 1. f, Murine Cd19−/− B-ALL clones were generated by electroporation of murine B-ALL cells with Cd19-targeting RNP (Cas9-gRNA ribonucleoproteins, gCd19 ALL) and single-cell clones with biallelic deletion were selected. Cd19−/− B-ALL cells were transduced with Cd19-ERT2, a fusion of the ER-ligand binding domain to the C terminus of Cd19, or ERT2 as empty vector control. Reconstitution of Cd19−/− B-ALL cells with Cd19-ERT2 resulted in stable expression of the fusion proteins that were retained in complex with cytoplasmic heatshock proteins. Addition of 4-OHT released Cd19-ERT2 from its cytoplasmic heatshock chaperone and enable cell surface expression within 30 minutes of 4-OHT addition. g, To test the effect of inducible Cd19 membrane translocation in Ifitm3−/− B-ALL cells, Ifitm3+/+ and Ifitm3−/− B-ALL cells were transduced with Cd19-ERT2 or ERT2 empty vector control. 4-OHT-mediated translocation of Cd19 to the cell surface was assessed by flow cytometry for indicated times (0 to 3 hours). h, Ifitm3+/+ and Ifitm3−/− B-ALL cells were transduced with Cd19-ERT2 or ERT2 empty vector control. Cells were treated for 0, 1 and 3 hours with 4-OHT for surface-translocation of Cd19. Cell lysates from these populations were analyzed by Western blot for phospho-Cd19-Y531, Cd19, phospho-Src-Y416, Lyn, phospho-AKT-S473, AKT, Myc and Bcl2. While Cd19-ERT2 reconstitutes Cd19 protein levels in Ifitm3−/− B-ALL cells and rapid translocation to the cell surface (g), this change alone was not sufficient to induce proper phosphorylation of Cd19, Src-kinases and PI3K-signaling via Akt f-h, Data from three independent experiments. h, For gel source data, see Supplementary Fig. 1.
Extended Data Figure 6:
Extended Data Figure 6:. Ifitm3 links components of the BCR and integrin receptor pathways to PI3K signaling
a, Schematic of HA-tagged-IFITM3Y20E BirA-fusion proteins used for TurboID interactome analyses. BirA (biotin ligase) was fused to N-terminal IFITM3 carrying the phosphomimetic Y20E mutation for membrane-localization. HA-IFITM3Y20E-BirA or HA-BirA controls were expressed in PDX2 B-ALL (b) or Jeko1 MCL cells (c and d). c,d Cells were incubated with exogenous biotin for 10 min upon IFITM3- (anti-HA) or BCR- (anti-IgM) engagement. IFITM3Y20E interactome analyses identified interacting proteins by mass spectrometry, plotted based on significance and log2-fold enrichment over EV control. Essential interactors as BCR component (red), integrin (blue) and PI3K-signaling (gray) are highlighted. Data from three independent biological replicates. e, Proximity ligation assays were performed with Jeko1 MCL cells upon engagement of BCR. Jeko1 MCL cells were stimulated by BCR-engagement for 0, 3 and 30 minutes, then fixed, permeabilized and assessed for the proximity of CD79B to IFITM3. Representative microscopic images with PLA signal (red dot) and nuclei stained with DAPI as blue are shown. LAMP1 was used as a marker for endosomes to distinguish plasma membrane-bound from endosomal localization of CD79B:IFITM3 complexes. Scale bars, 5 mm. Data from three independent replicates.
Extended Data Figure 7:
Extended Data Figure 7:. Ifitm3 functions as a central effector of B-cell adhesion
a, Homotypic aggregation was studied in Ifitm3−/− B-ALL cells that were reconstituted with C-terminally HA-tagged Ifitm3, Ifitm3Y20E or empty vector (EV) and incubated with anti-CD19, anti-HA antibodies or isotype control for 24 hours. Data from three independent experiments. b, Ifitm3+/+ or Ifitm3−/− B-ALL cells were transduced with GFP-tagged IK6 or GFP alone. IK6 levels in flow-sorted GFP+ cells assessed by Western blot analysis using β-actin as loading control (right). 10,000 Ifitm3+/+ or Ifitm3−/− B-ALL cells carrying IK6 or EV were plated for colony forming assays. Colonies were imaged and counted after 7 days. Representative images are shown with colony numbers, Data from three independent experiments and assessed by two-tailed t-test (means ± s.d.). For gel source data, see Supplementary Fig. 1.c, 100,000 Ifitm3+/+ or Ifitm3−/− B-ALL cells carrying IK6 or EV were cultured on OP9 stroma cells. Ratios of adherent cells to nonadherent cells were calculated. Data are analyzed from three independent biological experiments (right) and assessed by two-tailed t-test (means ± s.d.). d, Representative images of adherent B-ALL cells on OP9 stroma are shown. Round and light-refracting cells are adherent B-ALL cells attached to stroma cells. Dark and round cells are adherent B-ALL cells incorporated into stromal layer. Data from three independent biological replicates. e, Surface expression levels of integrins on adherent B-ALL cells were measured by flow cytometry. MFI values are indicated for individual measurements. Data from three independent biological replicates.
Extended Data Figure 8:
Extended Data Figure 8:. Ifitm3 functions as a PIP3 scaffold and mediated cell membrane-stiffening upon BCR-engagement
a, Single-cell size-normalized acoustic scattering (SNACS) was measured using a previously established microfluidic method as a metric for cell surface stiffness. Jeko1 mantle cell lymphoma cells were flown through a standing acoustic wave generated inside a vibrating suspended microchannel resonator. The cantilever vibration frequency was monitored, and its shift was used to quantify the acoustic scattering from the cells as well as the buoyant mass of the cells. The data displayed was obtained using a 350 μm long cantilever with 15 × 20 μm sized channel inside of the cantilever and a ~200 ms transit time through the cantilever. All the regulators, valves and data acquisition were controlled by custom software coded in LabVIEW 2017 (National Instruments). A parallel volume measurement using Coulter Counter was carried out to quantify average cell volume, which was used together with the single-cell buoyant mass measurements to calculate SNACS for each cell. Jeko1 mantle cell lymphoma cells without (IFITM3+/+) and with (IFITM3−/−) CRISPR/Cas9-mediated deletion of IFITM3 were kept under cell culture conditions and treated with an anti-IgM antibody. Fixation with paraformaldehyde (PFA) was used as s positive control. Shown are representative plots from 3 independent experiments (median levels in red dotted line). Statistical significance was determined by two-tailed t-test. Numbers indicated cells studied for SNACS measurement. b, Ifitm3+/+ and Ifitm3−/− B-ALL cells were incubated with 30 μM of the PIP3 carrier histone H1 or PIP3-histone H1 complex for 30 minutes. Levels of phospho-CD19-Y531, CD19, phospho-Src-Y416, Lyn, phospho-Akt-S473, Akt and Myc were measured by Western blot using β-actin as loading control. Data from three independent replicates. For gel source data, see Supplementary Fig. 1. c, Colony formation assays were performed for Ifitm3+/+ and Ifitm3−/− B-ALL cells that were treated with 30 μM of PIP3-histone H1 or the shuttle protein histone H1 (H1) alone. Photomicrographs and colony numbers per 10,000 plated cells are shown. Data are presented as means ± standard derivation (s.d.) from three independent experiments. Statistical significance was determined by two-tailed t-test. d, Flow cytometry analyses of surface expression of CD19, CD44, CD25 and CD44 in Ifitm3+/+ and Ifitm3−/− B-ALL cells treated with 30 μM of PIP3-histone H1 or the shuttle protein histone H1 (H1) alone for 72 hours. Data from three independent replicates.
Extended Data Figure 9:
Extended Data Figure 9:. Modeling of binding of IFITM3 to PIP2 and PIP3
The hierarchical scheme of MD simulations (a-c) to delineate the structural and dynamical basis of PIP2 and PIP3 binding to IFITM3 (yellow). a, Coarse grained simulations of IFITM3 in composite cell membrane. The side views of the lipid bilayer are shown. The lipid raft markers are shown in color with GM1 (pink), cholesterol (green) and sphingomyelin (blue). The gray surface represents all the other lipids. b, The simulation cell extracted from the coarse grained simulation as the starting structure for all-atom MD simulations. The IFITM3 protein is shown in yellow and the PIP2 and PIP3 are shown in green and red stick representations. c, Close up view of one of the predicted binding poses of PIP2 and PIP3 in the most populated conformation of IFITM3. The dashed lines shown are the PIP2 or PIP3 contacts with the basic residues in IFITM3 (top). The amino acid sequence of IFITM3 in the stretch of residues between TM1 and TM2 from 57 to 128 modeled in this work is shown. The conserved intracellular loop (CIL) region is boxed and basic amino acids are highlighted with blue. The average interaction energy of PIP2 or PIP3 with the two basic batches measured in all-atom MD simulations is indicated (see Supplementary Table S6). d, e, The average interaction energy of PIP2 (green) or PIP3 (red) with the IFITM3 (residues 57–128) was measured in all-atom MD simulations. The 1-residue contact indicates the conformation of PIP2 or PIP3 binding with only one basic residue in the basic amino patch KSRDRK of IFITM3. The 2-residue contact refer to the binding conformation of PIP2 or PIP3 that show contacts with two basic residues. Shown are representative plots from at least 4 independent experiments (mean ± s.d.). P-values were determined by two-tailed t-test (d). Populations showing one or two-residue contacts of PIP2 (green) or PIP3 (red) to IFITM3 were quantitated from all-atom MD simulations. The population density was assessed by the normalization of number of events with the total number of frames. Shown are representative plots from 3 independent experiments (mean ± s.d.). Statistical significance was determined by two-tailed t-test (e).
Extended Data Figure 10:
Extended Data Figure 10:. IFITM3-mediated PI3K signaling downstream of BCR and integrin receptors depends on K83-K104 but not on R85-R87-K88 residues
a-c, Levels of differentially phosphorylated proteins in patient-derived B-ALL (PDX2) cells transduced with IFITM3Y20E, K83A, R85A or empty vector (EV) control were identified by mass spectrometry (n=3). Relative abundance values are plotted for all sites ranked by fold-change as indicated, phosphosites of interest are highlighted. b, Feature set enrichment analysis (FSEA) ranked by log2 fold change are shown for phosphosites in PI3K signaling (gray), BCR-signaling (red) and integrin and adhesion receptor elements (blue). Statistical significance was determined by two-tailed Kolmogorov-Smirnov test. d, Cumulative distribution frequencies for log2-fold changes in phosphosite abundance between IFITM3 transduced and EV conditions were calculated for all sites and globally increased in IFITM3Y20E over EV. The analysis was repeated for the K83A- (red) and R85A- (green) mutants of IFITM3Y20E. The light gray line indicates background variance observed between EV replicates. Shifts that were caused by the K83A and R85A mutants are indicated by arrows. Overall changes in distribution (shifts) between IFITM3Y20E and K83A and R85A mutants were measured by two-tailed Kolmogorov-Smirnov test. e, Schematic of BirA (engineered biotin ligase) was fused at N-terminal ends of HA-tagged IFITM3Y20E or its K83A mutant and expressed in PDX2 B-ALL or Jeko1 MCL cells. e-g, Interactomes of IFITM3Y20E and its K83A mutant were compared in PDX2 B-ALL cells upon IFITM3-engagement (anti-HA; e) or in Jeko1 MCL cells upon IFITM3- (anti-HA; f) or BCR- (anti-IgM; g) engagement. Phosphosites of interest, including BCR-signaling, PI3K-signaling and integrins and adhesion receptor elements were highlighted.
Figure 1:
Figure 1:. Ifitm3 is essential for B-cell activation and affinity maturation in germinal centers
a, CD19 surface expression (top), cell cycle progression (middle; percentages in S phase) and cell viability (bottom; percentages of Annexin V+ 7-AAD+ cells) were measured. b, Number of viable Ifitm3+/+ and Ifitm3−/− pre-B cells were counted at times indicated. c, Levels of phospho-Akt-S473, Akt, Myc, p53, p21 and Bcl2 were assessed in Ifitm3+/+ and Ifitm3−/− pre-B cells. d, Splenic B-cells from Ifitm3+/+ and Ifitm3−/− mice (n=5) were analyzed for CD21high CD23low/− marginal zone B-cells (MZB), peritoneal cavity B-cells for Mac-1+ IgM+ B-1, and CD5+ IgM+ B-1a cells. e, Splenic B-cells from Ifitm3+/+ and Ifitm3−/− mice were adoptively transferred to μMT recipient mice (n=10) followed by immunization with 0.5 mg of NP-KLH or Vehicle (Veh). Spleens were collected on day 12 after immunization and subjected to immunofluorescence staining of tissue sections with B220, CD3 and peanut agglutinin (PNA). f-g, Splenocytes harvested from μMT mice (n=10) were analyzed by flow cytometry 12 days post immunization for CD95, GL7 and NP to identify NP-specific GC-B cells. Relative fractions (f), absolute numbers (g), and representative flow cytometry plots (h) are shown. i, Levels of serum immunoglobulin isotypes in μMT recipient mice transplanted with Ifitm3+/+ or Ifitm3−/− B-cells are shown before and after immunization (n=10; day 12). Serum levels of IgM, IgG1 and IgG2b were determined by ELISA. a-c, For gel source data, see Supplementary Fig. 1. b,fg,i, Mean ± s.d. indicated, significance determined by two-tailed t-test.
Figure 2:
Figure 2:. Essential role of Ifitm3 in oncogenic signaling and B-cell transformation
a, CD19 surface expression (top), cell cycle progression (middle; percentages in S phase) and cell viability (bottom; percentages of Annexin V+ 7-AAD+ cells) were measured. b, Ifitm3+/+ and Ifitm3−/− BCR-ABL1 or NRASG12D B-ALL cells were assayed for levels of phospho-Akt-S473, Akt, Myc, p53, p21 and Bcl2 (n=3) and c, plated in semi-solid methylcellulose. d, Kaplan-Meier analyses of NSG recipient mice injected with indicated numbers of Ifitm3+/+ and Ifitm3−/− BCR-ABL1 (left) or NRASG12D (right) B-ALL cells (n=5) e, Frequencies of leukemia-initiating cells (LIC) estimated with extreme limiting dilution analysis (ELDA; 90% CI; likelihood ratio test). f, Jeko1 mantle cell lymphoma (MCL) cells expressing doxycycline (Dox)-inducible Cas9 were transduced with IFITM3-targeting or non-targeting (NT) sgRNAs. Enrichment or depletion of targeted cells (Cas9+gRNA+) monitored by flow cytometry upon Dox-treatment (mean±s.d.), and IFITM3 levels measured by Western blot. g, Pre-malignant LSL-BcrBCR-ABL1 x Mb1-Cre pre-B cells expressing IFITM3, IFITM3Y20E (Y20E) or EV were plated for colony forming assays (7 days; representative images shown at ×1 (top) and ×10 (bottom) magnification). h, Survival analyses (P=0.0001, log-rank test) of congenic recipient mice transplanted with LSL-BcrBCR-ABL1 x Mb1-Cre B-cells transduced with EV, IFITM3 or Y20E (n=7). i, Engraftment and expansion of luciferase-labeled leukemia cells were monitored by luciferase bioimaging at times indicated. j, Effects of IFITM3 or IFITM3Y20E on oncogenic signaling in LSL-BcrBCR-ABL1 x Mb1-Cre B-cell precursors measured by Western blot and compared to EV. Phosphorylation of Cd19-Y531, Src/Lyn-Y416 and Akt -S473 were examined. a-c,f-g,j, For gel source data, see Supplementary Fig. 1. c,g, Two-tailed t-test.
Figure 3:
Figure 3:. IFITM3 links components of the BCR and integrin receptor pathways to PI3K signaling
a, Phosphorylated protein levels in PDX2 B-ALL cells transduced with HA-tagged IFITM3Y20E or empty vector (EV) control identified by mass spectrometry upon IFITM3-crosslinking with anti-HA antibodies. b, Feature set enrichment analysis (FSEA) for phosphorylated proteins in the BCR-(red), integrin (blue) and PI3K- (gray) pathways, ranked by log2-fold change (Kolmogorov-Smirnov). c, Levels of phospho-SRC-Y416, LYN, phospho-CD19-Y531, CD19, phospho-AKT-S473 and AKT assessed in ICN12 cells expressing IFITM3-HA, IFITM3Y20E-HA or EV-HA upon IFITM3-crosslinking. d-e, Interactomes of BirA-IFITM3Y20E or EV control expressed in PDX2 B-ALL (d) and Jeko1 MCL (e) cells. f-g, Validation of IFITM3 interacting proteins by anti-FLAG co-immunoprecipitation in PDX2 cells transduced with FLAG-IFITM3 or FLAG-EV, followed by Western blotting for validation of interacting proteins and STAT5 and eIF4E as specificity controls (g). h-i, PLA in Jeko1 cells upon BCR-stimulation, assessed for proximity of CD79B to IFITM3. Representative images with PLA signal (red), nuclei (DAPI) and plasma membrane (WGA; green). (h). Quantitation of PLA signals per cell (two-tailed t-test). j, Structural model of IFITM3-mediated signal amplification between CD19 and LYN. In resting B-cells (left), IFITM3 is localized in endosomes. Upon antigen-encounter (right), LYN-mediated phosphorylation of IFITM3 induces membrane translocation, acting as a scaffold for CD19 and LYN in proximity with BCR-molecules. BCR-CD19-IFITM3 complexes form clusters for PI3K-activation and accumulation of PIP3 in lipid rafts. a-i, n=3, For gel source data, see Supplementary Fig. 1. a,d,e, Row-scaled protein abundance ranked by fold change, key proteins of interest are highlighted.
Figure 4:
Figure 4:. Structural basis of Ifitm3-mediated regulation of PIP3 signaling from lipid rafts
a, Ganglioside GM1 and cholesterol (stained with filipin III) levels measured in Ifitm3+/+ and Ifitm3−/− pre-B (top) and B-ALL (bottom) cells. b-c, Ratios of PIP3 and PIP2 were measured in Ifitm3+/+ and Ifitm3−/− murine (b, left), and human B-ALL cells (PDX2; b, right), and upon expression of EV, IFITM3 or IFITM3Y20E (c; Y20E). d, In vitro lipid-binding assays for GST-IFITM3 and 15 lipid classes. Recombinant GST-tag used as baseline. e, Lipid-binding assays were performed for biotin-IFITM3 N-terminus (1–57), first intramembrane α-helix (IM-α; 58–70), conserved intracellular loop (CIL; 71–105) and transmembrane α-helix (TM-α; 89–105). f, Lipid-binding assays to study interactions of PIP3 with biotinylated IFITM3-CIL fragments carrying mutations of basic residues. g-i, PIP3 binding to K83/K104 and R85/R87/K88 basic residue patches (g), dashed lines indicate PIP3 contacts within 3.5 Å. h, Interaction energies of PIP3 with basic residues K83 or R85 averaged over MD simulation trajectories (median levels in red dotted line, see Methods). Binding affinity for PIP3 as shown by heatmap of contact frequencies between PIP3 and each residue (i). j-l, Levels of phospho-AKT-S473, AKT, phospho-S6K-T389/421S424, S6K, phospho-CD19-Y531, CD19, phospho-SRC-Y416, LYN, phospho-PAK1/3-S199/204, phospho-PAK2-S192/197, PAK1, phospho-FAK-Y397/576/577, FAK, phospho-CXCR4-S339, CXCR4, and Integrin-β1 in PDX2 expressing EV, IFITM3-HA, IFITM3Y20E-HA, and R85A, K83A, R85A/R87A/K88A and K83A/K104A mutants upon IFITM3-crosslinking with anti-HA antibodies. a-f,j-l, n=3, For gel source data, see Supplementary Fig.1. b–c,e,h, two-tailed t-test.

Comment in

References

    1. Bailey CC, Zhong G, Huang IC & Farzan M IFITM-family proteins: the cell’s first line of antiviral defense. Annu. Rev. Virol 1, 261–283 (2014). - PMC - PubMed
    1. Diamond MS & Farzan M The broad-spectrum antiviral functions of IFIT and IFITM proteins. Nat. Rev. Immunol 13, 46–57 (2013). - PMC - PubMed
    1. Brass AL et al. The IFITM proteins mediate cellular resistance to influenza A H1N1 virus, West Nile virus, and dengue virus. Cell 139, 1243–1254 (2009). - PMC - PubMed
    1. Zhang Y, Qin L, Zhao Y, Zhang P, Xu B, Li K, Liang L, Zhang C, Dai Y, Feng Y, Sun J, Hu Z, Xiang H, Knight JC, Dong T, Jin R. Interferon-Induced Transmembrane Protein 3 Genetic Variant rs12252-C Associated with disease severity in Coronavirus Disease 2019. J Infect Dis. 222: 34–37 (2020). - PMC - PubMed
    1. Zhao X, Sehgal M, Hou Z, Cheng J, Shu S, Wu S, Guo F, Le Marchand SJ, Lin H, Chang J, Guo JT. Identification of Residues Controlling Restriction versus Enhancing Activities of IFITM Proteins on Entry of Human Coronaviruses. J Virol. 92, e01535–17 (2018). - PMC - PubMed

Publication types

MeSH terms