. 2020 Nov;587(7834):472-476.
doi: 10.1038/s41586-020-2886-4. Epub 2020 Nov 4.

Gut-educated IgA plasma cells defend the meningeal venous sinuses

Affiliations

Gut-educated IgA plasma cells defend the meningeal venous sinuses

Zachary Fitzpatrick et al. Nature. 2020 Nov.

Abstract

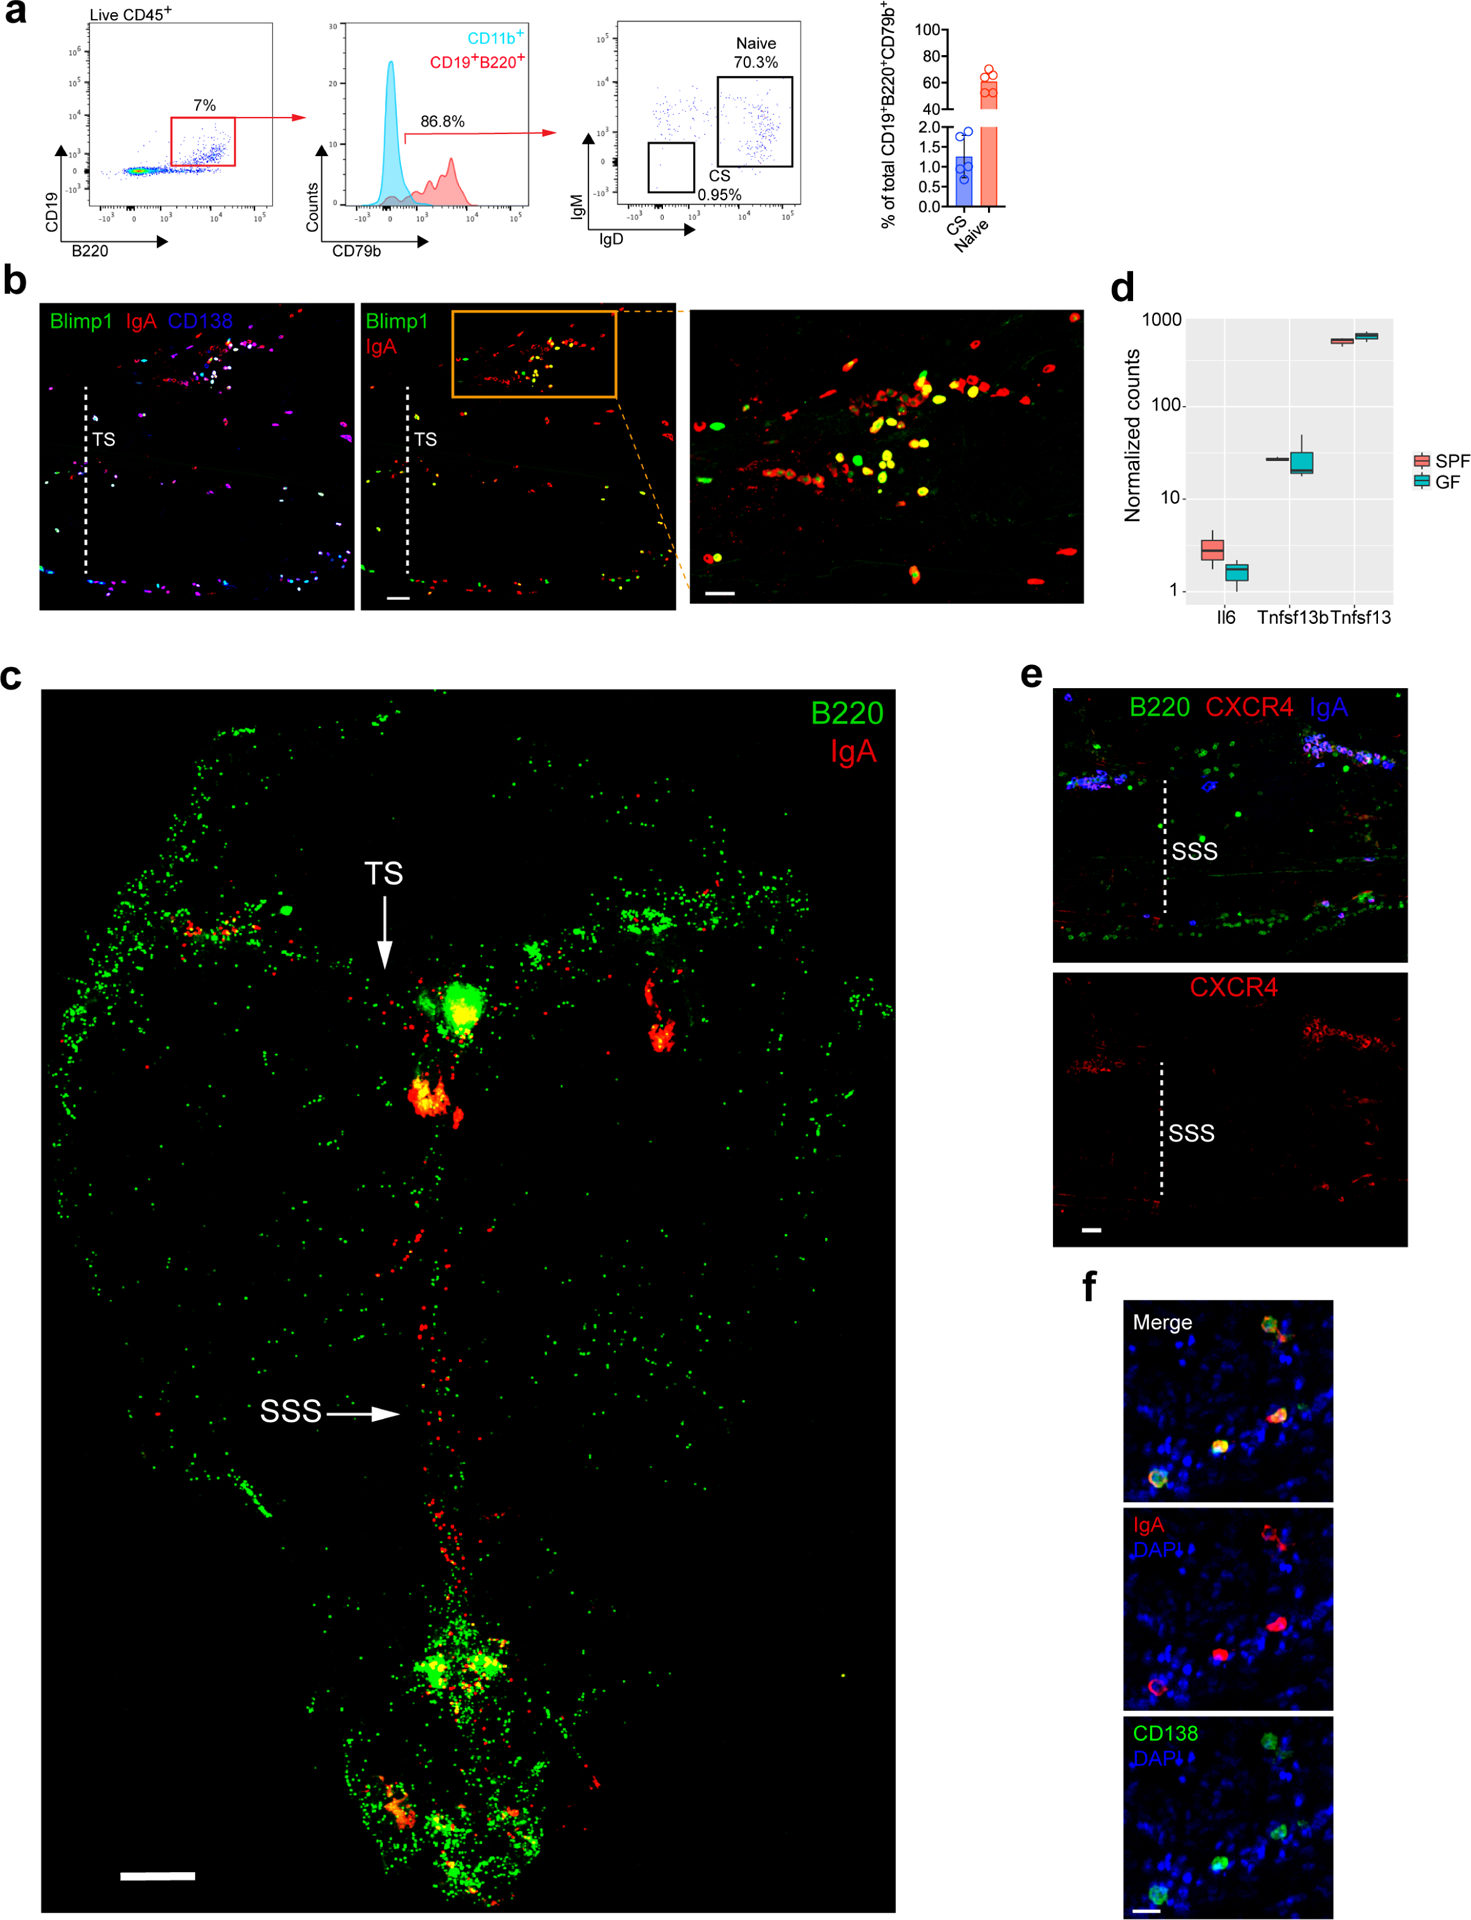
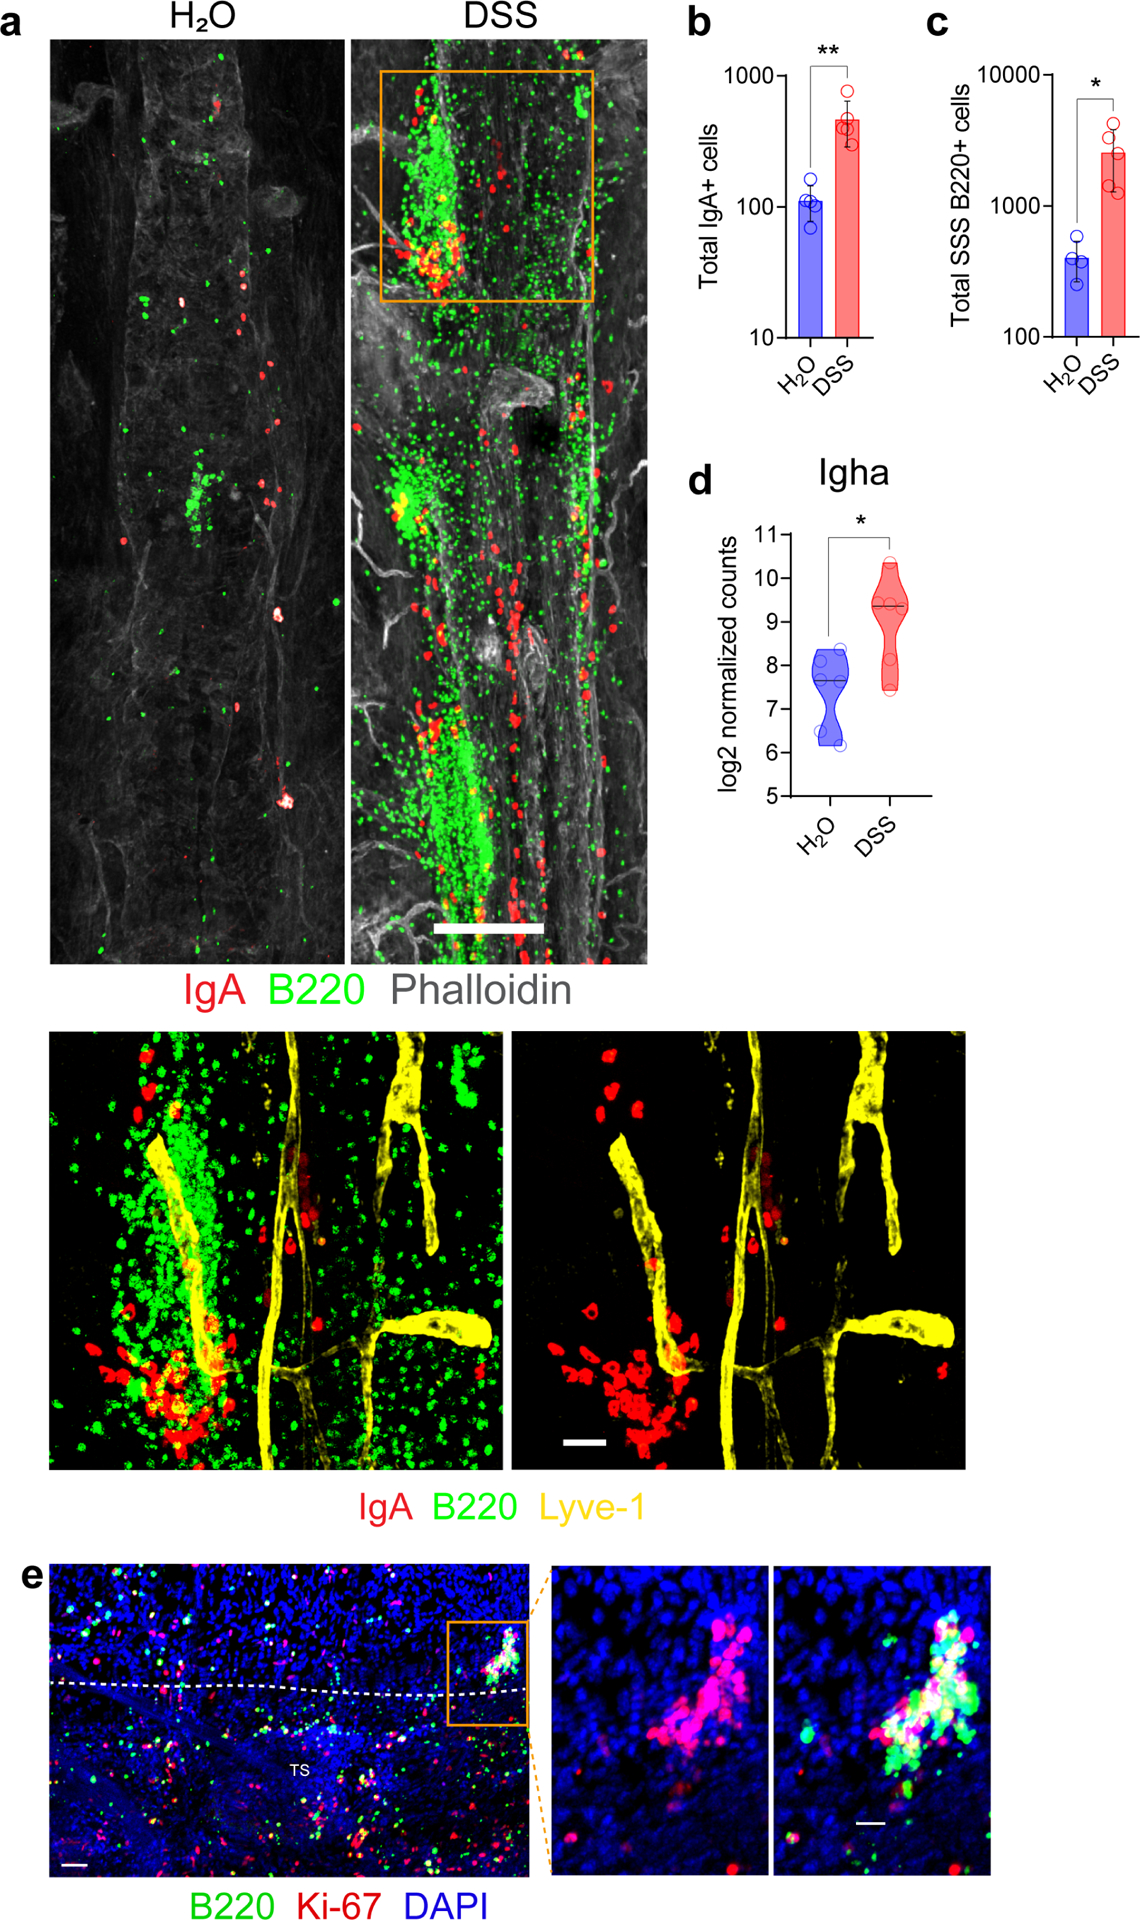
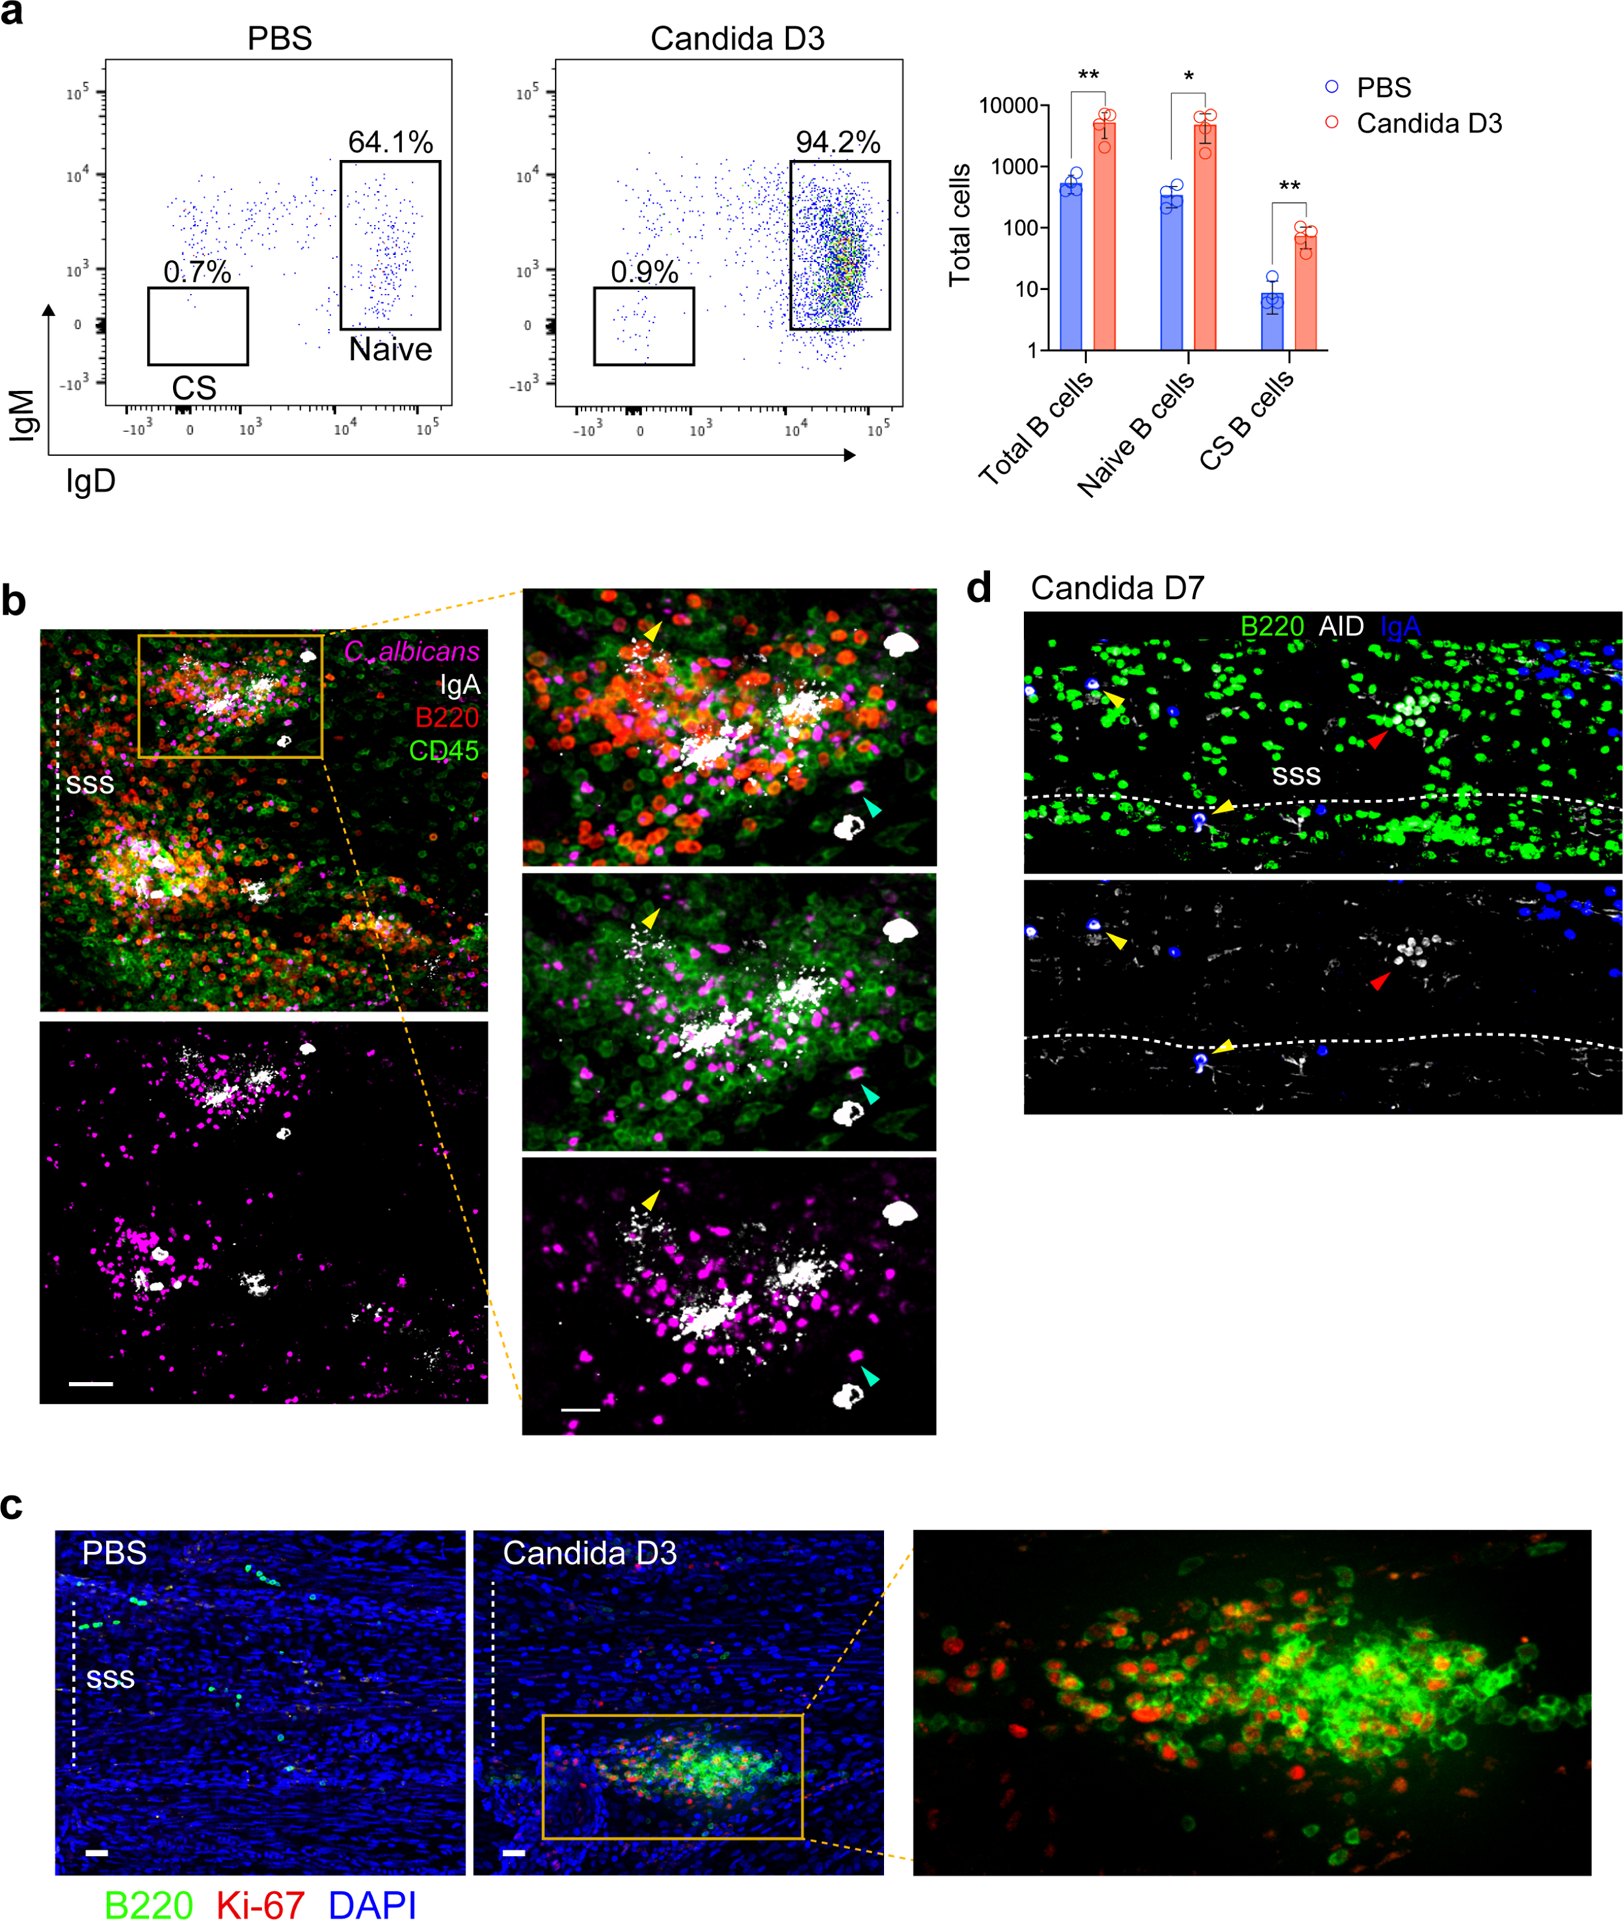
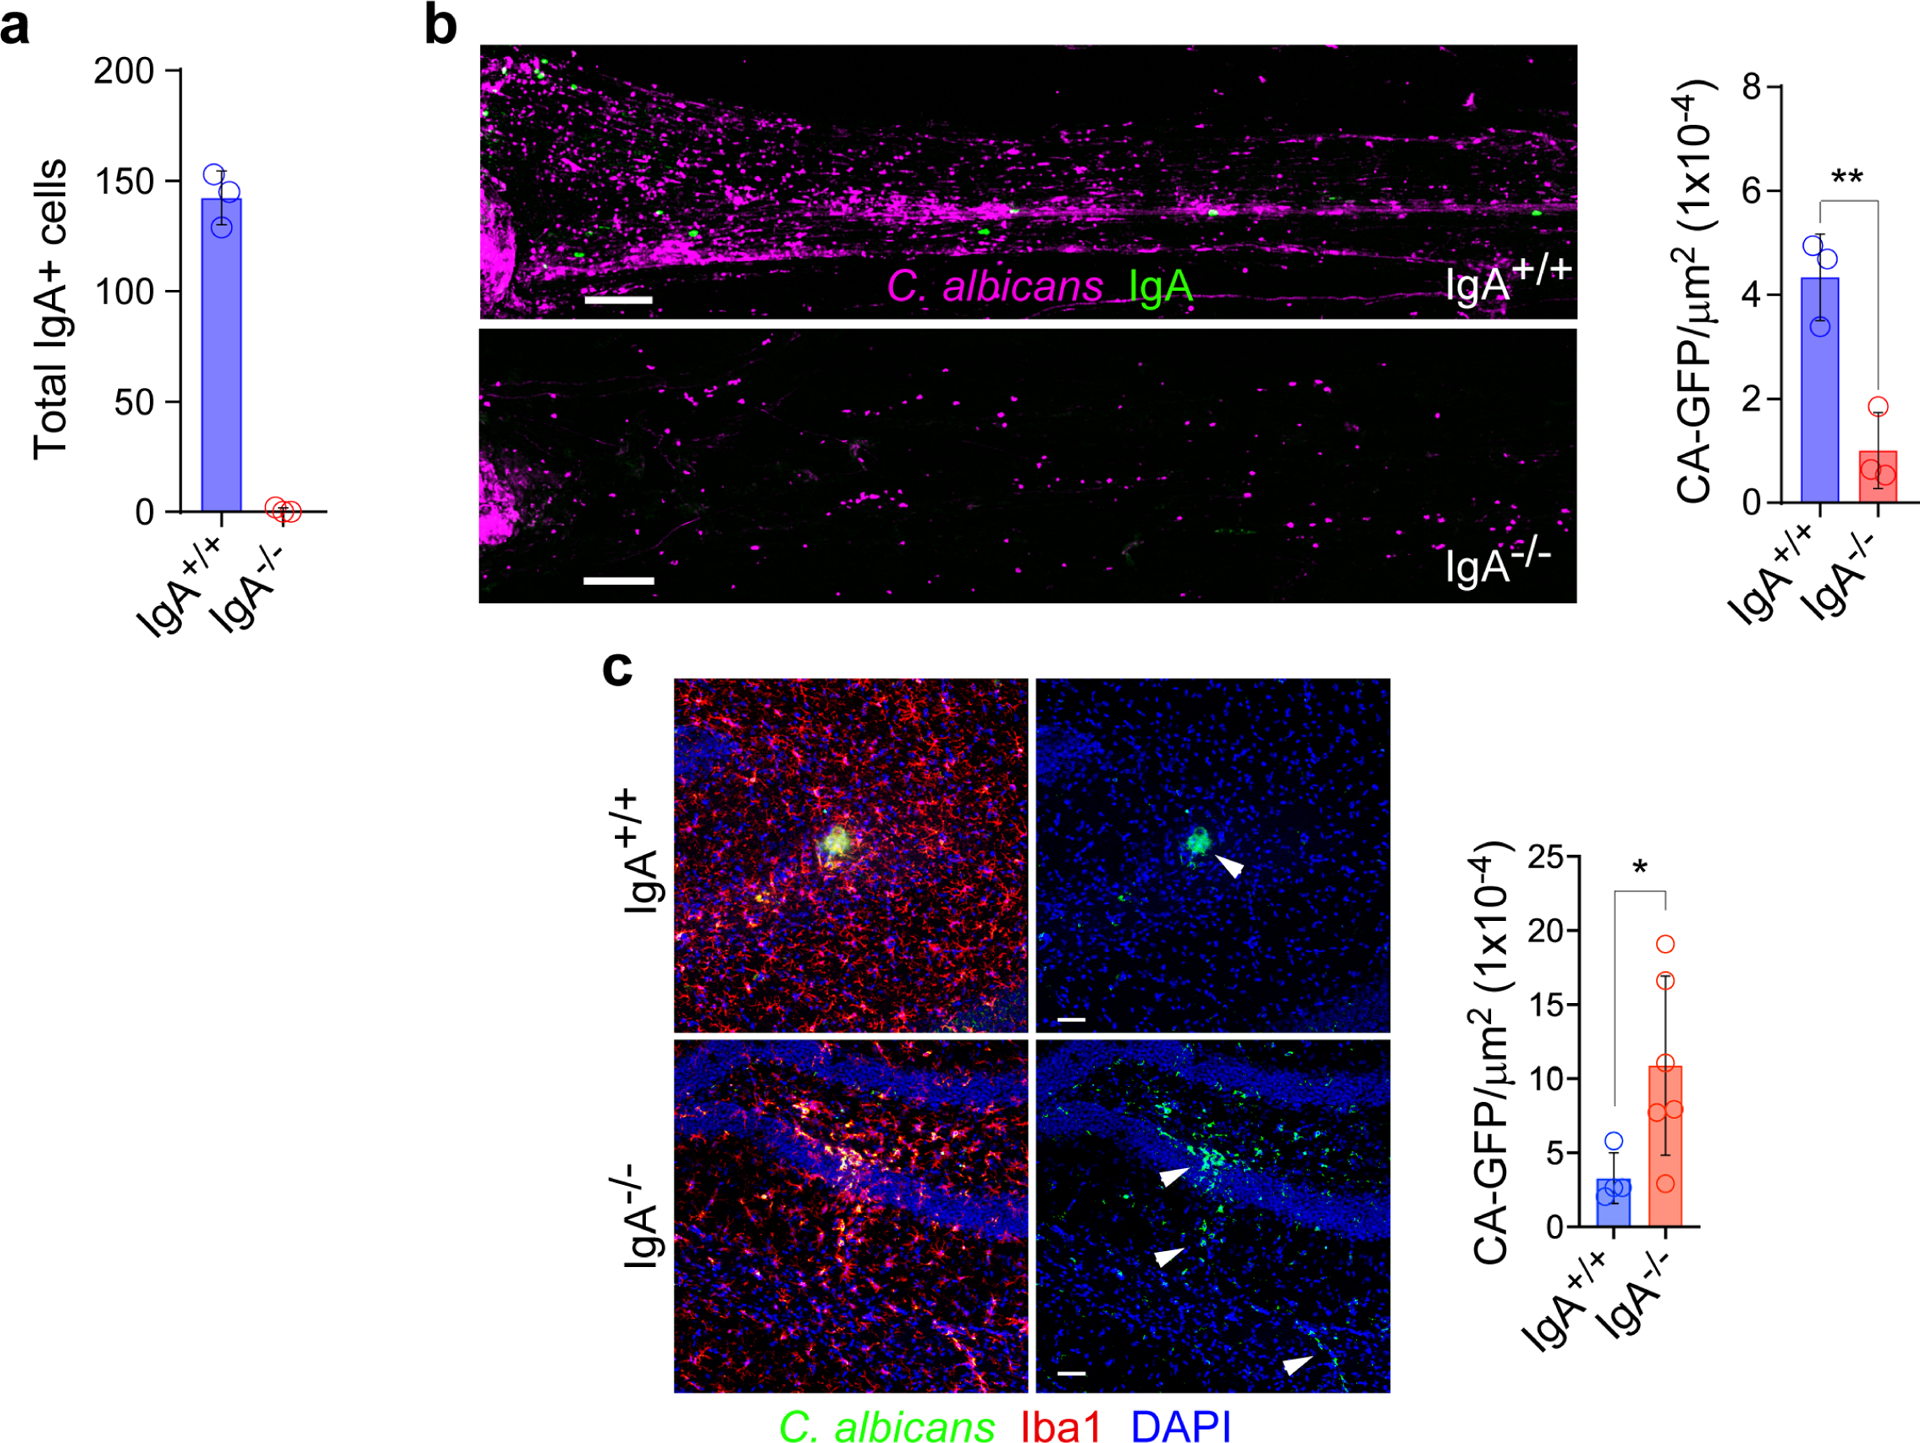
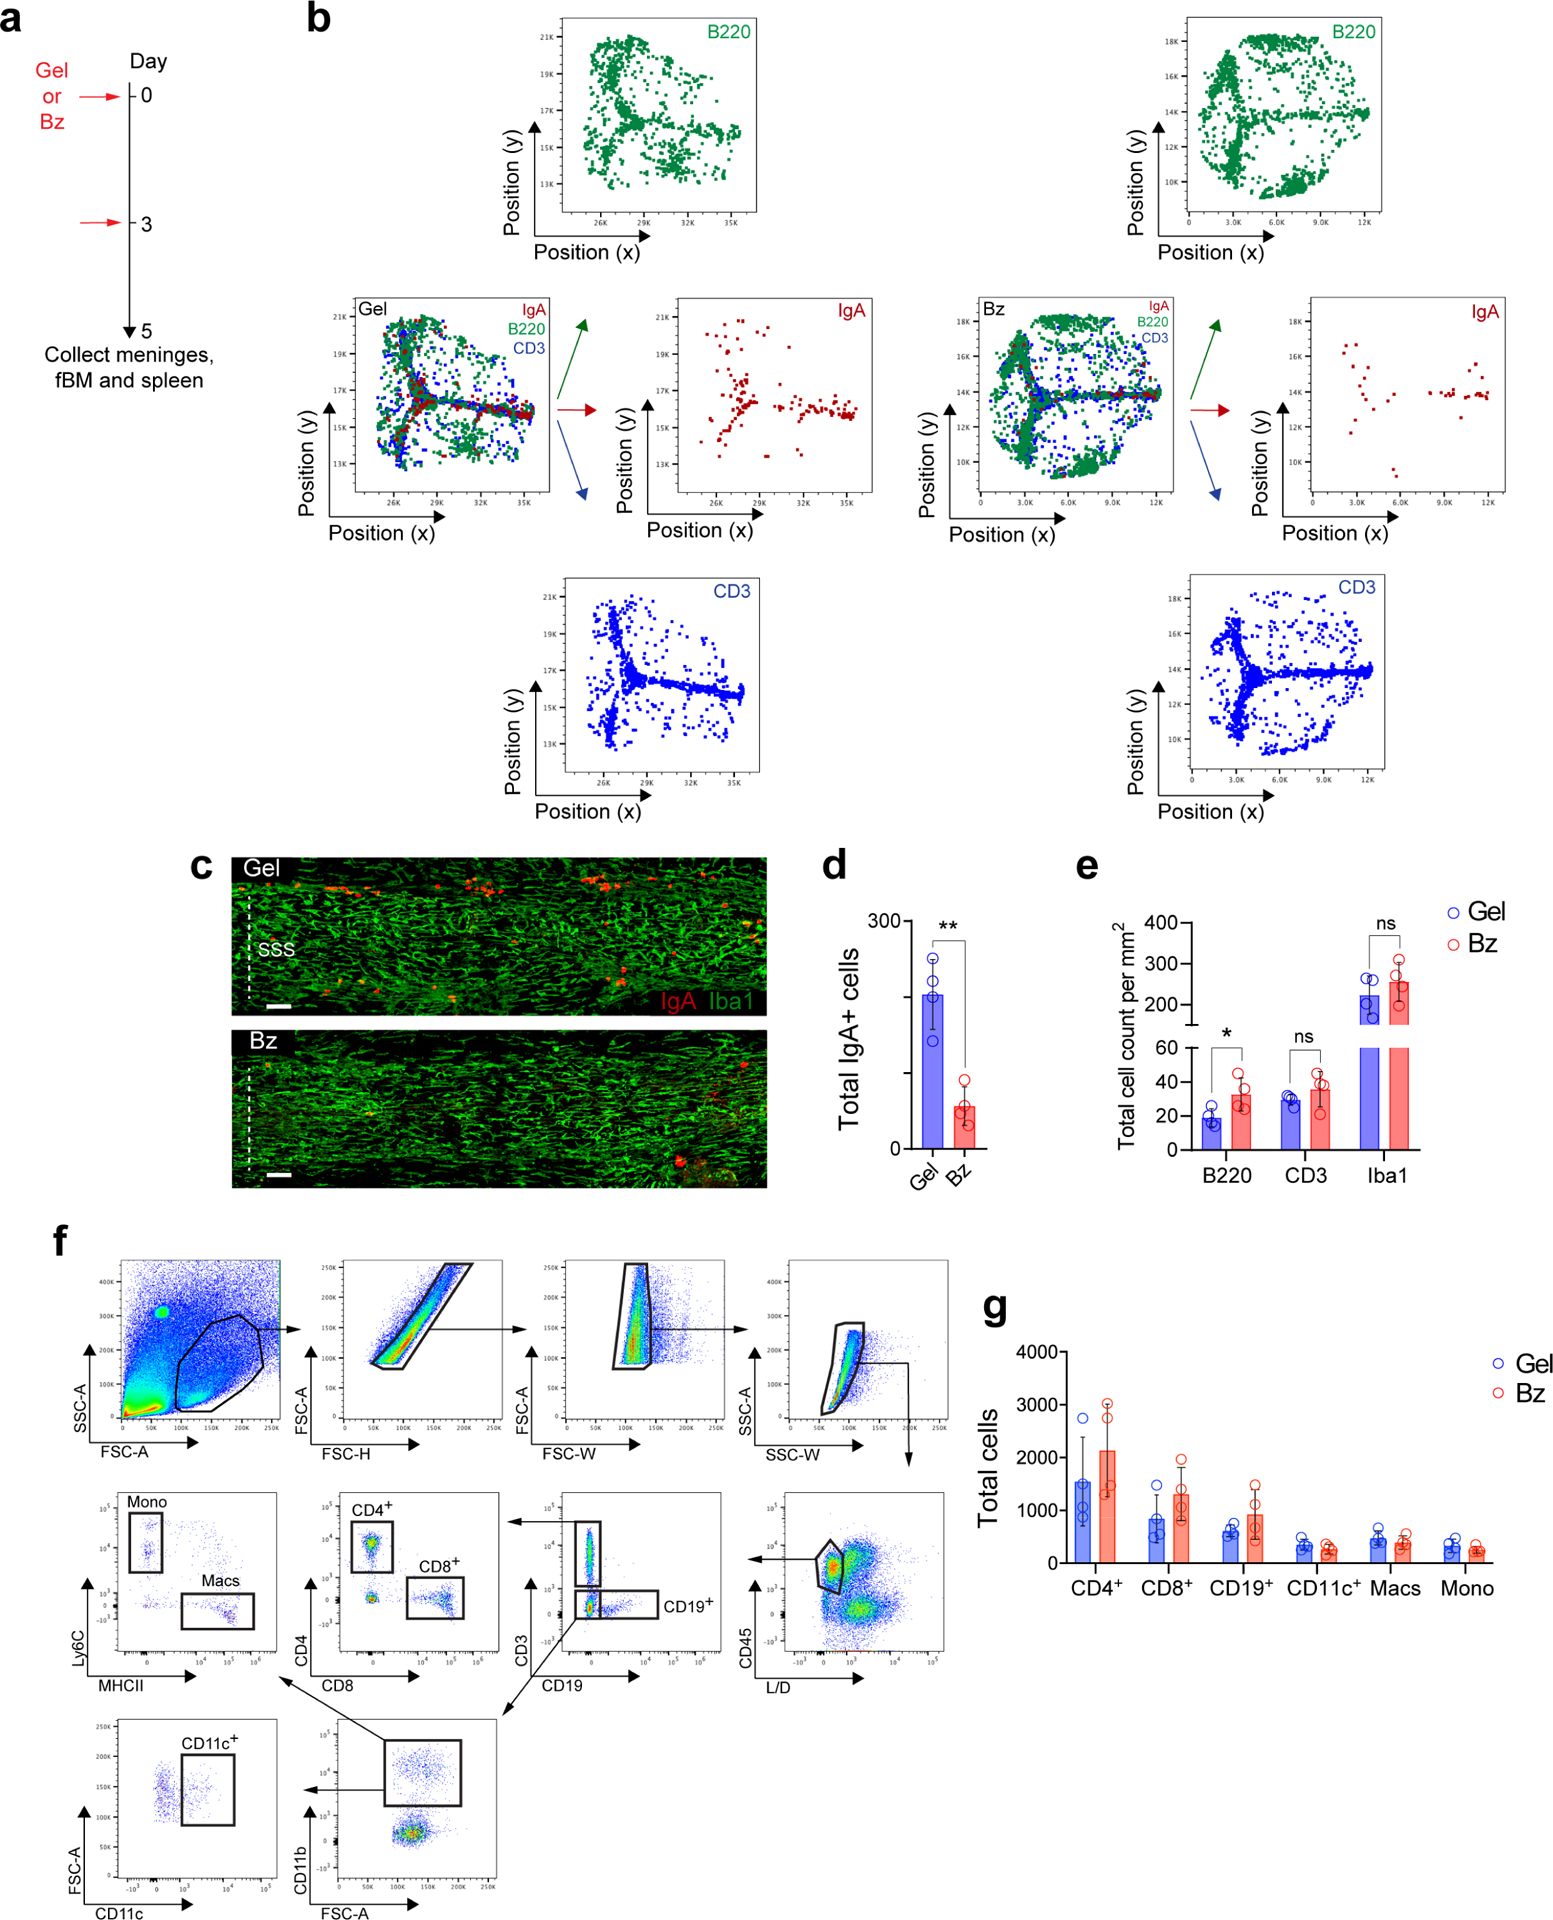
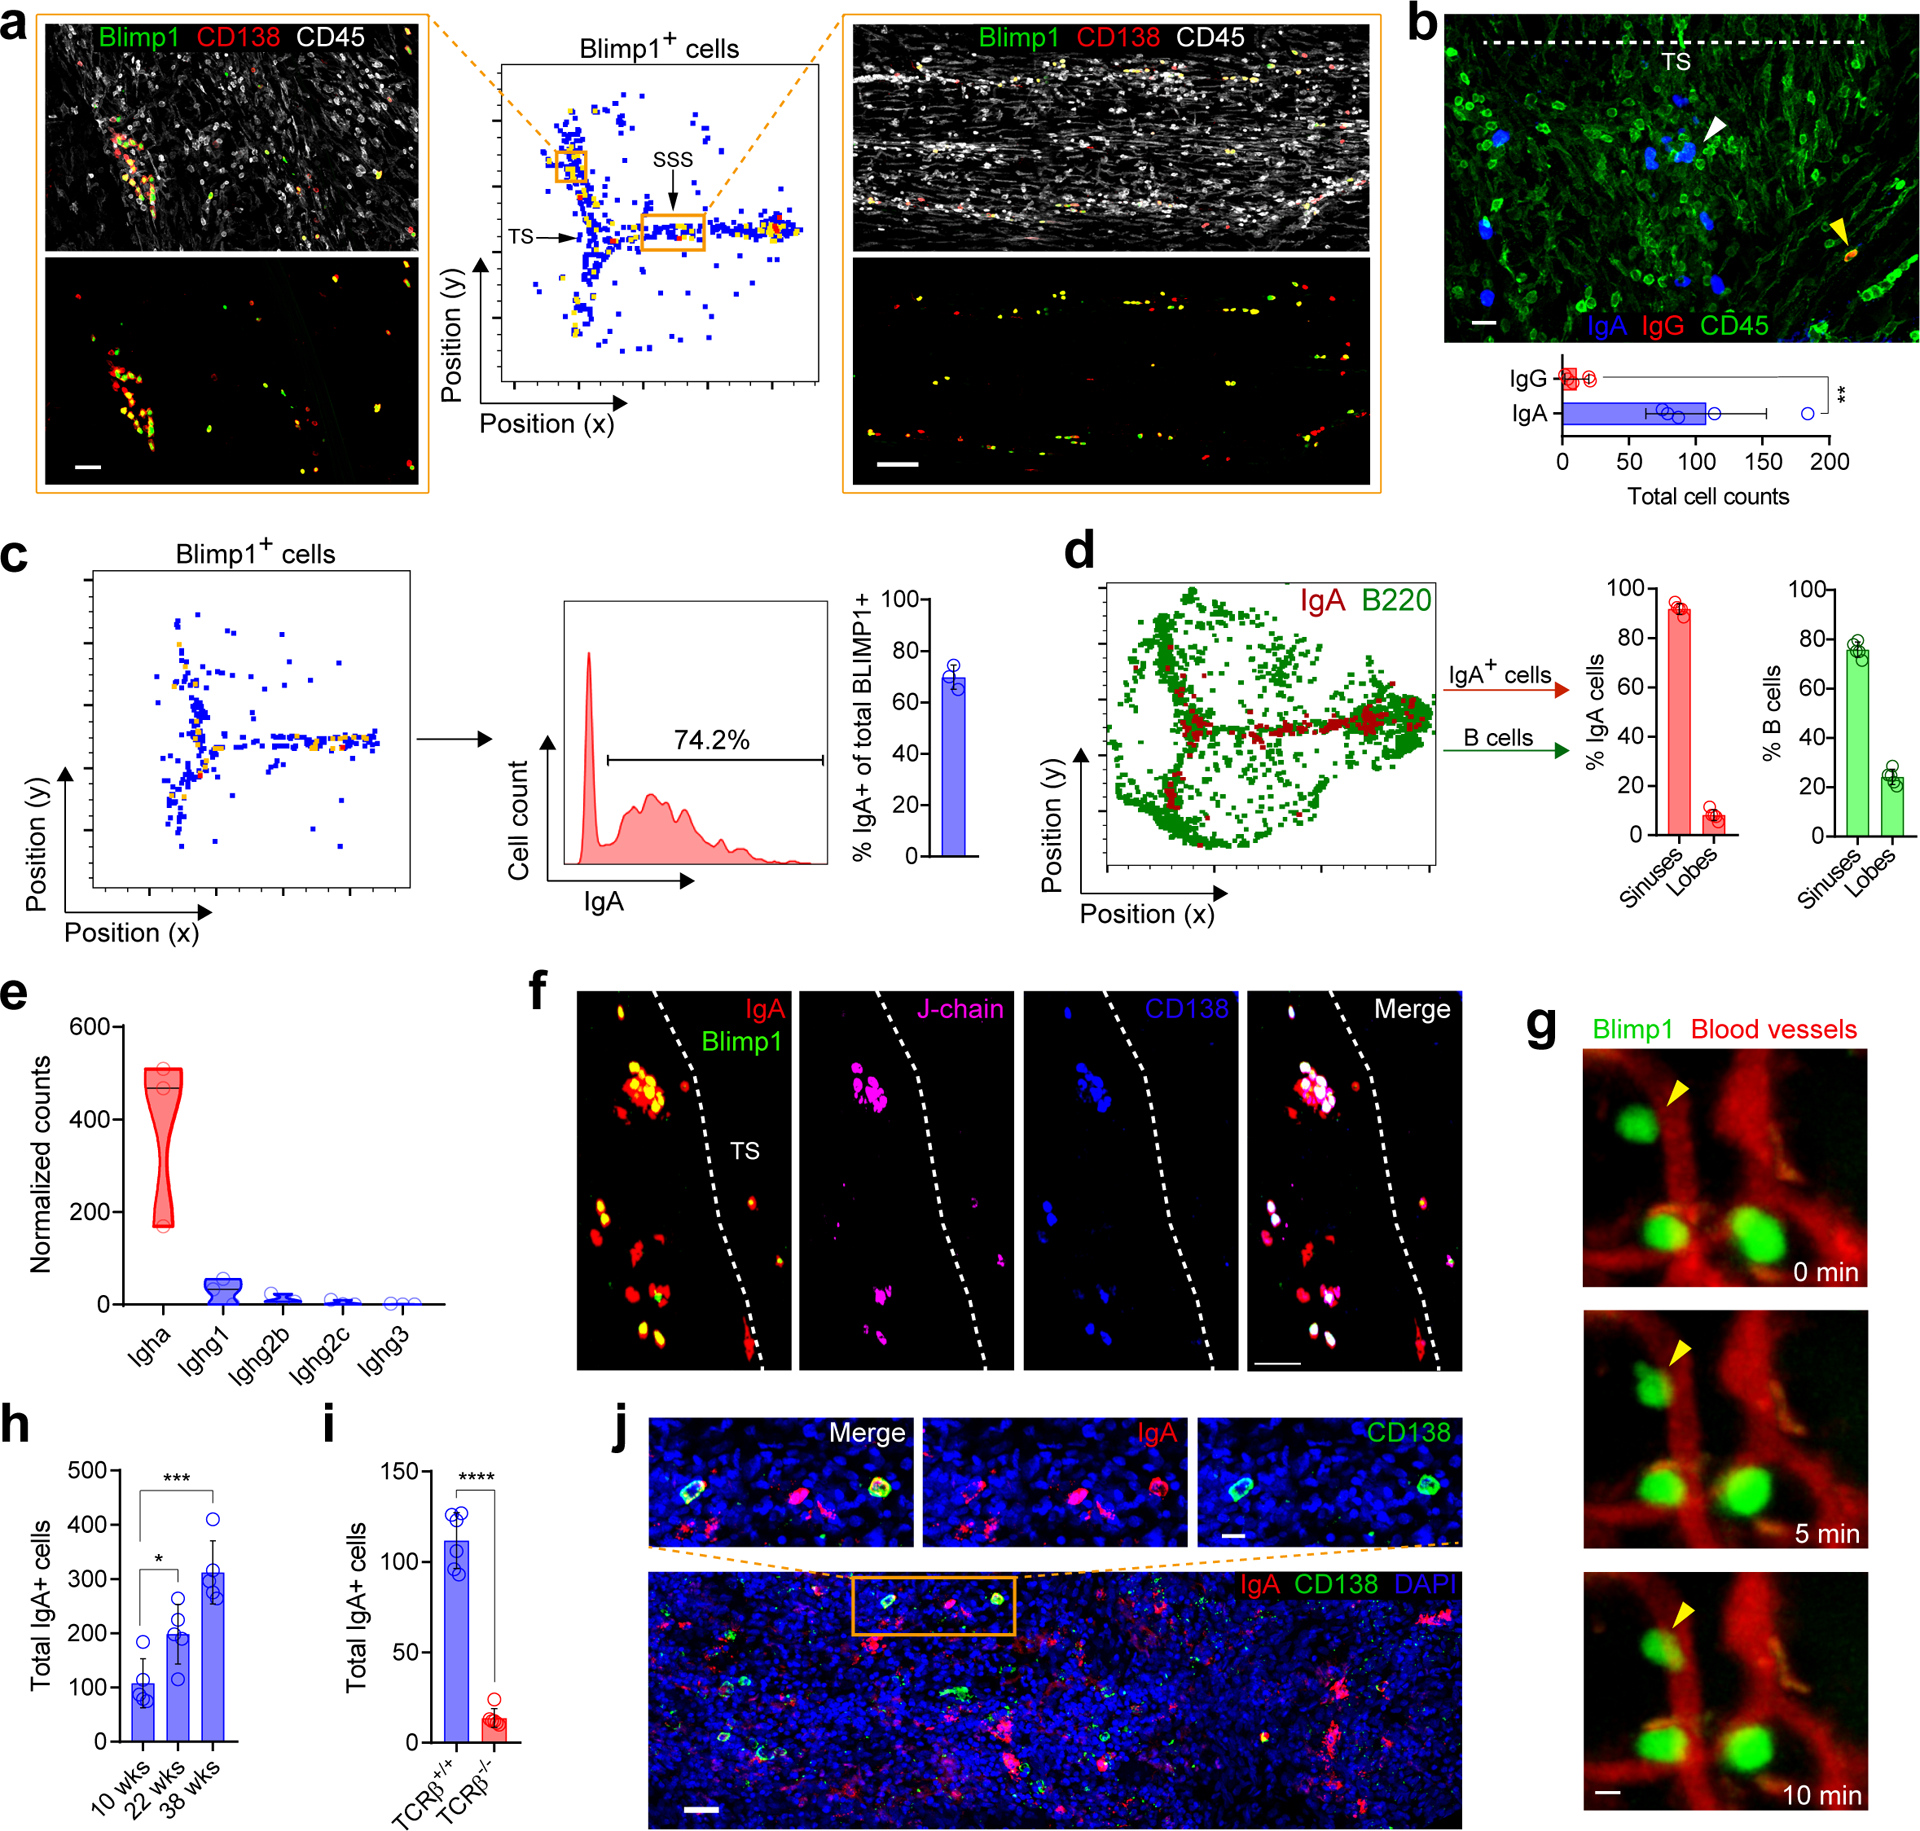
The central nervous system has historically been viewed as an immune-privileged site, but recent data have shown that the meninges-the membranes that surround the brain and spinal cord-contain a diverse population of immune cells1. So far, studies have focused on macrophages and T cells, but have not included a detailed analysis of meningeal humoral immunity. Here we show that, during homeostasis, the mouse and human meninges contain IgA-secreting plasma cells. These cells are positioned adjacent to dural venous sinuses: regions of slow blood flow with fenestrations that can potentially permit blood-borne pathogens to access the brain2. Peri-sinus IgA plasma cells increased with age and following a breach of the intestinal barrier. Conversely, they were scarce in germ-free mice, but their presence was restored by gut re-colonization. B cell receptor sequencing confirmed that meningeal IgA+ cells originated in the intestine. Specific depletion of meningeal plasma cells or IgA deficiency resulted in reduced fungal entrapment in the peri-sinus region and increased spread into the brain following intravenous challenge, showing that meningeal IgA is essential for defending the central nervous system at this vulnerable venous barrier surface.


Conflict of interest statement

Competing interests. The authors declare no competing interests.

Figures

Extended Data Fig. 1:
Extended Data Fig. 1:. Anatomical localization of dural B cells and IgA+ cells.
a, Representative flow cytometric plot of meningeal CD19+B220+ cells from a naïve B6 mouse with a histogram depicting CD79b expression on this population of cells relative to CD11b+ myeloid cells. The flow cytometric plot depicts the proportion of naïve (IgD+IgM+) and class-switched (CS, IgDIgM) B cells of total CD19+B220+ CD79b+ cells, which is quantified in the bar graph (mean ± s.d., n = 5 mice). b, Representative image of a meningeal whole-mount from a Prdm1EYFP/+ mouse stained with IgA (red) and CD138 (blue) showing co-localization with Blimp1-EYFP+ cells (green) (scale bar, 50 μm). Inset represents a higher magnification of the highlighted box (scale bar, 30 μm); the dotted white line depicts the lumen of the transverse sinus (TS). c, Image of a meningeal whole-mount from a naive B6 mouse immunolabeled for IgA (red) and B220 (green) displaying the localization of tissue-resident B cells and IgA+ cells in the dura mater (scale bar, 1000 μm). The arrows depict the TS and superior sagittal sinus (SSS). d, Normalized counts from RNASeq of meninges from SPF and GF mice for the indicated genes. Normalized counts calculated using DESeq (n=3 mice per group as a boxplot). e, Representative image of the peri-SSS region from a naïve B6 mouse stained for CXCR4 (red), B220 (green) and IgA (blue) (scale bar, 50 μm). f, Representative image of IgA (red) and CD138 (green) immunolabeling of whole-mount human dura mater in the lobe area with DAPI (blue, 4′,6-diamidino-2-phenylindole) in blue (scale bar, 30 μm).
Extended Data Fig. 2:
Extended Data Fig. 2:. Bacterial diversity in the gut of DA-GF and DB-GF mouse lines.
a-b, Comparison of microbial richness using Chao1 (a) and diversity using Inverse Simpson indexes (b) between two groups (DA-GF: blue, n=6; DB-GF: green, n=6) is shown. Violin plots are density plots where the width indicates frequency and the box plot shows median, 95% CI and IQR (two-sided Wilcoxon signed-rank test). c, Log 2-fold change in the relative abundance of taxa between two groups (DA-GF: blue, n=6; DB-GF: green, n=6). Only taxa that are significantly different between two groups are shown (Kruskal-Wallis test).
Extended Data Fig. 3:
Extended Data Fig. 3:. Clonal relatedness of IgA+ cells in the gut and meninges of SPF, DA GF and DB GF mice, and meningeal Ig heavy chain gene expression in DSS colitis mice.
a, Hypergeometric test for enrichment (over-representation) of the shared clones between small intestines and meninges. An overlap occurring by random chance would be < 13% or < 154 clones (dotted black line). The observed overlap in clones between meninges and small intestine = 237/1103 clones (red dotted line) and is non-random (p= 4.2 × 10⁻²¹). b, Percentage of lineage trees with most ancestral sequences beginning from meninges (M) or small intestines (SI) in SPF mice inferred after BCR lineage reconstruction. Statistical analysis was performed using an unpaired two-tailed Student’s t test where p<0.05 was considered statistically significant. c, Diversity estimation of CDR3 repertoire represented as a calculated Chao1 estimate after subsampling with 1000 random iterations (left panel). Wilcoxon Rank Sum test was used to determine statistical significance (p < 0.05 considered statistically significant). (Right panel) Relative proportions (frequency of reads) of unique CDR3 amino acid sequences present in each SPF sample is shown, and the top ten most frequent sequences are colored in decreasing shades of grey. Clones after top 10 are not colored (white). d, (Left panels) BCR network of meninges and small intestines from a representative SPF mouse. Colors indicate isotype of BCR sequences. (Right panels) BCR network of IGA clones only from the same mouse. Shared clones between meninges and small intestines are highlighted with the same colors in both networks. Grey nodes and edges indicate BCR sequences/clones not shared between the two tissues. e, Relative proportions (frequency of reads) of unique CDR3aa sequences present in each DA-GF and DB-GF sample is shown, and the top ten most frequent CDR3aa sequences are colored in decreasing shades of grey. Clones after top 10 are not colored (white). f, BCR network of IGA clones from meninges and small intestines in SPF (left panel), DA-GF (middle panel), and DB-GF (right panel) mice. BCR clones shared between meninges and small intestines are highlighted with the same colors in both networks. Grey nodes and edges indicate BCR sequences/clones not shared between the two tissues. g, Normalized counts for the indicated Ig heavy chain genes from bulk RNA-seq of meninges from either DSS-colitic mice or control mice (n = 6 mice per group). Note that, with exception to IGHA (Extended Data Fig. S4d), heavy chain transcript expression did not significantly differ between DSS and control mice.
Extended Data Fig 4:
Extended Data Fig 4:. Accumulation and proliferation of meningeal IgA+ cells after gut-epithelial barrier breach.
a, Representative confocal images of IgA (red) and B220 (green) immunolabeling and Phalloidin staining (grey) of the SSS from a mouse receiving normal drinking water and from a mouse receiving 2% DSS in drinking water for 7 days followed by normal water for 2 weeks to induce acute colitis. (scale bar, 200 μm); the inset is a higher magnification of the highlighted box depicting a cluster of B cells and IgA+ cells associating adjacent to Lyve-1+ lymphatic vessels (yellow) (scale bar, 40 μm). b, Quantification of peri-sinus IgA+ cells from control vs. 2% DSS mice (mean ± s.d., n = 5 mice per group; **P = 0.0079, two-tailed Mann-Whitney test). c, Quantification of B220+ cells along the SSS in control vs. 2% DSS mice (mean ± s.d., n = 4 mice in control group and 5 mice in DSS group; *P = 0.0159, two-tailed Mann-Whitney test). d, Normalized counts of meningeal Igha expression determined by RNA-seq in the denoted groups (n = 6 mice per group). e, A representative image of the TS region of whole-mount tissue from a mouse receiving 2% DSS in drinking water for 7 days followed by normal water for 2 weeks to induce acute colitis. Tissue was stained for B220 (green), Ki-67 (red) and DAPI (blue) (scale bar, 50 μm). The inset to the right depicts a cluster of proliferating B cells (scale bar, 20 μm).
Extended Data Fig 5:
Extended Data Fig 5:. B cell expansion in meninges following systemic candidiasis.
a, Representative flow cytometric plot of CD19+B220+CD79b+ meningeal B cells after intravenous administration of C. albicans, with a bar graph to the right depicting an increase in the total number of naïve (IgD+IgM+) and class-switched (CS, IgDIgM) B cells 3 days after infection (mean ± s.d., n = 4 mice per group Total CD19+B220+CD79b+ B cells **P = 0.0074, Total IgD+IgM+ B cells *P = 0.0103, Total IgDIgM B cells **P = 0.0040, unpaired two-tailed Student’s t-test). b, Representative image of peri-sinus immune cell clusters from whole-mount tissue stained with IgA (white), B220 (red) and CD45 (green) from a mouse 2 days post systemic candida infection showing GFP-C. albicans in purple (scale bar, 50 μm). The inset represents a higher magnification image of the highlighted region displaying IgA+ cells and diffuse IgA signal in regions with pathogen sequestration (scale bar, 20 μm); yellow arrowhead depicts an extracellular GFP-C. albicans cell, whereas the turquoise arrowhead shows GFP-C. albicans signal within a CD45+ leukocyte. c, Representative image of the superior sagittal sinus (SSS) region from the indicated groups, stained for B220 (green) and Ki-67 (red), showing a peri-SSS cluster of Ki-67+B220+ cells 3 days after infection (scale bar, 50 μm). The inset to the right represents a higher magnification of the highlighted box. d, Representative image of the SSS region in a B6 mouse one week after systemic candida infection immunolabelled for IgA (blue), B220 (green) and AID (white). The yellow arrowheads depict AID-expressing IgA+ cells and the red arrowhead depicts AID-expressing B220+ cells (scale bar, 40 μm).
Extended Data Fig. 6:
Extended Data Fig. 6:. Distribution of C. albicans in IgA-deficient mice.
a, Quantification of peri-sinus IgA+ cells in wild type (WT) vs. IgA-deficient animals by confocal imaging of IgA-stained whole-mount tissue (n = 3 mice per group). b, Representative images of the SSS immunolabeled for IgA (green) from a wild type (WT) vs. IgA-deficient mouse 2 days after i.v. administration of GFP-C. albicans shown in purple (scale bar, 150 μm). Quantification of GFP-C. albicans+ puncta along the SSS normalized by area in each group is shown in the bar graph (mean ± s.d., n = 3 mice per group, **P = 0.0065, unpaired two-tailed Student’s t-test). c, Representative images captured in the hippocampus of a WT vs. IgA-deficient mouse stained for Iba1 (red) 2 days after i.v. administration of GFP-C. albicans (shown in green; white arrowheads) (scale bar, 50 μm). Quantification of hippocampal GFP-C. albicans+ puncta normalized by area is shown in the bar graph. Each data point represents the average of four serial hippocampal images from a single animal (mean ± s.d., n = 4 WT mice and 6 IgA−/− mice, *P =0.0428, unpaired two-tailed Student’s t-test).
Extended Data Fig. 7:
Extended Data Fig. 7:. Local effects of bortezomib-mediated meningeal plasma cell depletion.
a, Schematic paradigm of sub-scalp administration of either vehicle control hydrogel (Gel) or bortezomib-containing hydrogel (Bz) for meningeal plasma cell depletion. b, Representative histo-cytometry dot plots from meningeal whole-mounts immunolabeled for IgA (red), B220 (green) and CD3 (blue) from either a mouse injected with Gel or Bz. c, Representative confocal images of IgA (red) and Iba1 (green) immunolabeling in whole-mount meninges of the SSS region, depicting the presence of peri-sinus IgA+ cells and macrophages in a mouse administered either Gel or Bz (scale bar, 100 μm). d, Quantification of peri-sinus IgA+ cells in mice injected with either Gel or Bz, as assessed by immunohistochemical analysis of whole-mount tissue (mean ± s.d., n = 4 mice per group; **P = 0.0014, unpaired two-tailed Student’s t-test). e, Quantification of peri-sinus B220+ cells (B cells), CD3+ cells (T cells) and Iba1+ cells (macrophages) from immunolabeling of meningeal whole-mounts in mice administered either Gel or Bz. Total cell counts were normalized by area (mean ± s.d., n = 4 mice per group; B220+ cells *P = 0.0473, CD3+ cells P = 0.2897, Iba1+ cells P = 0.3716, unpaired two-tailed Student’s t-test; ns, not significant). f, Gating strategy for flow cytometric analysis of meningeal immune cell subsets following Bz treatment. g, Bar graph depicting the total cell counts of the indicated immune cell populations in Gel- or Bz-treated animals (mean ± s.d., n = 4 mice per group; no statistically significant changes were noted in each group).
Extended Data Figure 8:
Extended Data Figure 8:. Effects of bortezomib-mediated meningeal plasma cell depletion on bone marrow and spleen compartments.
a, Gating strategy for flow cytometric analysis of spleen and bone marrow plasma cells in the protocol depicted in Fig. S5b. b, Representative flow cytometric plots showing CD138+ plasma cells in the spleen from either Gel- or Bz-treated mice. c, Quantification of absolute numbers of splenic plasma cells by flow cytometry in either Gel- or Bz-treated mice (mean ± s.d., n = 4 mice per group; P = 0.4693, unpaired two-tailed Student’s t-test; ns, not significant). d, Representative FACS plots of bone marrow plasma cells and IgA+ plasma cells in either Gel or Bz treated mice. e, Flow cytometric quantification of absolute numbers of total bone marrow plasma cells and IgA+ plasma cells in Gel- or Bz-treated mice (mean ± s.d., n = 4 mice per group; Total CD138+B220 cells P = 0.1369, Total CD138+B220IgA+ cells P = 0.1556, unpaired two-tailed Student’s t-test; ns, not significant). f, Illustration highlighting the role of gut-educated IgA+ plasma cells along the dural sinuses in entrapping blood-borne microbes and protecting the brain from infection.
Fig. 1:
Fig. 1:. IgA plasma cells are localized adjacent to the dural sinuses in murine and human meninges.
a, Confocal images of plasma cells along the transverse sinus (TS; scale bar, 70 μm) and superior sagittal sinus (SSS; scale bar, 100 μm) from murine whole-mount meninges stained with CD138 (red) and CD45 (white) with corresponding histo-cytometric plot of Blimp1-expressing cells (green) from a Prdm1EYFP/+ mouse. b, Representative image of IgA (blue), IgG (red) and CD45 (green) immunolabeling on whole-mount meninges (scale bar, 30 μm) and quantification of peri-sinus IgA+ and IgG+ cells below. White arrowhead depicts abluminal IgA+ cells and yellow arrowhead depicts an abluminal IgG+ cell; the dotted line shows the lumen of the TS (mean ± s.d., n = 5 mice; **P = 0.0016, unpaired two-tailed Student’s t-test; data are representative of two independent experiments). c, Representative histo-cytometric plot of Blimp1+ cells in a meningeal whole-mount immunolabeled for IgA from a Prdm1EYFP/+ mouse, with the proportion of Blimp1+ cells that co-express IgA quantified in the bar graph (mean ± s.d., n = 3 mice). d, Histo-cytometric plot from meningeal whole-mount stained with B220 (green) and IgA (red), with quantification of cells in the lobes (frontal, parietal and occipital lobes) and peri-sinus regions (mean ± s.d., n = 5 mice). e, Normalized counts of the denoted class-switched immunoglobulin heavy chain transcript expression from the B6 meninges analyzed by RNA-seq (n = 3 mice). f, Confocal image of the TS region from Prdm1EYFP/+ mouse whole-mount tissue immunolabeled for IgA (red), J-chain (pink) and CD138 (blue), with Blimp1-EYFP+ cells labeled in green (scale bar, 50 μm). g, Representative time lapse captured by two-photon microscopy through a thinned skull of a Prdm1EYFP/+ mouse, displaying Blimp1-EYFP+ cells (green) and peri-sinus vasculature (red) (scale bar, 5 μm); arrowheads denote relatively immobile Blimp1-EYFP+ cells adjacent to dural vasculature. h, Quantification of meningeal IgA+ cells in 10-week, 22-week and 38-week-old B6 mice (mean ± s.d., n = 5 mice per group; 10 weeks (wks) vs. 22 wks *P = 0.0215, 10 wks vs. 38 wks ***P = 0.0003, unpaired two-tailed Student’s t-test). i, Quantification of peri-sinus IgA-expressing cells by immunohistochemical analysis of meningeal whole-mounts of WT and Tcrb−/− mice (mean ± s.d., n = 6 mice per group; ****P = <0.0001, unpaired two-tailed Student’s t-test, data are representative of two independent experiments). j, Representative image of the luminal aspect of human whole-mount SSS tissue stained with IgA (red), CD138 (green) and DAPI (blue, 4′,6-diamidino-2-phenylindole) (scale bar, 50 μm). The inset above represents a higher magnification of the highlighted box (scale bar, 20 μm).
Fig. 2:
Fig. 2:. Meningeal IgA cells are clonally related to those in the gut and depend on intestinal microbiota.
a, Immunohistochemistry based quantification of peri-sinus meningeal IgA+ and B220+ cells in whole-mount meninges from naive control (Ctrl) versus 6-week oral antibiotic (Abx)-treated B6 mice. Data are compiled from two independent experiments (mean ± s.d., n = 8 mice in Ctrl group and 7 in Abx group; IgA+ cells ***P = 0.0006, B220+ cells P = 0.8157, unpaired two-tailed Student’s t-test; ns, not significant). b, Representative histo-cytometry plots of meningeal whole-mounts stained for IgA (red) and B220 (green) from a specific-pathogen-free (SPF) mouse, a germ-free (GF) mouse and a GF mouse reconstituted with murine gut commensal bacteria by oral gavage (MGC-GF). c, Representative images of IgA (red) and B220 (green) immunolabeling of the SSS from whole-mount meninges from SPF, GF, and MGC-GF mice (scale bar, 100 μm). d, Quantification of peri-sinus IgA+ cells from SPF and GF (left panel); GF mice colonized by oral gavage with a murine gut commensal bacteria (MGC-GF), a human gut microbiome from two separate donors (DA-GF and DB-GF), or segmented filamentous bacteria (SFB-GF); or, GF mice with skin mono-colonized by S. epidermidis (S. epidermidis-GF) or S. aureus (S. aureus-GF) (mean ± s.d., n = 8 SPF mice; 9 GF mice; 5 MGC-GF, DA-GF, DB-GF and S. epidermidis-GF mice; and 4 SFB-GF and S. aureus-GF mice; SPF ****P = <0.0001, MGC-GF ***P = 0.0010, DA-GF ***P = 0.0010, DB-GF ***P = 0.0010, SFB-GF **P = 0.0028, S. epidermidis-GF P = 0.8731, S. aureus-GF P = 0.6350, all statistical comparisons were made with the indicated group against GF group, two-tailed Mann-Whitney test; ns, not significant). e, Normalized counts of meningeal Igha expression by RNA-seq in the denoted groups (n = 3 mice per group). f, Quantification of IgG+ cells along the dural sinuses in the denoted groups (mean ± s.d., n = 5 mice per group; SPF P = 0.2376, DA-GF **P = 0.0079, DB-GF P = 0.9163, all statistical comparisons were made with the indicated group against GF group, two-tailed Mann-Whitney; ns, not significant). g, Representative images of IgA (red) immunolabeling and phalloidin stain (gray) of the SSS region of meningeal whole-mounts from a naive GF mouse (GF naive), or a GF mouse infected with Citrobacter rodentium wild type (GF + wt) or a ΔEspA mutant (GF + ΔEspA) (scale bar, 100 μm). h, Quantification of peri-sinus IgA+ cells from the indicated groups (mean ± s.d., n = 5 mice in naive SPF, naive GF and GF ΔEspA groups and n = 4 in GF wt and SPF wt groups; SPF naive vs. SPF wt *P = 0.0206, GF naive vs. GF wt *P = 0.0159, GF naive vs. GF ΔEspA **P = 0.0079, two-tailed Mann-Whitney test). i, Frequency of IGA BCR clones in small intestines and meninges of SPF mice presented as proportional Euler diagrams. The intersect of the overlapping diagrams represents the frequency of BCR clones shared between the two tissues. The percentage values are calculated relative to total clones in meningeal tissues. j, Antibody lineage tree of representative IGA clone shared between meninges (red nodes) and small intestines (blue nodes) from a SPF mouse. The black node indicates the germline IGA sequences while white nodes indicate inferred sequences. The edge number indicates the distance (the number of the substitutions) between each connecting node. The CDR3 sequences of the shared clone is also shown. Positions of nucleotide bases that are different, resulting in synonymous and non-synonymous amino acid changes, are highlighted.
Fig. 3.
Fig. 3.. Meningeal IgA entraps fungi in the dural sinuses and protects the brain from infection.
a, Representative images of the meningeal SSS from whole-mounts immunolabeled for IgA (red) and B220 (green). Mice were examined at day 0 (D0) after injection of sterile PBS or at day 7 (D7) and 14 (D14) after i.v. administration of 5 × 10⁴ viable C. albicans cells (scale bar, 100 μm). Quantification of peri-sinus B220+ and IgA+ cells at the indicated time points post-infection are displayed in bar graphs (mean ± s.d., n = 4 mice in D0, D4 and D7 groups and 5 mice in D1 group and 3 mice in D21 group; B220+ cells D0 vs D1 *P = 0.0159, IgA+ cells D0 vs. D7 **P = 0.0021, IgA+ cells D0 vs. D21 ****P = <0.0001, unpaired two-tailed Student’s t-test). b, Representative image of a meningeal whole-mount from a mouse 2 days after i.v. administration of GFP-C. albicans displaying sequestration of the pathogen (purple) in the peri-sinus region (scale bar, 1000 μm); the inset is a higher magnification of the highlighted box showing B220+ and CD45+ cells (red) surrounding sequestered GFP-C. albicans (scale bar, 200 μm). c, Representative histo-cytometry plots of meningeal whole-mounts stained for B220+ (green) and IgA+ cells (red) from a mouse that received a sub-scalp injection of control hydrogel (Gel) or bortezomib hydrogel (Bz) to deplete meningeal plasma cells. Bar graph depicts quantification of peri-sinus IgA+ cells from each group (mean ± s.d., n = 8 mice per group; ***P = 0.0001, unpaired two-tailed Student’s t-test, data are representative of three independent experiments). d, Representative SSS images stained for IgA (green) from the indicated groups 2 days following i.v. administration of GFP-C. albicans shown in purple (scale bar, 150 μm). Bar graph shows quantification of GFP-C. albicans+ puncta along the SSS normalized by area in each group (mean ± s.d., n = 4 mice per group; **P = 0.0021, unpaired two-tailed Student’s t-test, data are representative of three independent experiments). e, Representative hippocampal images stained for Iba1 (red) from the indicated groups 2 days after GFP-C. albicans infection (shown in green; white arrowheads) (scale bar, 50 μm). f, Bar graph depicts quantification of hippocampal GFP-C. albicans+ puncta (mean ± s.d., n = 5 mice per group, **P =0.0046, unpaired two-tailed Student’s t-test). g, Quantification of C. albicans genome copies in the brain by qPCR 3 days after i.v. administration of C. albicans in the indicated groups (mean ± s.d., n = 10 mice per group **P = 0.0021, two-tailed Mann-Whitney test). h, Survival of mice in the indicated groups after i.v. injection of C. albicans (n = 7 mice per group; ***P = 0.0009, Mantel-Cox test, data shown as percent survival over time and representative of two independent experiments).

Comment in

References

    1. Korin B et al. High-dimensional, single-cell characterization of the brain’s immune compartment. Nat Neurosci 20, 1300–1309, doi:10.1038/nn.4610 (2017). - DOI - PubMed
    1. Schuchardt F et al. In vivo analysis of physiological 3D blood flow of cerebral veins. Eur Radiol 25, 2371–2380, doi:10.1007/s00330-014-3587-x (2015). - DOI - PubMed
    1. Louveau A et al. Structural and functional features of central nervous system lymphatic vessels. Nature 523, 337–341, doi:10.1038/nature14432 (2015). - DOI - PMC - PubMed
    1. Rua R & McGavern DB Advances in Meningeal Immunity. Trends Mol Med 24, 542–559, doi:10.1016/j.molmed.2018.04.003 (2018). - DOI - PMC - PubMed
    1. Herz J, Filiano AJ, Smith A, Yogev N & Kipnis J Myeloid Cells in the Central Nervous System. Immunity 46, 943–956, doi:10.1016/j.immuni.2017.06.007 (2017). - DOI - PMC - PubMed

Publication types

MeSH terms

Substances