. 2020 Dec;588(7836):151-156.
doi: 10.1038/s41586-020-2882-8. Epub 2020 Nov 4.

Inhibition of LTβR signalling activates WNT-induced regeneration in lung

Affiliations

Inhibition of LTβR signalling activates WNT-induced regeneration in lung

Thomas M Conlon et al. Nature. 2020 Dec.

Erratum in

  • Publisher Correction: Inhibition of LTβR signalling activates WNT-induced regeneration in lung.
    Conlon TM, John-Schuster G, Heide D, Pfister D, Lehmann M, Hu Y, Ertüz Z, Lopez MA, Ansari M, Strunz M, Mayr C, Angelidis I, Ciminieri C, Costa R, Kohlhepp MS, Guillot A, Günes G, Jeridi A, Funk MC, Beroshvili G, Prokosch S, Hetzer J, Verleden SE, Alsafadi H, Lindner M, Burgstaller G, Becker L, Irmler M, Dudek M, Janzen J, Goffin E, Gosens R, Knolle P, Pirotte B, Stoeger T, Beckers J, Wagner D, Singh I, Theis FJ, de Angelis MH, O'Connor T, Tacke F, Boutros M, Dejardin E, Eickelberg O, Schiller HB, Königshoff M, Heikenwalder M, Yildirim AÖ. Conlon TM, et al. Nature. 2021 Jan;589(7842):E6. doi: 10.1038/s41586-020-03087-6. Nature. 2021. PMID: 33353984 No abstract available.

Abstract

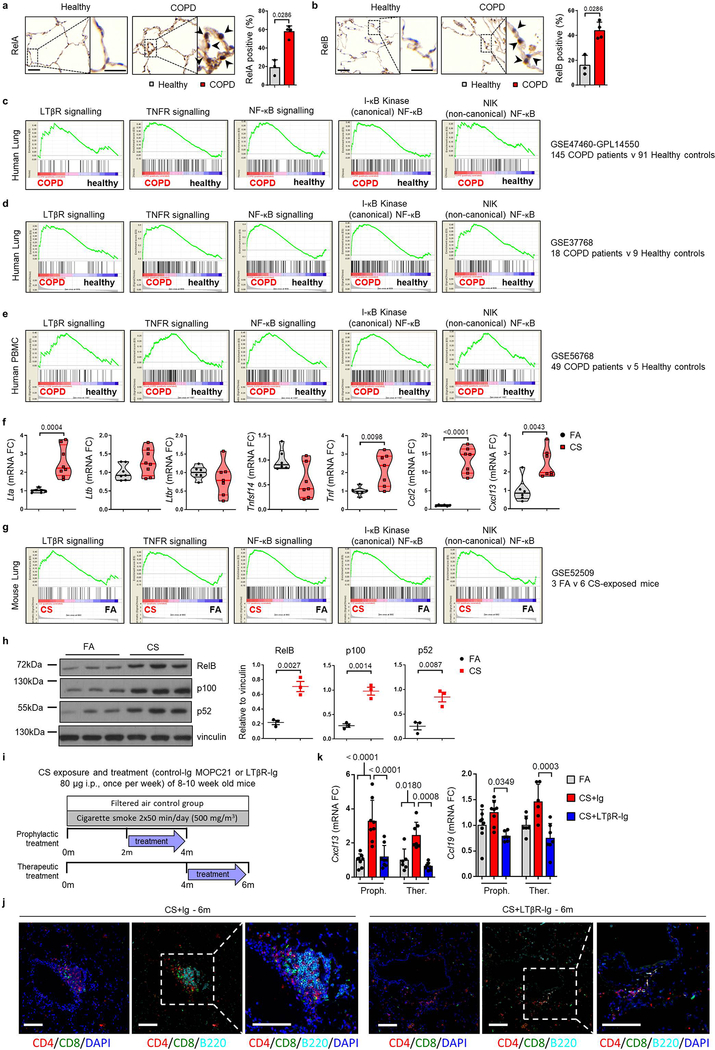
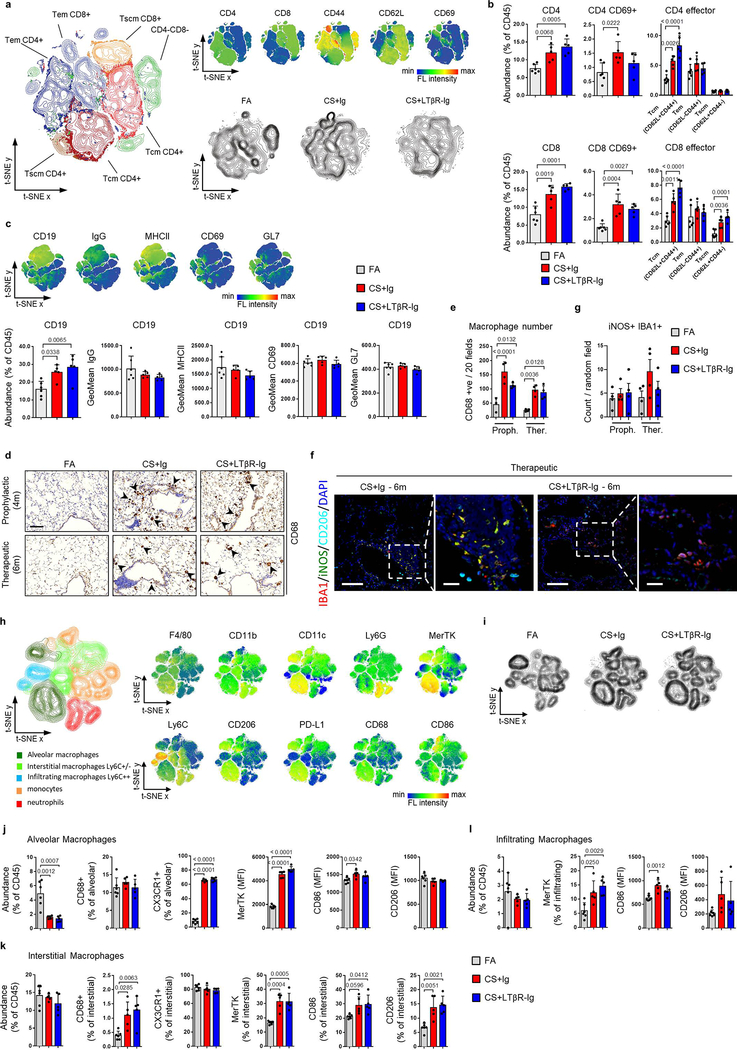
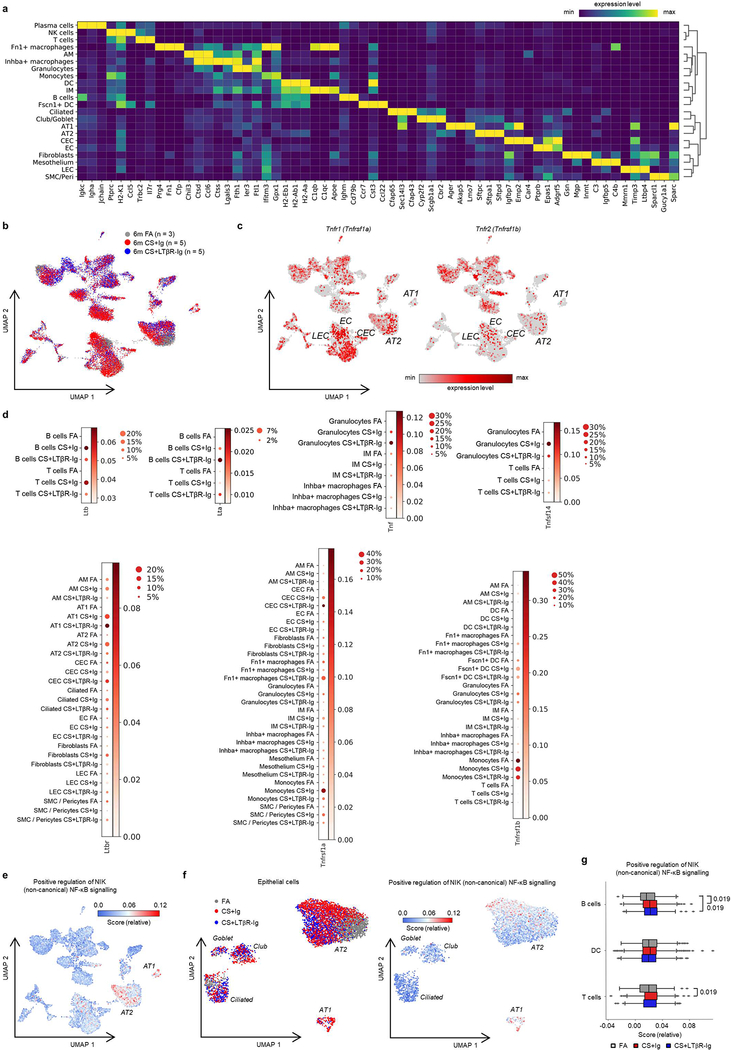
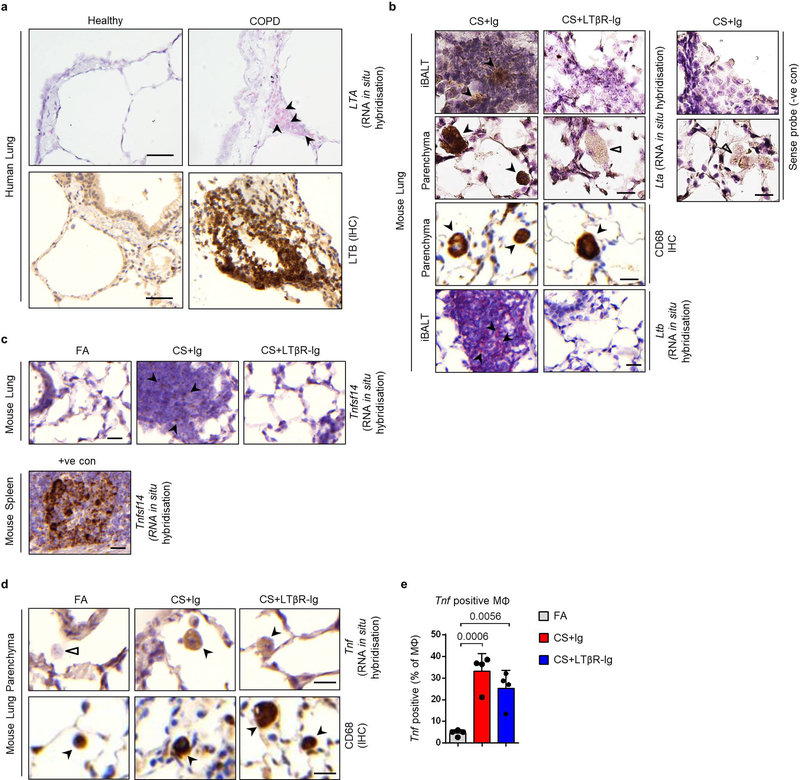
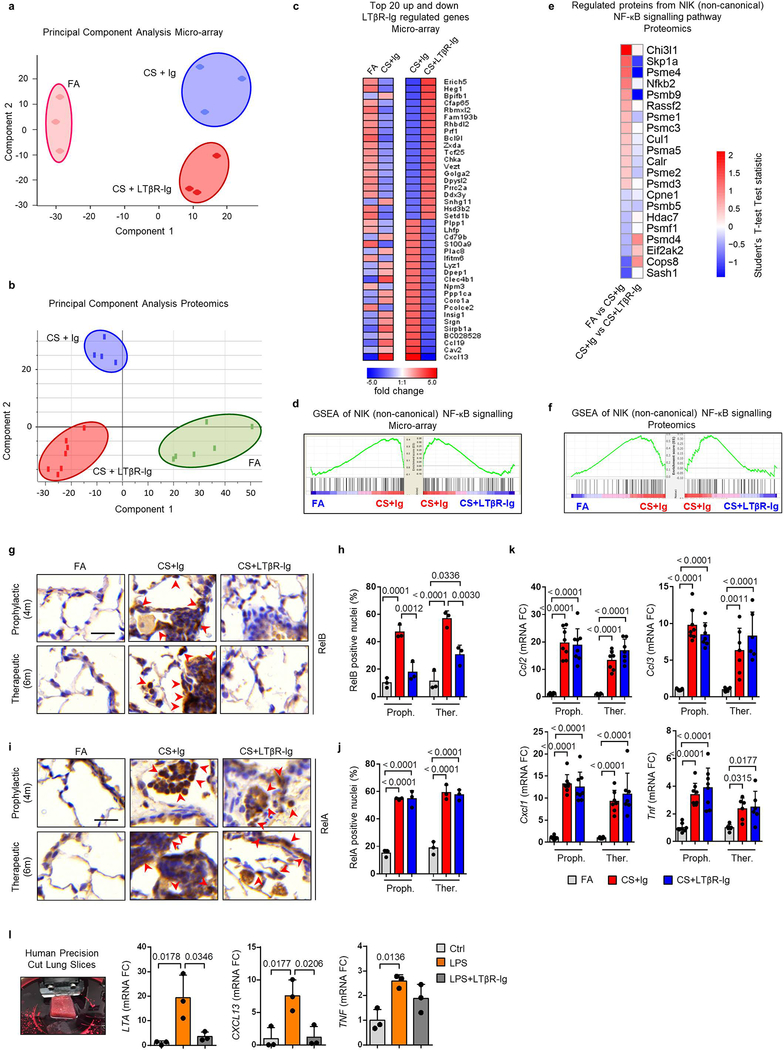
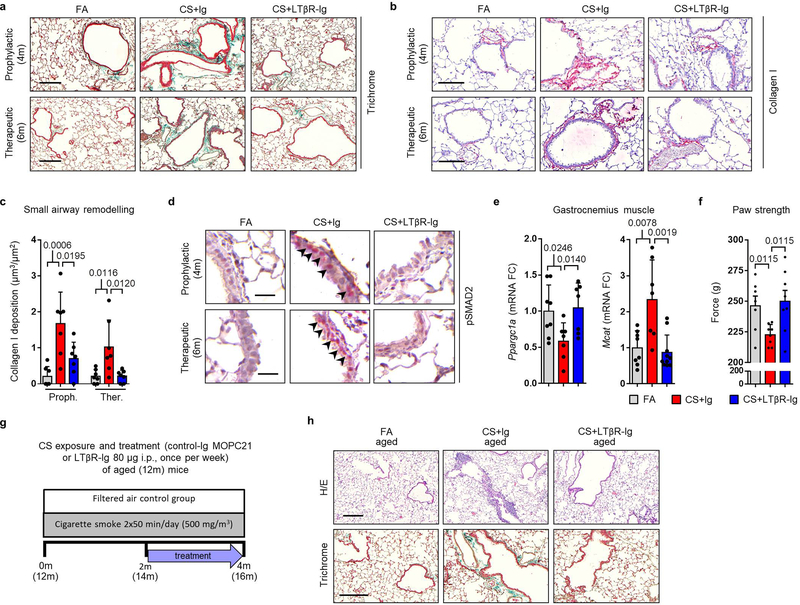
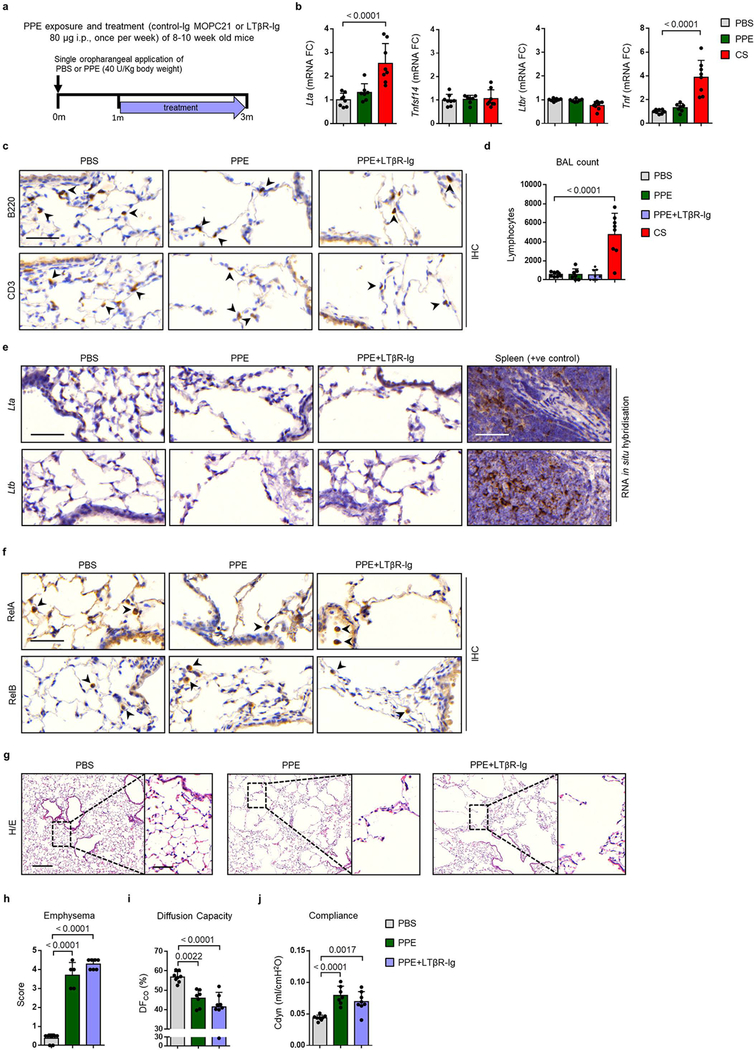
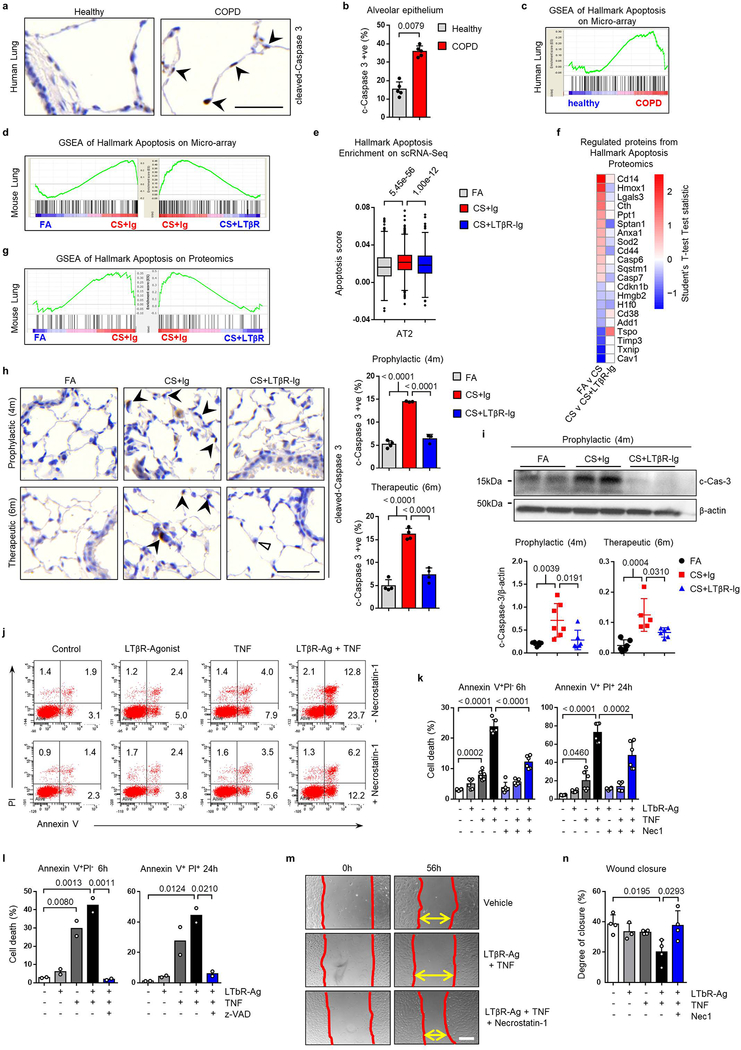
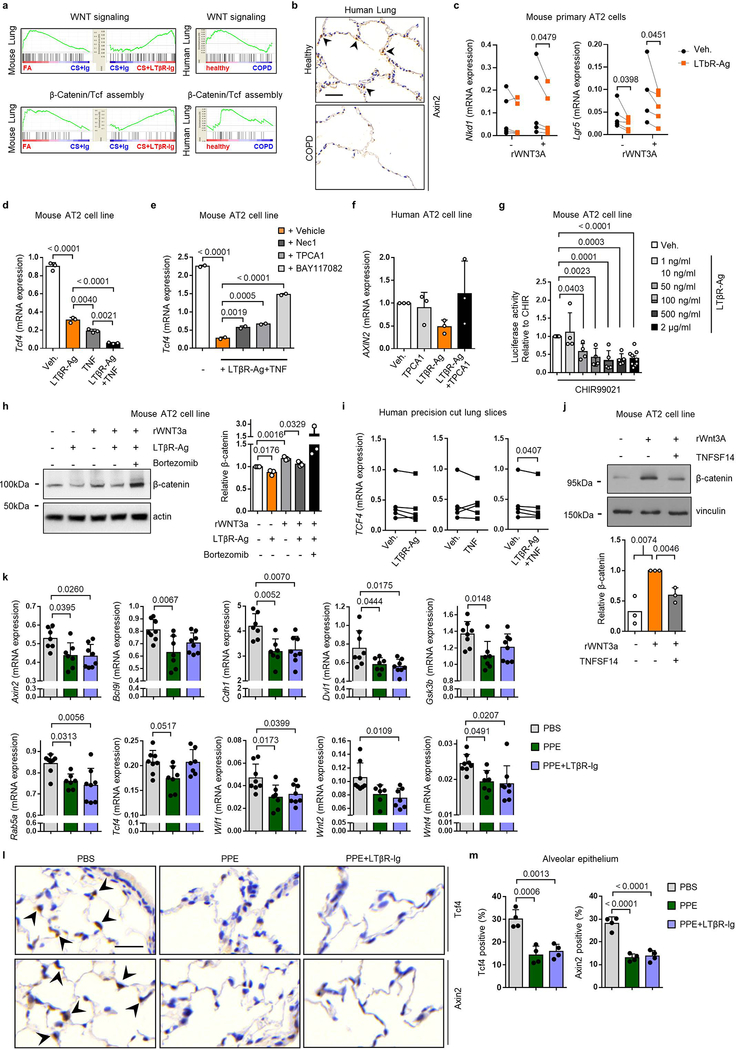
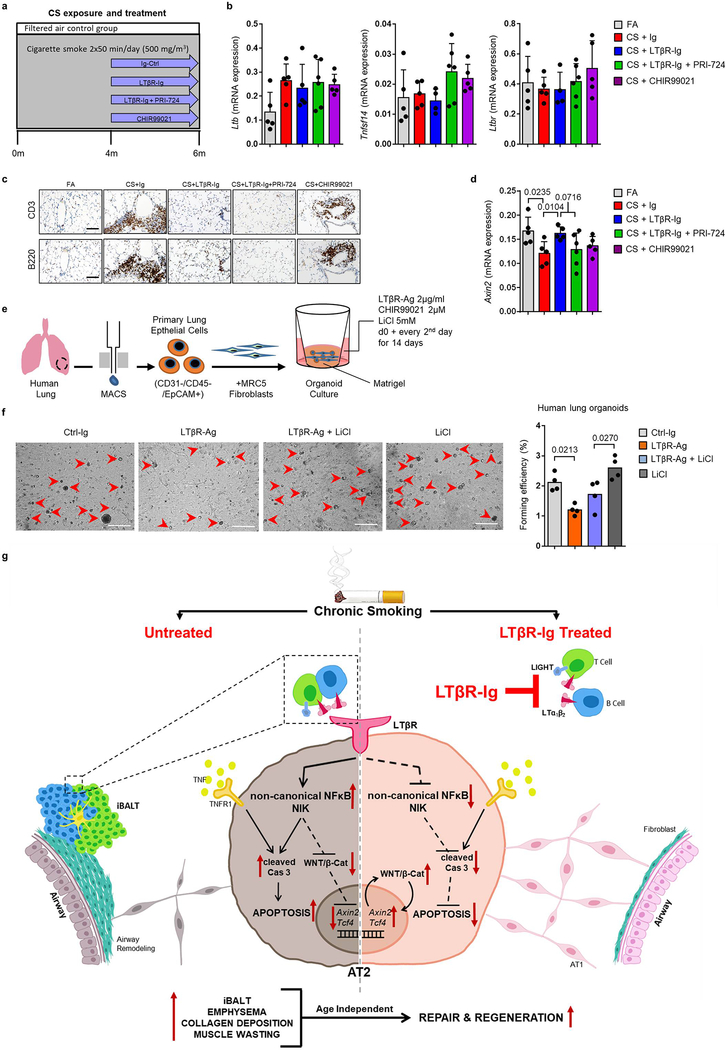
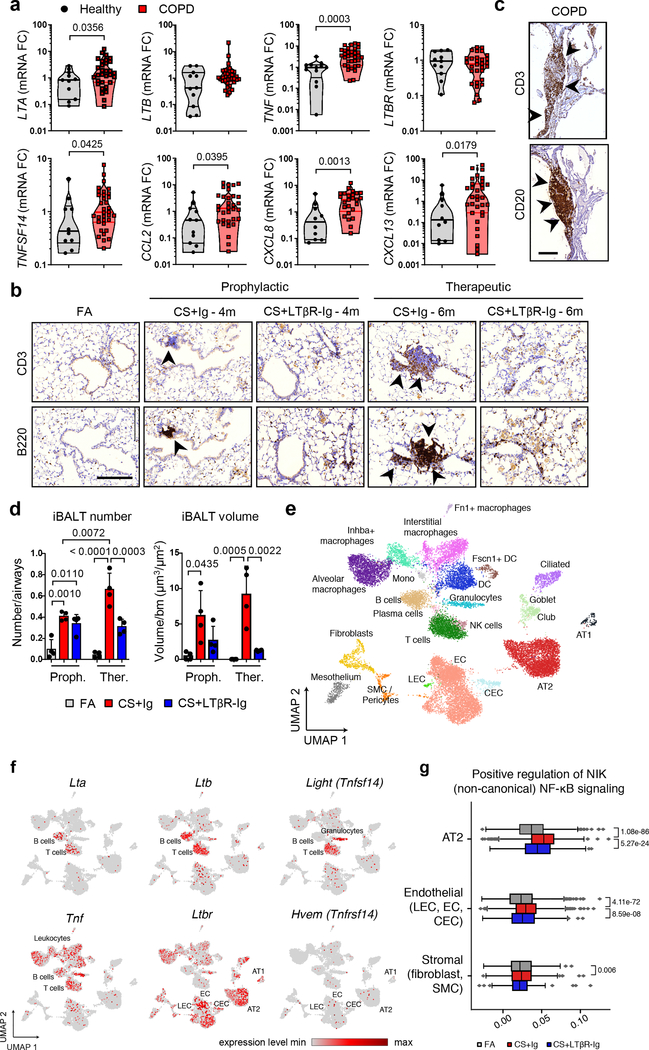
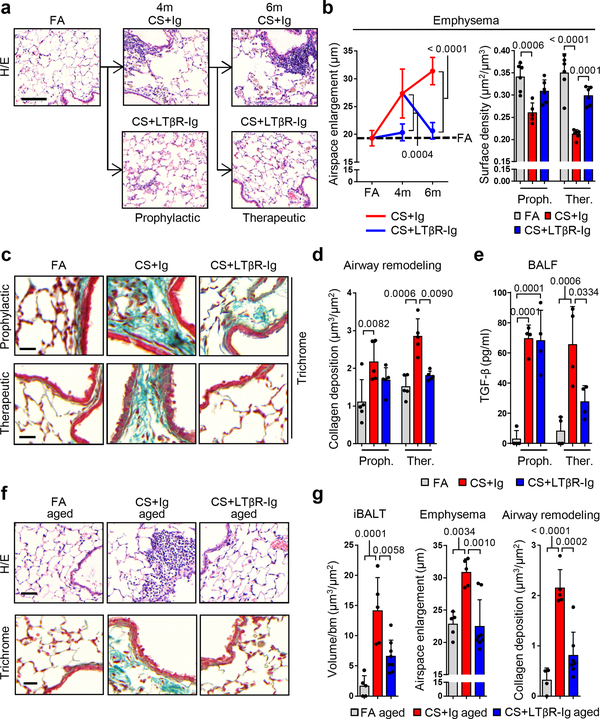
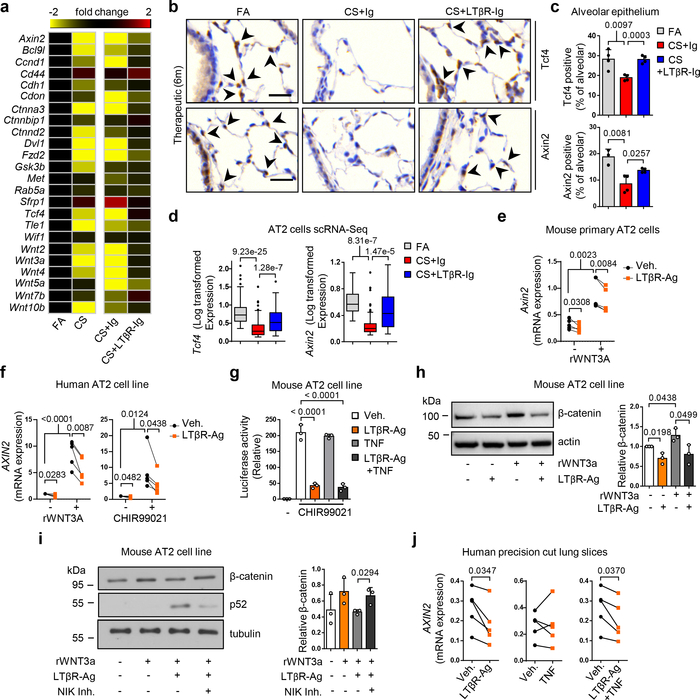
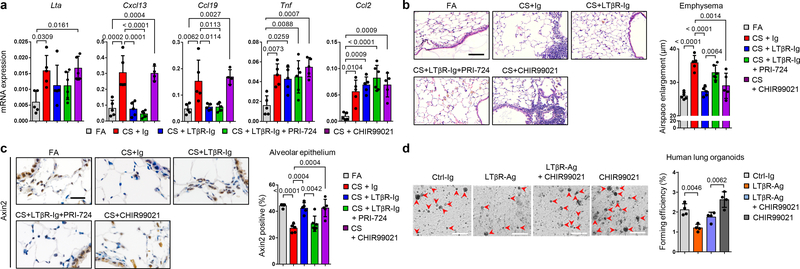
Lymphotoxin β-receptor (LTβR) signalling promotes lymphoid neogenesis and the development of tertiary lymphoid structures1,2, which are associated with severe chronic inflammatory diseases that span several organ systems3-6. How LTβR signalling drives chronic tissue damage particularly in the lung, the mechanism(s) that regulate this process, and whether LTβR blockade might be of therapeutic value have remained unclear. Here we demonstrate increased expression of LTβR ligands in adaptive and innate immune cells, enhanced non-canonical NF-κB signalling, and enriched LTβR target gene expression in lung epithelial cells from patients with smoking-associated chronic obstructive pulmonary disease (COPD) and from mice chronically exposed to cigarette smoke. Therapeutic inhibition of LTβR signalling in young and aged mice disrupted smoking-related inducible bronchus-associated lymphoid tissue, induced regeneration of lung tissue, and reverted airway fibrosis and systemic muscle wasting. Mechanistically, blockade of LTβR signalling dampened epithelial non-canonical activation of NF-κB, reduced TGFβ signalling in airways, and induced regeneration by preventing epithelial cell death and activating WNT/β-catenin signalling in alveolar epithelial progenitor cells. These findings suggest that inhibition of LTβR signalling represents a viable therapeutic option that combines prevention of tertiary lymphoid structures1 and inhibition of apoptosis with tissue-regenerative strategies.


Conflict of interest statement

All other authors declare no competing interests.

Data Availability

Microarray data was submitted to the NCBI Gene Expression Omnibus (GEO) database (https://www.ncbi.nlm.nih.gov/geo/) accession number GSE125521. Single cell RNA-Seq data was submitted to the NCBI GEO database accession number GSE151674. Single cell RNA-Seq metadata can be found in Supplementary Table 4. Proteomics data can be found in Supplementary Table 5. Series matrix files were also downloaded from the NCBI GEO databases: GSE47460-GPL14550, GSE37768, GSE56768 and GSE52509. Proteomic peak lists were searched against the mouse Uniprot FASTA database (version November 2016) https://www.uniprot.org/proteomes/UP000000589. All other data supporting the findings of this study are available within the paper and Supplementary Information. Source Data for Figs. 1–4 and Extended Data Figs. 1–10 are provided with the paper. All data are also available from the corresponding authors upon reasonable request.

Code Availability

All code used for data visualization of the single cell RNA-Seq data can be found at https://github.com/theislab/2020_Inhibition_LTbetaR-signalling.

Figures

Extended Data Fig. 1
Extended Data Fig. 1. Canonical and non-canonical NFκB-signalling pathways are activated in the lungs of COPD patients and CS-exposed mice.
a-b, Representative images of immunohistochemical analysis for RelA (a) and RelB (b) (brown signal, indicated by arrows, haematoxylin counter stained, scale bar 50μm, zoomed area 25μm) in lung core biopsy sections from healthy (n=3) and COPD patients (n=4), with the quantification of RelA and RelB positive alveolar epithelial nuclei shown as mean ± SD. c-e, Gene set enrichment analysis (GSEA) of the LTβR signalling, NF-κB signalling (gene lists from IPA software, Qiagen), TNFR-mediated signalling (GO:0033209), positive regulation of I-kappaB kinase NF-kappaB signalling (GO:0043123) and NIK NF-kappaB signalling (GO:0038061) pathways in publically available array data from lung tissue (GSE47460-GPL14550) of healthy (n=91) v COPD patients (n=145) (c), from lung tissue (GSE37768) of healthy (n=9) v COPD patients (n=18) (d) and from peripheral blood mononuclear cells (GSE56768) of healthy (n=5) v COPD patients (n=49) (e). f, mRNA expression levels of Lta, Ltbr, Tnfsf14 (Light), Tnf, Ccl2 and Cxcl13 determined by qPCR in whole lung from B6 mice exposed to filtered air (FA, n=6) or cigarette smoke (CS, n=8) for 6m, individual mice shown. g, GSEA of the pathways described in (c-e) in the publically available array data (GSE52509) of lungs from our mice exposed to filtere air (FA, n=3) and cigarette smoke (CS, n=6) for 4 and 6m. h, Western blot analysis for RelB, p100 and p52 in total lung homogenate from the mice described in (f). Quantification relative to vinculin of individual mice shown (n=3). For gel source data see Supplementary Fig 1. i, Schematic representation of the LTβR-Ig treatment protocol. j, Representative low and high magnification overlay images of Multiplex immunofluorescence staining to identify CD4 (Red), CD8 (Green), B220 (Turquoise) and DAPI (blue) counterstained lung sections (Scale bars 100μm, n=4) from B6 mice exposed to CS for 6m, plus LTβR-Ig fusion protein or control Ig (80 μg i.p., weekly) therapeutically from 4 to 6m, and analysed at 6m. k, mRNA expression levels of Cxcl13 and Ccl19 determined by qPCR in whole lung from B6 mice exposed to FA or CS for 4 and 6m, plus LTβR-Ig fusion or control Ig (80 μg i.p., weekly) prophylactically from 2 to 4m and analysed at 4m, and therapeutically from 4 to 6m and analysed at 6m (n=4 mice/group, repeated twice, pooled data shown). P values indicated, Mann-Whitney one-sided test (a-b), unpaired two-tailed Student’s t test (f, h), one-way ANOVA multiple comparisons Bonferroni test (k).
Extended Data Fig. 2
Extended Data Fig. 2. Immune response in lungs of CS-exposed mice treated with LTβR-Ig.
a-c, Flow cytometry analysis of single cell suspensions for adaptive immune cells from whole lung of B6 mice exposed to FA (n=6) or CS for 6m, plus LTβR-Ig fusion (n=5) or control Ig (n=5) (80 μg i.p., weekly) from 4 to 6m and analysed at 6m. a, t-SNE plots showing the distribution and composition of CD4 and CD8 T cells as Tcm (CD62L+CD44+), Tem (CD62LCD44+) and Tscm (CD62L+CD44) (left) and t-SNE plots showing the distribution of the surface markers indicated (upper right) and global changes in composition with treatment (lower right). b, Abundance of the T cell populations indicated as a percentage of total CD45+ cells. c, Upper are t-SNE plots showing the distribution of CD19, IgG, MHCII, CD69 and GL7 positive cells, while lower is the abundance of CD19+ B cells as a percentage of total CD45+ cells and the geometric mean fluorescence intensity of the expressed markers indicated on CD19+ B cells. d-g, B6 mice were exposed to FA or CS for 4 and 6m, plus LTβR-Ig fusion protein or control Ig (80 μg i.p., weekly) prophylactically (Proph.) from 2 to 4m and analysed at 4 months and therapeutically (Ther.) from 4 to 6 months, and analysed at 6m. d, Representative images of immunohistochemical analysis for CD68 macrophages in lung sections from the mice (n=4 mice/group, brown signal indicated by arrow heads, haematoxylin counter stained, scale bar 100μm). e, Quantification of CD68 positive macrophages across 20 random fields of view from lung sections stained in (d) (n=4 mice/group). f, Representative low and high magnification overlay images of Multiplex immunofluorescence staining to identify IBA1 (Red), iNOS (Green), CD206 (Turquoise) and DAPI (blue) counterstained lung sections from mice at 6m (Scale bars 100μm and 25μm respectively, n=4 mice/group). g, iNOS and IBA1 double positive macrophages from Multiplex immunofluorescence staining on lung sections from mice treated both prophylactically and therapeutically was quantified using Ilastik and CellProfiler (n=4 mice/group). h-l, Flow cytometry analysis of single cell suspensions for myeloid cells from whole lung of B6 mice exposed to FA (n=6) or CS for 6m, plus LTβR-Ig fusion (n=5) or control Ig (n=5) (80 μg i.p., weekly) from 4 to 6m and analysed at 6m. h, t-SNE plots showing the distribution and composition of myeloid cells and surface markers indicated. i, t-SNE plots showing global changes in composition with treatment. j, Composition of CD45+Ly6gF480+CD11c+ alveolar macrophages. k, Composition of CD45+Ly6gF480+CD11cCD11b+ interstitial macrophages. l, Composition of CD45+Ly6gF480+CD11cCD11b+Ly6chigh infiltrating macrophages. Data shown mean ± SD, P values indicated, one-way ANOVA multiple comparisons Bonferroni test (b, c, e, g, j-l).
Extended Data Fig. 3
Extended Data Fig. 3. Single cell RNA-Seq analysis of lungs from CS-exposed mice treated with LTβR-Ig.
Cells from whole lung suspensions of B6 mice exposed to FA (n=3) or CS for 6m, plus LTβR-Ig fusion protein (n=5) or control Ig (n=5) therapeutically from 4 to 6m, were analysed at 6m by scRNA-Seq (Drop-Seq). a, Heat map depicting the expression of key genes used in identifying the individual cell populations. b, UMAP of scRNA-Seq profiles (dots) coloured by experimental group. c, UMAP plots showing expression of genes indicated in scRNA-Seq profiles. d, Dot blot depicting the expression level (log transformed, normalised UMI counts) and percentage of cells in a population positive for Ltb, Lta, Tnf, Tnfsf14, Ltbr, Tnfrsf1a and Tnfrsf1b. e, UMAP plot showing the relative intensity of the positive regulation of NIK (non-canonical) NFκB signalling pathway (GO:1901224) across the scRNA-Seq profiles. f, UMAP plot of scRNA-Seq profiles (dots) of lung epithelial cells coloured by experimental group (left) and the relative intensity of the positive regulation of NIK (non-canonical) NFκB signalling pathway (GO:1901224) (right). g, Box and whiskers plot (box representing 25th-75th percentile, median line indicated and Tukey whiskers representing +/− 1.5 IQR) showing the relative score for the positive regulation of NIK (non-canonical) NFκB signalling pathway in the cell types indicated across the three groups. Statistical significance is indicated and was assessed using Wilcoxon rank-sum two-sided test on normalized, log transformed count values and corrected with Benjamini-Hochberg.
Extended Data Fig. 4
Extended Data Fig. 4. Analysis of Lta and LTb expression in human and murine lungs
a, Representative images of in situ hybridisation analysis for LTA and immunohistochemical (IHC) analysis for LTB in lung sections from healthy and COPD patients (n=4, red signal indicated by arrow heads (LTA), brown signal (LTB) and haematoxylin counter stained, scale bar 50μm. b, Representative images of in situ hybridisation analysis for Lta and Ltb in lung sections from B6 mice exposed to CS for 6m with LTβR-Ig fusion protein or control Ig (80 μg i.p., weekly) therapeutically for 4 to 6m, and analysed at 6m (n=4 mice/group, repeated twice), (brown positive staining (Lta) and red positive staining (Ltb) indicated by arrow heads, open arrow head unstained cells, haematoxylin counter stained, scale bar 20μm). Non-staining with sense probe in CS+Ig sections shown as negative control. Representative images of immunohistochemical analysis identifying CD68 positive macrophages (brown staining indicated by arrow heads) also shown. c, Representative images of in situ hybridisation analysis for Tnfsf14 (Light) in lung sections from mice described in (b) (n=4 mice/group) (brown positive staining indicated by arrow heads, open arrow head unstained cells, haematoxylin counter stained, scale bar 20μm), plus a spleen section shown as positive control. d, Representative images of in situ hybridisation analysis for Tnf in lung sections from mice described in (b) (brown positive macrophage indicated by arrow heads, open arrow head unstained macrophage, haematoxylin counter stained, scale bar 20μm). Representative immunohistochemical analysis identifying CD68 positive macrophages (brown staining indicated by arrow heads, haematoxylin counter stained, scale bar 20μm) also shown. e, Quantification of Tnf positive macrophages across 20 random fields of view per lung (n=4). Data shown mean ± SD. P values indicated, one-way ANOVA multiple comparisons Bonferroni test.
Extended Data Fig. 5
Extended Data Fig. 5. Inhibition of LTβR-signalling strongly reduces non-canonical but not canonical NF-κB-signalling in lung.
a, Principal component analysis of microarray data, using Mouse Ref-8 v2.0 Expression BeadChips (Illumina), undertaken on lung tissue from mice exposed to FA or CS for 6m, plus LTβR-Ig fusion or control Ig (80 μg i.p., weekly) therapeutically from 4 to 6m (n=3 mice/group). b, Principal component analysis of normalised z-scored MS-intensities from proteomics of whole lung lysates from mice exposed to FA (n=6) or CS for 6m, plus LTβR-Ig fusion (n=7) or control Ig (n=4) (80 μg i.p., weekly) from 4 to 6m. c, Heat map depicting the top 20 up and down LTβR-Ig regulated genes presented as fold change (FDR<10%) from the microarray data described in (a). Left, expression in CS+Ig relative to FA – exposed mice; Right, expression in CS+LTβR-Ig relative to CS+Ig – exposed mice. d, GSEA of the NIK (non-canonical) NF-κB signalling (GO:0038061) pathway of the microarray data from (a). e, Heat map of significantly regulated proteins from the NIK (non-canonical) NF-κB signalling (GO:0038061) pathway as determined by Student’s T-test Test statistic from the proteomics data described in (b). f, GSEA of the NIK (non-canonical) NF-κB signalling (GO:0038061) pathway of the normalised proteome data described in (b). g, Representative images of two independent experiments of immunohistochemical analysis for RelB in lung sections from B6 mice exposed to FA or CS for 4 and 6m, plus LTβR-Ig fusion or control Ig (80 μg i.p., weekly) prophylactically from 2 to 4m and analysed at 4m, and therapeutically from 4 to 6m and analysed at 6m (brown signal indicated by arrow heads, haematoxylin counter stained, scale bar 25μm). h, Quantification of RelB positive alveolar epithelial nuclei from the IHC sections in (g), n=3 mice/group. i, Representative images of two independent experiments of immunohistochemical analysis for RelA in lung sections from the mice described in (g) (brown signal indicated by arrow heads, haematoxylin counter stained, scale bar 25μm). j, Quantification of RelA positive alveolar epithelial nuclei from the IHC sections in (i), n=3 mice/group. k, mRNA expression levels of Ccl2, Ccl3, Cxcl1 and Tnf determined by qPCR in whole lung from the mice described in (g), n=4 mice/group, repeated twice, pooled data shown. l, mRNA expression levels of LTA, CXCL13 and TNF determined by qPCR in ex vivo human precision-cut lung slices stimulated for 24h with LPS (10μg/ml) in the presence or absence of human LTβR-Ig fusion protein (1μg/ml) (n=3 independent experiments from 3 separate lungs). Left image shows a representative picture of preparing a lung slice from the 3 independent experiments. Data shown mean ± SD. P values indicated, one-way ANOVA multiple comparisons Bonferroni test.
Extended Data Fig. 6
Extended Data Fig. 6. LTβR-Ig treatment reverses airway remodeling and comorbidities in chronic CS-exposed mice.
a, Representative images of Masson’s Trichrome stained lung sections (scale bar 200μm) from B6 mice exposed to FA or CS for 4 and 6m, plus LTβR-Ig fusion protein or control Ig (80 μg i.p., weekly) prophylactically from 2 to 4m and analysed at 4m, and therapeutically from 4 to 6m and analysed at 6m (n=4 mice/group, repeated twice). These are low magnification images of the sections depicted and quantified in Fig. 2c,d. b, Representative images of immunohistochemical analysis for collagen I (red signal, haematoxylin counter stained, scale bar 100μm) in lung sections from B6 mice described in (a). c, Quantification of small airway collagen deposition normalised to the surface area of airway and vessel basement membrane from the sections in (b), (n=7 mice FA, 7 mice CS+Ig, 7 mice CS+LTβR-Ig groups, from 2 independent experiments). d, Representative images of immunohistochemical analysis for phosphorylated Smad2 in lung sections from mice described in (a, n=4 mice/group, repeated twice) (red signal indicated by arrows, haematoxylin counter stained, scale bar 25μm). e, mRNA expression levels of Ppargc1a and Mcat determined by qPCR in gastrocnemius muscle from 6m mice described in (a) (n=4 mice/group, repeated twice, pooled data shown). f, 4-paw muscle strength test in mice at 6m treated as described in (a) (n=8 mice/group). g, Schematic representation of the LTβR-Ig treatment protocol in aged mice. h, Representative images of H/E and Masson’s Trichrome stained lung sections (scale bar 50μm) from 12m old B6 mice exposed to FA or CS for 4m, plus LTβR-Ig fusion protein or control Ig (80 μg i.p., weekly) from 2 to 4m and analysed at 4m. (n=5 mice FA, 5 mice CS+Ig, 7/8 mice CS+LTβR-Ig groups, repeated twice. These are low magnification images of the sections depicted and quantified in Fig. 2f,g.) Data shown mean ± SD. P values indicated, one-way ANOVA multiple comparisons Bonferroni test (c), Student’s two-tailed t test (e-f).
Extended Data Fig. 7
Extended Data Fig. 7. Disease development is not attenuated by LTβR-Ig treatment in iBALT independent emphysema.
a, Schematic representation of the LTβR-Ig treatment protocol in mice exposed to a single oropharangeal application of porcine pancreatic elastase (PPE) or PBS control. b, mRNA expression level fold changes (FC) of Lta, Tnfsf14 (Light), Ltbr and Tnf relative to Hprt, determined by qPCR in whole lung from B6 mice treated with a single oropharyngeal application of PBS (n=8), porcine pancreatic elastase (PPE, 40 U/kg body weight) analysed after 3m (n=7) or 4m chronic cigarette smoke exposure (CS) (n=8 mice/group). c, Representative images of immunohistochemical analysis for B220 positive B cells and CD3 positive T cells (brown signal, indicated by arrow heads, haematoxylin counter stained, scale bar 50μm) in lung sections from PBS and PPE treated mice described in (b) plus mice treated with PPE followed by LTβR-Ig fusion protein (80 μg i.p., weekly) 28d later for 2m (n=8 mice/group, repeated twice). d, Lymphocyte counts in the bronchoalveolar lavage (BAL) from the mice described in (c) plus mice exposed to CS for 4m (n=8 mice/group). e, Representative images of in situ hybridisation analysis for Lta and Ltb in lung sections from mice described in (c), plus splenic positive controls, (brown staining, haematoxylin counter stained, scale bar 50μm) (n=4 mice/group, repeated twice). f, Representative images of immunohistochemical analysis for RelA and RelB in lung sections from B6 mice described in (c) (brown signal indicated by arrow heads, haematoxylin counter stained, scale bar 50μm) (n=4 mice/group, repeated twice). g, Representative images of H/E stained lung sections (scale bar 200μm and 50μm inset) from the lungs of mice described in (c) (n=8 mice/group, repeated twice). h, Emphysema scoring (1–5, 5 most severe) of lung sections from (f) (n=5 mice PBS, 5 mice PPE, 7 mice PPE+LTβR-Ig groups). i, Diffusing capacity of carbon monoxide (DFCO) in the lungs of mice described in (c) (n=8 mice PBS, 7 mice PPE, 8 mice PPE+LTβR-Ig groups). j, Dynamic compliance (Cdyn) pulmonary function data from the mice described in (c) (n=8 mice PBS, 7 mice PPE, 8 mice PPE+LTβR-Ig groups). Data shown mean ± SD. P values indicated, one-way ANOVA multiple comparisons Bonferroni test.
Extended Data Fig. 8
Extended Data Fig. 8. Inhibiting LTβR-signalling suppresses CS-induced apoptosis.
a, Representative images of immunohistochemical analysis for cleaved caspase-3 in lung sections from healthy and COPD patients (n=5, brown signal indicated by arrow heads, haematoxylin counter stained, scale bar 50μm). b, Quantification of alveolar epithelial cells positive for cleaved caspase-3 from the lung sections stained in a. Data shown mean ± SD (n=5 patients per group). P =0.0079, Mann-Whitney two-sided test. c-d, Gene set enrichment analysis (GSEA) of Apoptosis (Hallmark collection), in transcriptomic array data from publically available array data of lung tissue (GSE47460-GPL14550) from healthy (n=91) v COPD patients (n=145) (c) and the lungs of B6 mice after exposure for 6m to FA, CS+Ig or CS+LTβR-Ig fusion protein therapeutically (n=3 mice/group) (d). e, Box and whiskers plot (box representing 25th-75th percentile, median line indicated and Tukey whiskers representing +/− 1.5 IQR) showing the relative score for Apoptosis (Hallmark collection) in AT2 cells following scRNA-Seq of lungs from B6 mice after exposure for 6m to FA (n=3 mice/group), CS+Ig (n=5 mice/group) or CS+LTβR-Ig fusion protein (n=5 mice/group) therapeutically. Statistical significance is indicated and was assessed using Wilcoxon rank-sum two-sided test on normalized, log transformed count values and corrected with Benjamini-Hochberg. f-g, Proteome analysis of whole lung lysates from mice exposed to FA (n=6) or CS for 6m, plus LTβR-Ig fusion (n=7) or control Ig (n=4) (80 μg i.p., weekly) from 4 to 6m was undertaken. f, Heat map of the significantly regulated proteins from the Hallmark Apoptosis list as determined by Student’s two-sided T-test Test statistic. g, GSEA of the Hallmark Apoptosis list on the normalised proteome data. h, Representative images of immunohistochemical analysis for cleaved caspase-3 in lung sections from B6 mice exposed to FA or CS for 4 and 6m, plus LTβR-Ig fusion protein or control Ig (80 μg i.p., weekly) prophylactically from 2 to 4m and analysed at 4m, and therapeutically from 4 to 6m and analysed at 6m (n=4 mice/group, brown signal indicated by arrow heads, haematoxylin counter stained, scale bar 50μm). Quantification of cleaved caspase-3 positive alveolar epithelial cells from the IHC sections also shown. i, Western blot analysis for cleaved caspase-3 (c-Cas-3) in total lung homogenate from mice described in (h), quantification relative to β-actin (prophylactic groups: FA n=7, CS+Ig n=7, CS+LTβR-Ig n=6 mice/group, therapeutic groups: FA n=6, CS+Ig n=5, CS+LTβR-Ig n=6 mice/group, pooled from two independent experiments), individual mice shown. For gel source data see Supplementary Fig 1. j-l, The murine alveolar epithelial type II like cell line - LA4 was stimulated with an agonistic antibody to LTβR (LTβR-Ag, 2 μg/ml), recombinant murine TNF (1 ng/ml) or a combination of both, in the presence or absence of necrostatin-1 (Nec1, 50 μM) (j) and (k) or Z-Val-Ala-DL-Asp-fluoromethylketone (z-VAD, 20 μM) (l). Apoptosis was assessed at 6h (j-l) and 24h (k, l) by flow cytometric analysis of Annexin V and propidium iodide (PI) staining (n=2–3, repeated twice, pooled data shown (k)). m-n, Wound healing assay in LA4 cells grown to confluence, scratched and then incubated with an agonistic antibody to LTβR (2 μg/ml), recombinant murine TNF (1 ng/ml) or a combination of both, in the presence or absence of necrostatin-1 (50 μM). m, Representative images at 0h and 56h post scratch are shown (scale bar 200μm, n=4 from one experiment). n, degree of wound closure (100% representing fully closed) at 56h (n=4). Data shown mean ± SD. P values indicated, one-way ANOVA multiple comparisons Bonferroni test (h, i, k, l and n).
Extended Data Fig. 9
Extended Data Fig. 9. LTβR stimulation regulates Wnt/β-catenin-signalling.
a, GSEA of canonical Wnt signalling (GO:0060070) and β-catenin/TCF transcription factor complex assembly (GO:1904837) in transcriptomic array data from the lungs of B6 mice after 6m FA, CS+Ig or CS+LTβR-Ig fusion protein therapeutically (n=3 mice/group) and publically available array data from lung tissue (GSE47460-GPL14550) of healthy (n=91) v COPD patients (n=145). b, Representative images of immunohistochemical analysis for Axin2 in lung sections from healthy (n=6) and COPD patients (n=8), brown signal indicated by arrow heads, haematoxylin counter stained, scale bar 50μm. c, mRNA expression levels of Nkd1 and Lgr5 relative to Hprt in primary murine alveolar type 2 epithelial cells (AT2) treated with agonistic antibody to LTβR (LTβR-Ag, 2 μg/ml) for 24h +/− murine rWNT3A (100ng/ml) (n=5 individual experiments). d, mRNA expression levels of Tcf4 relative to Hprt in the murine AT2 like cell line - LA4 stimulated with LTβR-Ag (2 μg/ml) or recombinant murine TNF (1 ng/ml) (n=3, repeated three times). e, mRNA expression levels of Tcf4 relative to Hprt in LA4 cells stimulated with LTβR-Ag (2 μg/ml) plus recombinant murine TNF (1 ng/ml) +/− necrostatin-1 (Nec1, 50 μM), TPCA-1 (10 μM) or BAY 11–7082 (10 μM), (n=2, repeated twice). f, mRNA expression levels of AXIN2 relative to HPRT and normalized to vehicle (Veh.), in the human AT2 cell line A549 treated with human LTβR-Ag (0.5 μg/ml) for 24h +/− TPCA-1 (5 μM) (n=3 independent experiments). g. Wnt/β-catenin luciferase reporter activity in the murine AT2 cell line MLE12, activated by GSK-3β inhibitor (CHIR99021, 1 μM) and treated with LTβR-Ag at the concentrations indicated for 24h (activity relative to CHIR alone, n=2–9). h, Western blot analysis for β-catenin in MLE12 cells treated with LTβR-Ag (2 μg/ml) for 24h +/− murine rWNT3A (100ng/ml) plus Bortezomib (10 nM). Quantification relative to actin shown (n=3 independent experiments). For gel source data see Supplementary Fig 1. i, mRNA expression levels of TCF4 relative to HPRT in ex vivo human precision-cut lung slices stimulated for 24h with recombinant human TNF (20 ng/ml) or agonistic antibody to human LTβR (LTβR-Ag, 2 μg/ml) for 24h (n=5 slices from individual lungs). j, Western blot analysis for β-catenin in MLE12 cells treated with murine rWNT3A (200ng/ml) and TNFSF14 (200ng/ml) for 30h. Quantification relative to vinculin shown (n=3 independent experiments). For gel source data see Supplementary Fig 1. k-m, B6 mice were treated with a single oropharyngeal application of PBS (n=8), porcine pancreatic elastase (PPE, 40 U/kg body weight) (n=7 mice/group) or PPE followed by LTβR-Ig fusion protein (80 μg i.p., weekly) 28d later for 2m and all analysed after 3m (n=8 mice/group), see Extended Data Fig. 7a. k, mRNA expression levels of Axin2, Bcl9l, Cdh1, Dvl1, Gsk3b, Rab5a, Tcf4, Wif1, Wnt2 and Wnt4 relative to Hprt, determined by qPCR in whole lung. l, Representative images of immunohistochemical analysis for Tcf4 and Axin2 in lung sections from the mice descibed (n=4 mice/group, brown signal indicated by arrow heads, haematoxylin counter stained, scale bar 25μm). m, Quantification of alveolar epithelial cells positive for Tcf4 and Axin2 from (l). Data shown individual lungs (c, i) or mean ± SD (d-h, j-k and m). P values indicated, paired Student’s t test (one-tailed (c), two-tailed (i)), two-tailed Student’s t test (h, j) or one-way ANOVA multiple comparisons Bonferroni test (d-g, g compared to vehicle, k and m).
Extended Data Fig. 10
Extended Data Fig. 10. LTβR-stimulation regulates lung repair and regeneration by modulating WNT/β-catenin-signalling.
a, Schematic representation of the experiment in which B6 mice were exposed to FA (n=5) or CS for 6m plus control Ig (n=5), LTβR-Ig fusion protein (80 μg i.p., weekly, n=5), LTβR-Ig fusion protein + beta-catenin/CBP inhibitor PRI-724 (0.6mg i.p., 2x weekly, n=6) or CHIR99021 (0.75mg i.p., weekly, n=5) from 4 to 6m, and analysed at 6m. b, mRNA expression levels of Ltb, Tnfsf14 (Light) and Ltbr relative to Hprt, determined by qPCR in whole lung from the mice described in (a) (FA n=5, CS plus control Ig n=5, LTβR-Ig n=5, LTβR-Ig + PRI-724 n=6 and CHIR99021 n=5 mice/group). c, Representative images of immunohistochemical analysis for CD3 positive T cells and B220 positive B cells (brown signal, haematoxylin counter stained, scale bar 100μm) in lung sections from the mice described in (a). d, mRNA expression levels of Axin2 relative to Hprt, determined by qPCR in whole lung from the mice described in (a) (FA n=5, CS plus control Ig n=5, LTβR-Ig n=5, LTβR-Ig + PRI-724 n=6 and CHIR99021 n=5 mice/group). e, Schematic representation of human lung organoid experiments. f, Representative images and quantification of lung organoids from primary human alveolar type 2 epithelial cells cultured for 14d +/− human LTβR-Ag (2 μg/ml) and LiCl (5mM), (scale bar 500μm, n=2 replicates from 2 separate donors). g, Schematic representation of the re-ignition of repair and regeneration pathways in AT2 lung cells following LTβR-Ig therapy in both young and aged exposed to chronic CS. Data shown mean ± SD (d), P values indicated, two-tailed Student’s t test (d) and one-way ANOVA multiple comparisons Bonferroni test (f).
Fig. 1
Fig. 1. LTβR-signalling is activated in COPD and inhibition disrupts iBALT in the lungs of CS-exposed mice.
a, mRNA expression levels of genes indicated determined by qPCR in lung core biopsies from healthy (n=11) and COPD patients (n=32). b, Representative images of immunohistochemical analysis for B220+ B cells and CD3+ T cells (brown signal, arrows, haematoxylin counter stained, scale bar 200μm) in lung sections from B6 mice exposed to FA or CS for 4m and 6m, plus LTβR-Ig or control Ig prophylactically from 2m - 4m (CS + LTβR-Ig – 4m) and therapeutically from 4m - 6m (CS + LTβR-Ig – 6m), see Extended Data Fig. 1i. (n=4 mice/group, repeated twice). c, Representative lung sections from COPD patients stained for CD20+ B cells and CD3+ T cells (brown signal, arrows, haematoxylin counter stained, scale bar 200μm, n=4). d, Quantification of lung iBALT from mice described in (b), as mean iBALT number/airway and volume of iBALT normalised to surface area of airway basement membrane (bm), data shown mean ± SD (n=4 mice/group, repeated twice, Proph., prophylactic; Ther., therapeutic). e-g, Cells from whole lung suspensions of B6 mice exposed to FA (n=3) or CS for 6m, plus LTβR-Ig (n=5) or control Ig (n=5) therapeutically, were analysed at 6m by scRNA-Seq (Drop-Seq). e, UMAP of scRNA-Seq profiles (dots) coloured by cell type. f, UMAP plots showing expression of genes indicated in scRNA-Seq profiles. g, Box and whiskers plot (box 25th-75th percentile, median line indicated and whiskers representing +/− 1.5 IQR) showing relative score for positive regulation of NIK (non-canonical) NFκB signalling pathway (GO:1901224) in cells indicated. Statistical significance indicated and was assessed using Wilcoxon rank-sum test on normalized, log transformed count values and corrected with Benjamini-Hochberg (g). P values indicated, Mann-Whitney one-sided test (a) and one-way ANOVA multiple comparisons Bonferroni test (g).
Fig. 2
Fig. 2. LTβR-Ig reverses emphysema in chronic CS-exposed young and aged mice.
a, Representative images of H/E stained lung sections (scale bar 100μm) from B6 mice exposed to FA or CS for 4m and 6m, plus LTβR-Ig or control Ig prophylactically from 2m - 4m analysed at 4m, and therapeutically from 4m - 6m analysed at 6m, see Extended Data Fig. 1i. (n=6 mice FA, 5 mice CS+Ig, 6 mice CS+LTβR-Ig groups, repeated twice). b, Quantification of airspace enlargement as mean chord length and alveolar surface area in lung sections from mice in (a) (n=6 mice FA, 5 mice CS+Ig, 6 mice CS+LTβR-Ig groups, repeated twice, Proph., prophylactic; Ther., therapeutic). c, Representative images of Masson’s Trichrome stained lung sections (scale bar 25μm) from mice in (a), (n=5 mice FA, 5 mice CS+Ig, 5 mice CS+LTβR-Ig groups, repeated twice). d, Quantification of airway collagen deposition normalised to surface area of airway basement membrane (bm) from sections in (c), (n=5 mice FA, 5 mice CS+Ig, 5 mice CS+LTβR-Ig groups, repeated twice). e, TGF-β levels determined by ELISA in bronchoalveolar lavage fluid (BALF) of mice described in (a) (n=4 mice FA, 4 mice CS+Ig, 4 mice CS+LTβR-Ig groups, repeated twice). f, Representative images of H/E and Masson’s Trichrome stained lung sections (scale bar 50μm) from 12m old B6 mice exposed to FA or CS for 4m, plus LTβR-Ig or control Ig from 2m – 4m and analysed at 4m, see Extended Data Fig. 6g. (n=5 mice FA, 5 mice CS+Ig, 8 mice CS+LTβR-Ig groups, repeated twice). g, Quantification of lung iBALT as volume of iBALT normalised to surface area of airway bm, quantification of airspace enlargement as mean chord length, from H/E sections in (f) and quantification of airway collagen deposition normalised to surface area of airway bm from Masson’s Trichrome sections in (f) (n=5 mice FA, 5 mice CS+Ig, 8 mice CS+LTβR-Ig groups, repeated twice). Data shown mean ± SD. P values indicated, one-way ANOVA multiple comparisons Bonferroni test.
Fig. 3
Fig. 3. Blocking LTβR-signalling induces Wnt/β-catenin in alveolar epithelial cells.
a, Heat map of mRNA abundance of Wnt signalling pathway genes determined by RT-qPCR from lungs of mice indicated at 6m. b, Representative images of immunohistochemical analysis for Tcf4 and Axin2 in lung sections from B6 mice treated as indicated (n=4 mice/group, brown signal, arrows, haematoxylin counter stained, scale bar 25μm). c, Quantification of alveolar epithelial cells positive for Tcf4 and Axin2 from (b). d, Normalised, Log transformed expression levels of Tcf4 and Axin2 in AT2 cells following scRNA-seq analysis. e, mRNA expression levels of Axin2 relative to Hprt, in primary murine AT2 cells with LTβR agonistic antibody (LTβR-Ag, 2 μg/ml) for 24h +/− rWNT3A (100ng/ml) (n=5 independent experiments). f, mRNA expression levels of AXIN2 relative to HPRT (normalized to Vehicle, Veh.) in A549 (human AT2) cell line with hLTβR-Ag (0.5 μg/ml) for 24h +/− rWNT3A (100ng/ml) and GSK-3β inhibitor (CHIR99021, 1μM) (n=5 independent experiments). g, Wnt/β-catenin luciferase reporter activity in MLE12 (murine AT2) cell line, activated with CHIR99021 (1μM) +/− LTβR-Ag (2 μg/ml) or rTNF (1 ng/ml) for 24h (n=3, representative of 5 independent experiments). h, Western blot analysis for β-catenin in MLE12 cells with LTβR-Ag (2 μg/ml) for 24h +/− rWNT3A (100ng/ml). Quantification relative to actin (n=3 independent experiments). For gel source data see Supplementary Fig 1. i, Western blot analysis for β-catenin and p52 in MLE12 cells with rWNT3A (200ng/ml) and LTβR-Ag (2 μg/ml) for 30h following 2h pre-treatment with NIK kinase specific inhibitor (Cmp1, 1μM). Quantification relative to tubulin (n=3 independent experiments). For gel source data see Supplementary Fig 1. j, mRNA expression level of AXIN2 relative to HPRT, in ex vivo human precision-cut lung slices stimulated for 24h with rTNF (20ng/ml) or hLTβR-Ag (2 μg/ml) (n=6 slices from individual lungs). Data shown mean ± SD (c, g-i), box and whiskers plots (box 25th-75th percentile, median line indicated and whiskers representing +/− 1.5 IQR) (d), individual lungs (e,j), or individual experiments (f). P values indicated, one-way ANOVA multiple comparisons Bonferroni test (g), Wilcoxon rank-sum test (two-sided) corrected with Benjamini-Hochberg (d), paired Student’s two-tailed t test (e,f,j), or Student’s two-tailed t test (c, h-i).
Fig. 4
Fig. 4. Blocking WNT/β-catenin signalling reverses LTβR-Ig induced regeneration.
a-c, B6 mice were exposed to FA (n=5) or CS for 6m plus control Ig (n=5), LTβR-Ig (80 μg i.p., weekly, n=5), LTβR-Ig + beta-catenin/CBP inhibitor PRI-724 (0.6mg i.p., 2x weekly, n=6) or CHIR99021 (0.75mg i.p., weekly, n=5) from 4m – 6m, and analysed at 6m, see Extended Data Fig. 10a. a, Lung mRNA expression levels of genes indicated relative to Hprt determined by qPCR. b, Representative images of H/E stained lung sections (scale bar 100μm) and quantification of airspace enlargement as mean chord length. c, Representative images of immunohistochemical analysis for Axin2 in lung sections (brown signal, haematoxylin counter stained, scale bar 50μm) and quantification of alveolar epithelial cells positive for Axin2. d, Representative images and quantification of lung organoids from primary human AT2 cells cultured for 14d +/− human LTβR-Ag (2 μg/ml) and CHIR99021 (2μM), see Extended Data Fig. 10e (scale bar 500μm, n=2 replicates from 2 separate donors). Data shown mean ± SD, P values indicated, one-way ANOVA multiple comparisons Bonferroni test (a-d).
None

References

    1. Kratz A, Campos-Neto A, Hanson MS & Ruddle NH Chronic inflammation caused by lymphotoxin is lymphoid neogenesis. The Journal of experimental medicine 183, 1461–1472 (1996). - PMC - PubMed
    1. Drayton DL, Liao S, Mounzer RH & Ruddle NH Lymphoid organ development: from ontogeny to neogenesis. Nature immunology 7, 344–353, doi: 10.1038/ni1330 (2006). - DOI - PubMed
    1. Hogg JC et al. The nature of small-airway obstruction in chronic obstructive pulmonary disease. The New England journal of medicine 350, 2645–2653, doi: 10.1056/NEJMoa032158 (2004). - DOI - PubMed
    1. Galkina E & Ley K Immune and inflammatory mechanisms of atherosclerosis (*). Annual review of immunology 27, 165–197, doi: 10.1146/annurev.immunol.021908.132620 (2009). - DOI - PMC - PubMed
    1. Pitzalis C, Jones GW, Bombardieri M & Jones SA Ectopic lymphoid-like structures in infection, cancer and autoimmunity. Nature reviews. Immunology 14, 447–462, doi: 10.1038/nri3700 (2014). - DOI - PubMed

Method’s References

    1. Uhl FE et al. Preclinical validation and imaging of Wnt-induced repair in human 3D lung tissue cultures. The European respiratory journal 46, 1150–1166, doi: 10.1183/09031936.00183214 (2015). - DOI - PubMed
    1. Baarsma HA et al. Noncanonical WNT-5A signaling impairs endogenous lung repair in COPD. The Journal of experimental medicine 214, 143–163, doi: 10.1084/jem.20160675 (2017). - DOI - PMC - PubMed
    1. Barkauskas CE et al. Type 2 alveolar cells are stem cells in adult lung. The Journal of clinical investigation 123, 3025–3036, doi: 10.1172/JCI68782 (2013). - DOI - PMC - PubMed
    1. Ng-Blichfeldt JP et al. Retinoic acid signaling balances adult distal lung epithelial progenitor cell growth and differentiation. EBioMedicine 36, 461–474, doi: 10.1016/j.ebiom.2018.09.002 (2018). - DOI - PMC - PubMed
    1. John G et al. The composition of cigarette smoke determines inflammatory cell recruitment to the lung in COPD mouse models. Clinical science 126, 207–221, doi: 10.1042/CS20130117 (2014). - DOI - PMC - PubMed

Publication types

MeSH terms