. 2020 Oct 19:2020:9502651.
doi: 10.1155/2020/9502651. eCollection 2020.

Cardiac CaMKII δ and Wenxin Keli Prevents Ang II-Induced Cardiomyocyte Hypertrophy by Modulating CnA-NFATc4 and Inflammatory Signaling Pathways in H9c2 Cells

Affiliations

Cardiac CaMKII δ and Wenxin Keli Prevents Ang II-Induced Cardiomyocyte Hypertrophy by Modulating CnA-NFATc4 and Inflammatory Signaling Pathways in H9c2 Cells

Na An et al. Evid Based Complement Alternat Med. .

Abstract

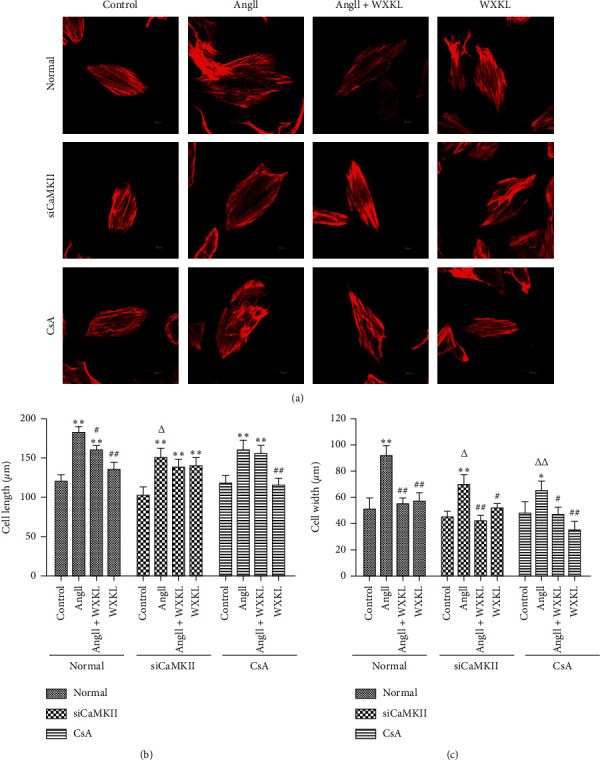
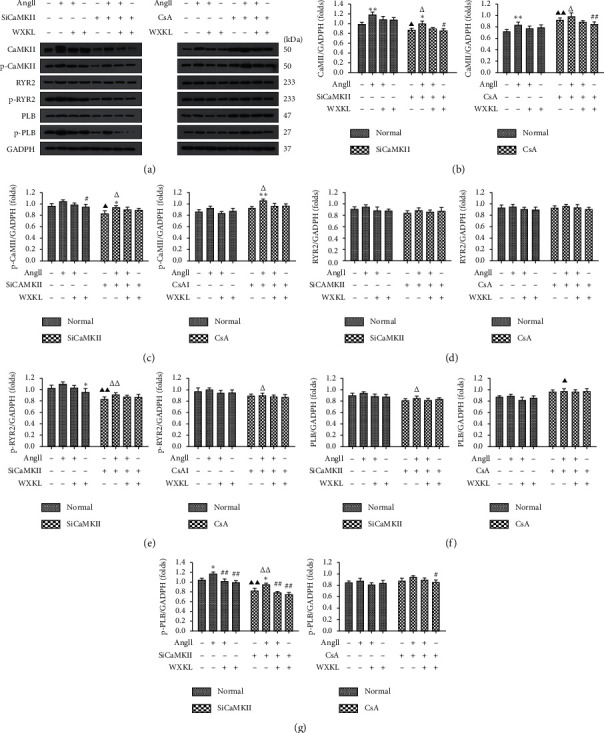
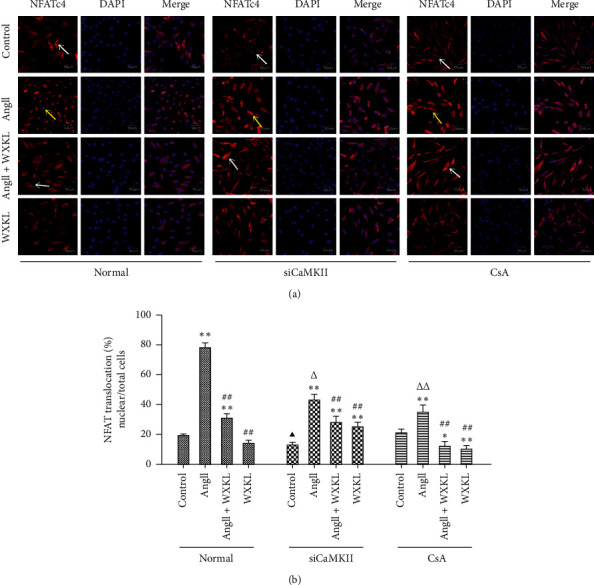
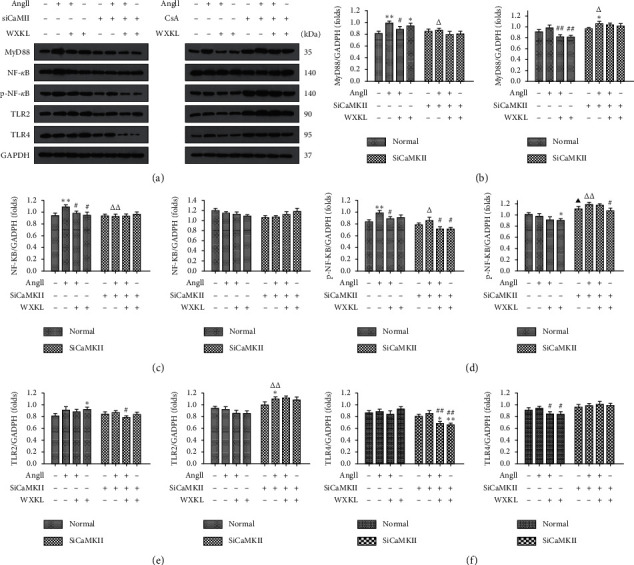
Previous studies have demonstrated that calcium-/calmodulin-dependent protein kinase II (CaMKII) and calcineurin A-nuclear factor of activated T-cell (CnA-NFAT) signaling pathways play key roles in cardiac hypertrophy (CH). However, the interaction between CaMKII and CnA-NFAT signaling remains unclear. H9c2 cells were cultured and treated with angiotensin II (Ang II) with or without silenced CaMKIIδ (siCaMKII) and cyclosporine A (CsA, a calcineurin inhibitor) and subsequently treated with Wenxin Keli (WXKL). Patch clamp recording was conducted to assess L-type Ca2+ current (ICa-L), and the expression of proteins involved in signaling pathways was measured by western blotting. Myocardial cytoskeletal protein and nuclear translocation of target proteins were assessed by immunofluorescence. The results indicated that siCaMKII suppressed Ang II-induced CH, as evidenced by reduced cell surface area and ICa-L. Notably, siCaMKII inhibited Ang II-induced activation of CnA and NFATc4 nuclear transfer. Inflammatory signaling was inhibited by siCaMKII and WXKL. Interestingly, CsA inhibited CnA-NFAT pathway expression but activated CaMKII signaling. In conclusion, siCaMKII may improve CH, possibly by blocking CnA-NFAT and MyD88 signaling, and WXKL has a similar effect. These data suggest that inhibiting CaMKII, but not CnA, may be a promising approach to attenuate CH and arrhythmia progression.


Conflict of interest statement

The authors declare that they have no conflicts of interest.

Figures

Figure 1
Figure 1
The HPLC chromatograms of WXKL. (a) Chemical reference substances, (b) WXKL, (c) negative samples of Panax notoginseng, and (d) Codouopsis pilosula. (1) notoginsenoside R1; (2) ginsenoside Rg1; (3) obetyolin; (4) ginsenoside Rb1; (5) ginsenoside Rd.
Figure 2
Figure 2
SiCaMKII decreases Ang II-induced cell surface area enlargement in H9c2 cells. H9c2 cells were treated with Ang II (10−7 M for 48 h). CaMKII was silenced or CsA (10−6 M) was added to the culture medium prior to Ang II administration. After administering Ang II, WXKL (5 g/L) was added, and the culture medium was incubated for 24 h. The control cells received no treatment. (a) Representative images of immunofluorescence staining for phalloidin following treatment (n = 10 cells per group). Scale bar: 30 μm. (b) Mean cell length measurement (n = 10 cells per group). (c) Mean cell width measurement (n = 10 cells per group). Data are presented as the mean ± SD. Statistical significance was determined by one-way ANOVA. P < 0.05 and ∗∗P < 0.01 vs. the control group. #P < 0.05 and ##P < 0.01 vs. the Ang II group. P < 0.05 and ▲▲P < 0.01; the control group in SiCaMKII or CsA vs. the control group in normal. P < 0.05 and △△P < 0.01; the Ang II group in SiCaMKII or CsA vs. the Ang II group in normal.
Figure 3
Figure 3
Changes in patch clamp inspection. (a) ICa-L current in the control, Ang II, Ang II + WXKL, SiCaMKII, and CsA groups. (b) Effects of siCaMKII and CsA on the ICa-L current-voltage (I–V) curve in H9c2 cells. I–V curves and peak current density (PA/PF) of each group (n = 10 cells per group). (c) Effects of siCaMKII and CsA on ICa-L steady-state activation (SSA) in H9c2 cells. ICa-L steady-state activation curves (original data point diagram and curve fit by Boltzmann equation), comparison of semiactivation voltage (V1/2, act), and comparison of slope factors (K,act) in each group (n = 10 cells per group). (d) Effects of siCaMKII and CsA on ICa-L steady-state inactivation in H9c2 cells. ICa-L steady-state inactivation curves (original data point diagram and curve fitting by Boltzmann equation); comparison of semi-inactivation voltage (V1/2, inact); comparison of slope factors (K,inact) in each group (n = 10 cells per group). Values are presented as mean ± SD; Statistical significance was determined by one-way ANOVA. P < 0.05 and ∗∗P < 0.01 vs. the control group. #P < 0.05 and ##P < 0.01 vs. the Ang II group.
Figure 4
Figure 4
Effects of siCaMKII and CsA on the CaMKII signaling cascade. (a) Double immunofluorescence staining to observe the effects of siCaMKII, CsA, and WXKL on CaMKII expression in each group. Scale bar: 50 μm. (b) Mean density of CaMKII in each group. Data are presented as the mean ± SD. Statistical significance was determined by one-way ANOVA. P < 0.05 and ∗∗P < 0.01 vs. the control group. #P < 0.05 and ##P < 0.01 vs. the Ang II group. P < 0.05 and ▲▲P < 0.01; the control group in SiCaMKII or CsA vs. the control group in normal. P < 0.05 and △△P < 0.01; the Ang II group in SiCaMKII or CsA vs. the Ang II group in normal.
Figure 5
Figure 5
Effects of siCaMKII and CsA on Ang II-induced activation of CaMKII signaling in H9c2 cells. (a) Representative western blotting images. Densitometric analysis of (b) CaMKII, (c) p-CaMKII, (d) RyR2, (e) p-RyR2, (f) PLB, and (g) p-PLB expression levels (n = 3 cells per group). Data are presented as the mean ± SD. Statistical significance was determined by one-way ANOVA. P < 0.05 and ∗∗P < 0.01 vs. the control group. #P < 0.05 and ##P < 0.01 vs. the Ang II group. P < 0.05 and ▲▲P < 0.01; the control group in SiCaMKII or CsA vs. the control group in normal. P < 0.05 and △△P < 0.01; the Ang II group in SiCaMKII or CsA vs. the Ang II group in normal.
Figure 6
Figure 6
Effects of siCaMKII and CsA on Ang II-induced activation of CnA-NAFT signaling in H9c2 cells. (a) Representative western blotting images. Densitometric analysis of (b) CnA, (c) p-CnA, (d) NFATc4, (e) p-NFATc4, (f) GATA4, (g) p-GATA4, (h) ANP, and (i) BNP expression levels (n = 3 cells per group). Data are presented as the mean ± SD. Statistical significance was determined by one-way ANOVA. P < 0.05 and ∗∗P < 0.01 vs. the control group. #P < 0.05 and ##P < 0.01 vs. the Ang II group. P < 0.05 and ▲▲P < 0.01; the control group in SiCaMKII or CsA vs. the control group in normal. P < 0.05 and △△P < 0.01; the Ang II group in SiCaMKII or CsA vs. the Ang II group in normal.
Figure 7
Figure 7
Ang II-induced NFATc4 nuclear translocation is inhibited by siCaMKII. H9c2 cells were treated with Ang II (10−7 M) for 48 h. CaMKII was silenced or CsA (10−6 M) was added to the culture medium prior to Ang II administration. WXKL (5 g/L) was added for 24 h after Ang II administration. The control cells received no treatment. (a) Representative images of immunofluorescence staining of NFATc4. Blue: DAPI staining; red: NFATc4. Scale bar: 50 μm. Yellow arrow: nuclear translocation; white arrow: no nuclear translocation or nuclear translocation was decreased. (b) Semiquantitative analysis of NFATc4 nuclear translocation. Data are presented as the mean ± SD. Statistical significance was determined by one-way ANOVA. P < 0.05 and ∗∗P < 0.01 vs. the control group. #P < 0.05 and ##P < 0.01 vs. the Ang II group. P < 0.05 and ▲▲P < 0.01; the control group in SiCaMKII or CsA vs. the control group in normal. P < 0.05 and △△P < 0.01; the Ang II group in SiCaMKII or CsA vs. the Ang II group in normal.
Figure 8
Figure 8
Effects of siCaMKII and CsA on Ang II-induced activation of the inflammatory signal transduction pathway in H9c2 cells. (a) Representative western blotting images. Densitometric analysis of (b) MyD88, (c) NF-κB, (d) p-NF-κB, (e) TLR2, and (f) TLR4 expression levels (n = 3 cells per group). Data are presented as the mean ± SD. Statistical significance was determined by one-way ANOVA. P < 0.05 and ∗∗P < 0.01 vs. the control group. #P < 0.05 and ##P < 0.01 vs. the Ang II group. P < 0.05 and ▲▲P < 0.01; the control group in SiCaMKII or CsA vs. the control group in normal. P < 0.05 and △△P < 0.01; the Ang II group in SiCaMKII or CsA vs. the Ang II group in normal.
Figure 9
Figure 9
Ca2+-dependent signaling pathways in cardiac hypertrophy. Upon activation by CaM, CaN dephosphorylates cytoplasmic NFAT, a known hypertrophic transcription factor, and promotes its translocation to the nucleus and subsequent transcriptional activity. After silencing CaMKII, protein expression in the CaMKII and CaN-NFAT signaling pathways was inhibited, and the nuclear transfer of NFATc4 was decreased. CsA, an inhibitor of CaN, inhibits the expression in the CaN-NFAT pathway but activates the CaMKII signaling pathway, MyD88 inflammatory pathway, and ICa-L. WXKL improves CH through the CaMKII and CaN-NFAT signaling pathways. CaM: calmodulin; CaN: calcineurin; NFAT: nuclear factor of activated T cells; CaMKII: Ca2+/calmodulin-dependent protein kinase II; L-type Ca2+ current: ICa-L; CsA: cyclosporine A; WXKL: Wenxin Keli; CH: cardiac hypertrophy.

Similar articles

Cited by

References

    1. Schirone L., Forte M., Palmerio S., et al. A review of the molecular mechanisms underlying the development and progression of cardiac remodeling. Oxidative Medicine and Cellular Longevity. 2017;2017:9. doi: 10.1155/2017/3920195.3920195 - DOI - PMC - PubMed
    1. Fang H.-Y., Hung M.-Y., Lin Y.-M., et al. 17β-Estradiol and/or estrogen receptor alpha signaling blocks protein phosphatase 1 mediated ISO induced cardiac hypertrophy. PLoS One. 2018;13(5) doi: 10.1371/journal.pone.0196569.e0196569 - DOI - PMC - PubMed
    1. Yancy C. W., Jessup M., Bozkurt B., et al. 2013 ACCF/AHA guideline for the management of heart failure: executive summary: a report of the American College of cardiology foundation/American heart association task force on practice guidelines. Circulation. 2013;128(16):1810–1852. doi: 10.1161/CIR.0b013e31829e8807. - DOI - PubMed
    1. Balakumar P., Jagadeesh G. Multifarious molecular signaling cascades of cardiac hypertrophy: can the muddy waters be cleared? Pharmacological Research. 2010;62(5):365–383. doi: 10.1016/j.phrs.2010.07.003. - DOI - PubMed
    1. Shibu M. A., Kuo C.-H., Chen B.-C., et al. Oolong tea prevents cardiomyocyte loss against hypoxia by attenuating p-JNK mediated hypertrophy and enhancing P-IGF1R, p-akt, and p-Badser136 activity and by fortifying NRF2 antioxidation system. Environmental Toxicology. 2018;33(2):220–233. doi: 10.1002/tox.22510. - DOI - PubMed

LinkOut - more resources