. 2020 Sep 10;11(10):5488-5505.
doi: 10.1364/BOE.402475. eCollection 2020 Oct 1.

Analysis of retinal nerve fiber layer birefringence in patients with glaucoma and diabetic retinopathy by polarization sensitive OCT

Affiliations

Analysis of retinal nerve fiber layer birefringence in patients with glaucoma and diabetic retinopathy by polarization sensitive OCT

Sylvia Desissaire et al. Biomed Opt Express. .

Abstract

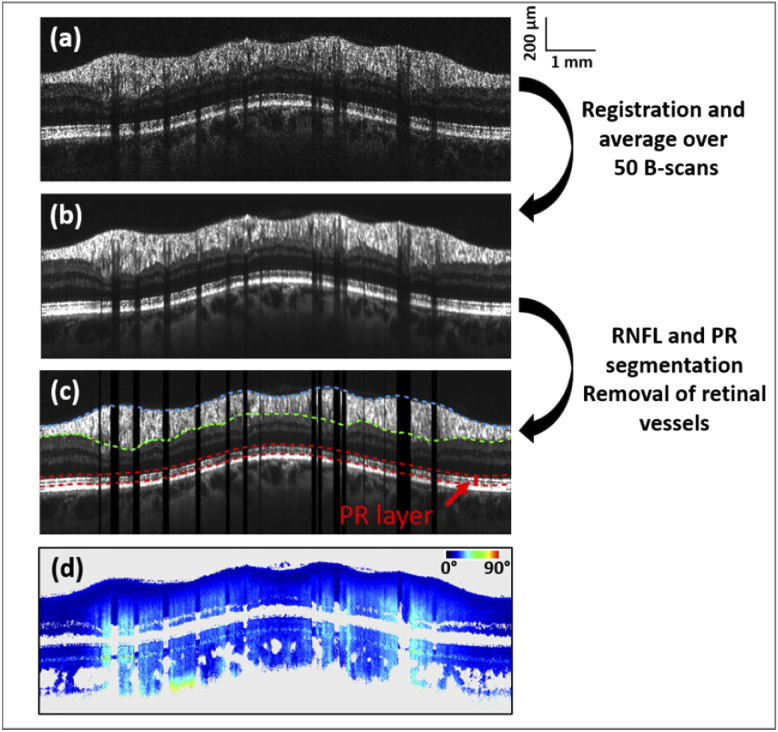
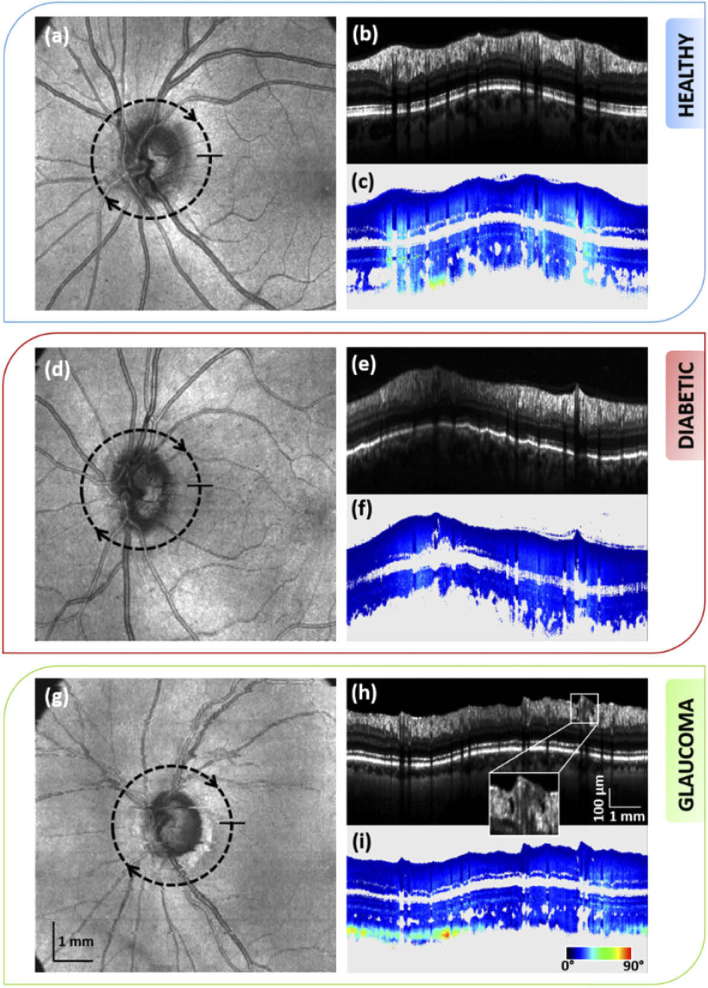
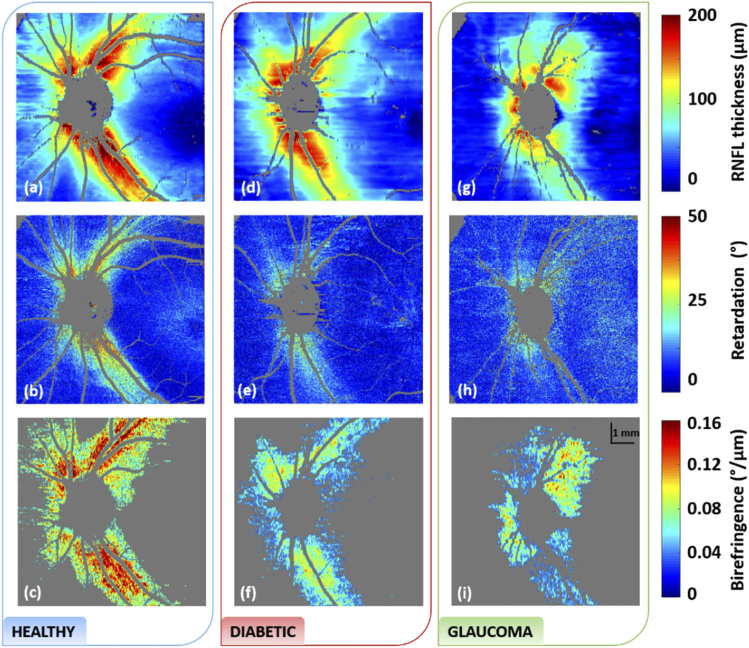
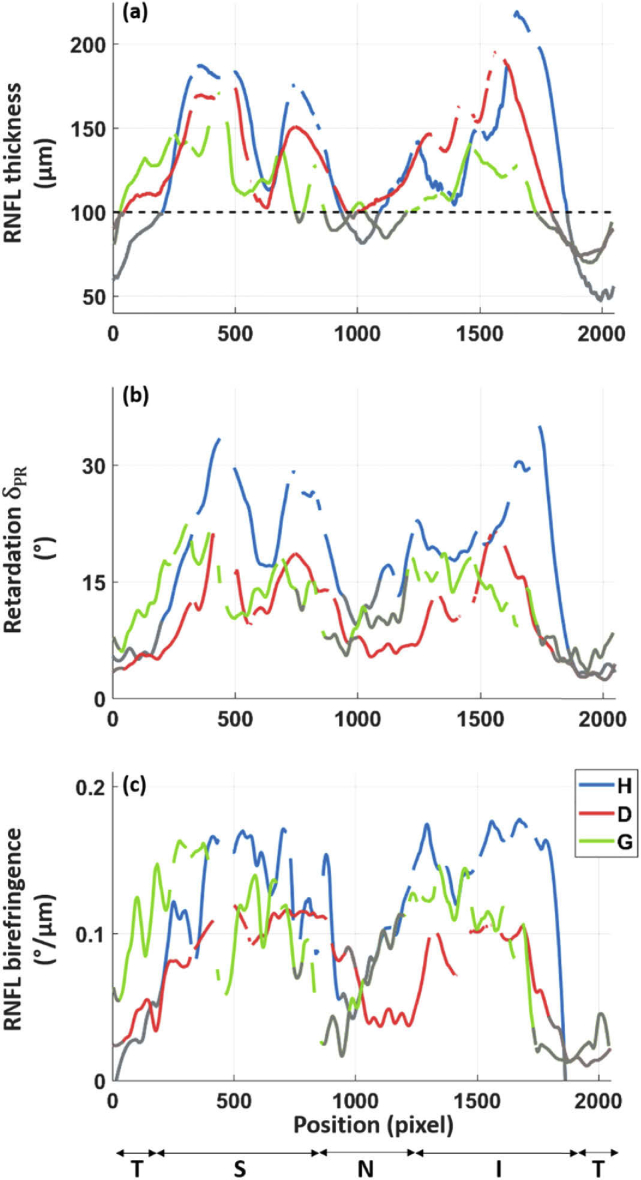
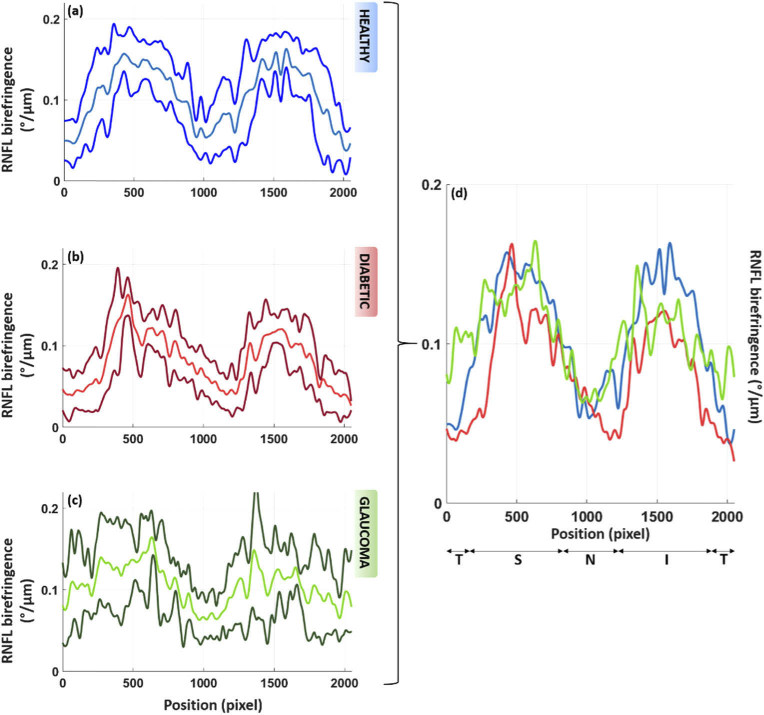
The retinal nerve fiber layer (RNFL) is a fibrous tissue that shows form birefringence. This optical tissue property is related to the microstructure of the nerve fiber axons that carry electrical signals from the retina to the brain. Ocular diseases that are known to cause neurologic changes, like glaucoma or diabetic retinopathy (DR), might alter the birefringence of the RNFL, which could be used for diagnostic purposes. In this pilot study, we used a state-of-the-art polarization sensitive optical coherence tomography (PS-OCT) system with an integrated retinal tracker to analyze the RNFL birefringence in patients with glaucoma, DR, and in age-matched healthy controls. We recorded 3D PS-OCT raster scans of the optic nerve head area and high-quality averaged circumpapillary PS-OCT scans, from which RNFL thickness, retardation and birefringence were derived. The precision of birefringence measurements was 0.005°/µm. As compared to healthy controls, glaucoma patients showed a slightly reduced birefringence (0.129 vs. 0.135°/µm), although not statistically significant. The DR patients, however, showed a stronger reduction of RNFL birefringence (0.103 vs. 0.135°/µm) which was highly significant. This result might open new avenues into early diagnosis of DR and related neurologic changes.


Conflict of interest statement

The authors declare no conflicts of interest.

Figures

Fig. 1.
Fig. 1.
Representative circular B-scans associated with the analysis of RNFL birefringence. Averaged intensity scan (b) is obtained by registration and averaging of 50 individual B-scans (a). RNFL thickness is obtained from the segmented upper (blue) and lower (green) boundaries of the RNFL layer as shown in (c). After segmentation of the RPE, the retardation values at the photoreceptor layer (boundaries in red in (c)) are obtained from the averaged retardation scan (d) for the RNFL birefringence calculation using the quotient method. In the case of the linear regression method, the linear fit at each A-scan location, whose slope corresponds to the RNFL birefringence, also uses the averaged retardation scan (d).
Fig. 2.
Fig. 2.
Comparison between the intensity and retardation averaged circular scan of the left eye of a healthy subject (b)-(c), a diabetic patient (e)-(f) and a glaucoma patient (h)-(i). Lower retardation is observed in the RNFL of the diseased retina as compared to the healthy one. Location of the circular scan is indicated on the corresponding en-face intensity maps, (a), (d) and (g). The framed area in the averaged intensity scan of the glaucoma subject (h) point out holes in the RNFL of this patient.
Fig. 3.
Fig. 3.
RNFL thickness (a,d,g), retardation (b, e, h) and birefringence (c, f, i) maps of the healthy, diabetic and glaucoma subjects shown in Fig. 2. Reduced retardation is seen in both the diabetic and glaucoma cases as compared to the healthy one. Reduced birefringence is particularly seen in the diabetic case, even in areas of thick NFL. A RNFL thickness threshold of 75 µm was used for visualization of the birefringence maps.
Fig. 4.
Fig. 4.
Graphs of the RNFL thickness (a), retardation (b) and birefringence (c) along a circle around the ONH for the healthy (H), diabetic (D) and glaucoma (G) subjects shown in Fig. 2. A sliding average over 10 A-scans was applied for all plots. The retardation and birefringence data were smoothen based on a local regression method. The gaps in the plots indicate vessel positions. The known double hump patterns of the RNFL are recognizable in the different graphs. The retardation and birefringence plots of the diabetic patient appear clearly lower compared to the ones of the healthy subject. While all values along the circumpapillary scan are shown here, only locations of RNFL thickness > 100 µm are used for the quantitative analysis. The values at RNFL thickness < 100 µm are displayed in gray. (T: temporal, S: superior, N: nasal, I: inferior, defined according to the GDx-VCC quadrant division).
Fig. 5.
Fig. 5.
Averaged RNFL birefringence along the circular scan for the three groups of volunteers, respectively, for the healthy subjects (a), the diabetic patients (b) and the glaucoma patients (c). The central line shows the mean value over the subjects of each group. The other lines show ± one standard deviation. To ease the comparison, the mean plots of each group are overlapped in (d). The averaged values are lower for the diabetic and glaucoma patients as compared to the healthy subjects. While all values along the circumpapillary scan are shown here, only locations of RNFL thickness > 100 µm are used for the quantitative analysis. Similarly to Fig. 4, (a) sliding average over 10 A-scans and smoothing of the data were applied for all plots.
Fig. 6.
Fig. 6.
Comparison between the directly recorded (averaged over 50 B-scans) circumpapillary scans - intensity (a) and retardation (b) – and images reconstructed from a 3D data set along the same circle as for the circular scan – intensity (c) and retardation (d) – of a healthy subject.

Similar articles

Cited by

References

    1. Quigley H. A., Broman A. T., “The number of people with glaucoma worldwide in 2010 and 2020,” Br. J. Ophthalmol. 90(3), 262–267 (2006).10.1136/bjo.2005.081224 - DOI - PMC - PubMed
    1. Sabanayagam C., Banu R., Chee M. L., Lee R., Wang Y. X., Tan G., Jonas J. B., Lamoureux E. L., Cheng C.-Y., Klein B. E. K., Mitchell P., Klein R., Cheung C. M. G., Wong T. Y., “Incidence and progression of diabetic retinopathy: a systematic review,” Lancet Diabetes Endocrinol. 7(2), 140–149 (2019).10.1016/S2213-8587(18)30128-1 - DOI - PubMed
    1. Weinreb R. N., Aung T., Medeiros F. A., “The pathophysiology and treatment of glaucoma: a review,” JAMA 311(18), 1901–1911 (2014).10.1001/jama.2014.3192 - DOI - PMC - PubMed
    1. Duh E. J., Sun J. K., Stitt A. W., “Diabetic retinopathy: current understanding, mechanisms, and treatment strategies,” JCI Insight 2(14), e93751 (2017).10.1172/jci.insight.93751 - DOI - PMC - PubMed
    1. Corcóstegui B., Durán S., González-Albarrán M. O., Hernández C., Ruiz-Moreno J. M., Salvador J., Udaondo P., Simó R., “Update on Diagnosis and Treatment of Diabetic Retinopathy: A Consensus Guideline of the Working Group of Ocular Health (Spanish Society of Diabetes and Spanish Vitreous and Retina Society),” J. Ophthalmol. 2017, 1–10 (2017).10.1155/2017/8234186 - DOI - PMC - PubMed

LinkOut - more resources