

Quantitative diffuse optical spectroscopy for noninvasive measurements of the malaria pigment hemozoin
- PMID: 33149987
- PMCID: PMC7587291
- DOI: 10.1364/BOE.401771
Quantitative diffuse optical spectroscopy for noninvasive measurements of the malaria pigment hemozoin
Abstract
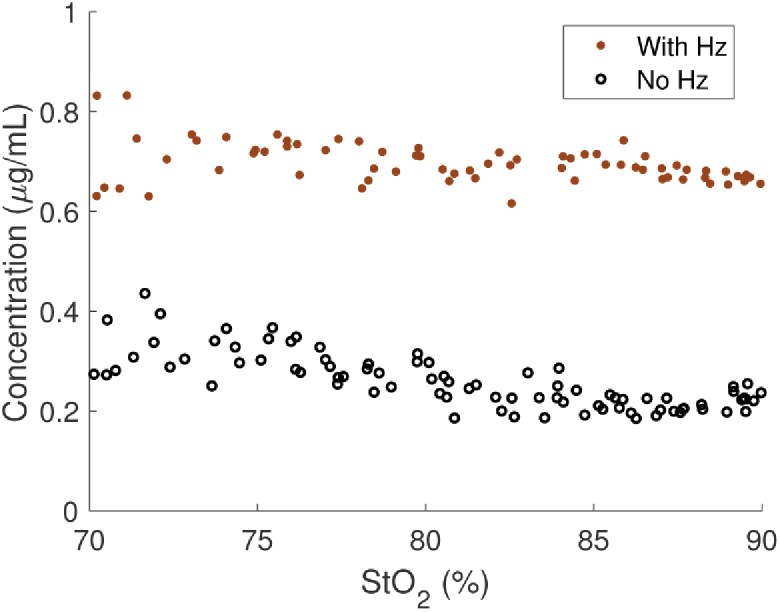
Hemozoin (Hz) is a crystal by-product of hemoglobin consumption by malaria parasites. There are currently no in vivo deep tissue sensing methods that can quantify Hz presence noninvasively, which would be advantageous for malaria research and treatment. In this work, we describe the broadband near-infrared optical characterization of synthetic Hz in static and dynamic tissue-simulating phantoms. Using hybrid frequency domain and continuous-wave near-infrared spectroscopy, we quantified the broadband optical absorption and scattering spectra of Hz and identified the presence of Hz at a minimum tissue-equivalent concentration of 0.014 µg/mL in static lipid emulsion phantoms simulating human adipose. We then constructed a whole blood-containing tissue-simulating phantom and demonstrated the detection of Hz at physiologically-relevant tissue oxygen saturations ranging from 70-90%. Our results suggest that quantitative diffuse optical spectroscopy may be useful for detecting deep tissue Hz in vivo.
© 2020 Optical Society of America under the terms of the OSA Open Access Publishing Agreement.
Conflict of interest statement
TDO discloses patents related to FD-DOS technology and ownership of NearWave, Inc, which is producing a commercial FD-DOS device. TDO: NearWave, Inc. (I, E, P)
Figures
Similar articles
-
Multi-modal diffuse optical spectroscopy for high-speed monitoring and wide-area mapping of tissue optical properties and hemodynamics.J Biomed Opt. 2021 Aug;26(8):085002. doi: 10.1117/1.JBO.26.8.085002. J Biomed Opt. 2021. PMID: 34390234 Free PMC article.
-
Stable tissue-simulating phantoms with various water and lipid contents for diffuse optical spectroscopy.Biomed Opt Express. 2018 Oct 29;9(11):5792-5808. doi: 10.1364/BOE.9.005792. eCollection 2018 Nov 1. Biomed Opt Express. 2018. PMID: 30460162 Free PMC article.
-
Quantitative broadband near-infrared spectroscopy of tissue-simulating phantoms containing erythrocytes.Phys Med Biol. 1998 Nov;43(11):3381-404. doi: 10.1088/0031-9155/43/11/014. Phys Med Biol. 1998. PMID: 9832022
-
In vivo absorption, scattering, and physiologic properties of 58 malignant breast tumors determined by broadband diffuse optical spectroscopy.J Biomed Opt. 2006 Jul-Aug;11(4):044005. doi: 10.1117/1.2337546. J Biomed Opt. 2006. PMID: 16965162
-
Imaging in breast cancer: diffuse optics in breast cancer: detecting tumors in pre-menopausal women and monitoring neoadjuvant chemotherapy.Breast Cancer Res. 2005;7(6):279-85. doi: 10.1186/bcr1358. Epub 2005 Nov 28. Breast Cancer Res. 2005. PMID: 16457705 Free PMC article. Review.
Cited by
-
Rapid and non-invasive detection of malaria parasites using near-infrared spectroscopy and machine learning.PLoS One. 2024 Mar 25;19(3):e0289232. doi: 10.1371/journal.pone.0289232. eCollection 2024. PLoS One. 2024. PMID: 38527002 Free PMC article.
-
Review of recent advances in frequency-domain near-infrared spectroscopy technologies [Invited].Biomed Opt Express. 2023 Jun 12;14(7):3234-3258. doi: 10.1364/BOE.484044. eCollection 2023 Jul 1. Biomed Opt Express. 2023. PMID: 37497520 Free PMC article. Review.
References
-
- “World malaria report 2019,” Library Catalog: www.who.int.
-
- Cibulskis R. E., Alonso P., Aponte J., Aregawi M., Barrette A., Bergeron L., Fergus C. A., Knox T., Lynch M., Patouillard E., Schwarte S., Stewart S., Williams R., “Malaria: Global progress 2000 - 2015 and future challenges,” Infect. Dis. Poverty 5(1), 61 (2016).10.1186/s40249-016-0151-8 - DOI - PMC - PubMed
-
- Tromberg B. J., Zhang Z., Leproux A., O’Sullivan T. D., Cerussi A. E., Carpenter P. M., Mehta R. S., Roblyer D., Yang W., Paulsen K. D., Pogue B. W., Jiang S., Kaufman P. A., Yodh A. G., Chung S. H., Schnall M., Snyder B. S., Hylton N., Boas D. A., Carp S. A., Isakoff S. J., Mankoff D., “Predicting Responses to Neoadjuvant Chemotherapy in Breast Cancer: ACRIN 6691 Trial of Diffuse Optical Spectroscopic Imaging,” Cancer Res. 76(20), 5933–5944 (2016).10.1158/0008-5472.CAN-16-0346 - DOI - PMC - PubMed