. 2020 Sep 30;11(10):5982-5994.
doi: 10.1364/BOE.402201. eCollection 2020 Oct 1.

Depth-resolved Mueller matrix polarimetry microscopy of the rat cornea

Affiliations

Depth-resolved Mueller matrix polarimetry microscopy of the rat cornea

V N Du Le et al. Biomed Opt Express. .

Abstract

Mueller matrix polarimetry (MMP) is a promising linear imaging modality that can enable visualization and measurement of the polarization properties of the cornea. Although the distribution of corneal birefringence has been reported, depth resolved MMP imaging of the cornea has not been archived and remains challenging. In this work, we perform depth-resolved imaging of the cornea using an improved system that combines Mueller matrix reflectance and transmission microscopy together with nonlinear microscopy utilizing second harmonic generation (SHG) and two photon excitation fluorescence (TPEF). We show that TPEF can reveal corneal epithelial cellular network while SHG can highlight the presence of corneal stromal lamellae. We then demonstrate that, in confocal reflectance measurement, as depth increases from 0 to 80 μm both corneal depolarization and retardation increase. Furthermore, it is shown that the spatial distribution of corneal depolarization and retardation displays similar complexity in both reflectance (confocal and non-confocal) and transmission measurement, likely due to the strong degree of heterogeneity in the stromal lamellae.


Conflict of interest statement

The authors declare no conflicts of interest.

Figures

Fig. 1.
Fig. 1.
Schematic diagram of the improved nonlinear and MMP laser scanning microscope. SHG and TPEF was collected with PMT1 and PMT2. A pair of liquid crystal variable retarders (LCVR1 and LCVR2) deliver six polarization states calibrated at the focal point of the 20X objective (Nikon Plan Apo 20X/0.75 DIC M/N2). In reflectance measurement, a fraction of a reflected signal from a sample is attenuated (ND), filtered (BP filter), further analyzed by another pair of liquid crystal variable retarders (LCVR3 and LCVR4) with a polarizer, and then acquired by the confocal and non-confocal reflectance PMTs (PMT3&4). In transmission measurement, another pair of LCVR5 and LCVR6 with a polarizer is used to analyze the transmitted signal which then collected by PMT5. D: beam dumps, BS: beam splitter, ND: neutral density filter, BP: bandpass filter, SL: scan lens, TL: tube lens, SP: short-pass filter
Fig. 2.
Fig. 2.
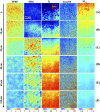
Depth-resolved images of a DAPI-stained rat cornea sample from confocal reflectance channel reveal cellular structure at top layers (up to 10 μm depth), and an increase of collagen (increase in SHG) as depth increases. The diameter of stained nuclei observed in TPEF channel at 0 μm depth is between 5 and 6.5 μm, resembling cellular nuclei in corneal basal epithelium [23]. The stromal collagen is visualized at beyond 10 μm depth.
Fig. 3.
Fig. 3.
Quantitative analysis of nonlinear and MMP signal of DAPI-stained rat cornea in Fig. 2: 3-D cube represents volume of data and graph represents percentage change in signal for the selected ROI in Fig. 2. SHG confirms collagen in basal epithelium and stroma whereas TPEF confirms cellular structure in corneal epithelium Changes in SHG also confirms the changes in polarization properties with an increase in both Δ and total R. Error bar represents standard error.
Fig. 4.
Fig. 4.
Depth-resolved images of unstained rat cornea from confocal reflectance channel: TPEF at top layers (A&B) reveals cellular network that resembles basal epithelium whereas SHG at bottom layers (D-F) represents the anterior and posterior stromal lamellae. Changes in SHG also confirms the changes in polarimetry images with an increase in both Δ and total R.
Fig. 5.
Fig. 5.
Quantitative analysis of nonlinear and MMP images in Fig. 4: 3-D cube represents volume of data whereas plot shows analysis of only ROI in Fig. 4. SHG remains high depth above 40 μm, confirming presence of collagen into deep stroma [17]. TPEF decreases with depth, consistent with the observed trend in DAPI-stained sample.
Fig. 6.
Fig. 6.
Another rat cornea sample measured with confocal reflectance channel: TPEF and SHG reveals the Bowman layer with subepithelial nerve plexus at 0-5 μm depth (C-D), and the epithelium-stroma interface at 15 μm. Selected region of interest (ROI, 90 × 90 μm2) is used for quantitative analysis in Fig. 7.
Fig. 7.
Fig. 7.
Quantitative analysis for ROI in Fig. 6: Top two rows show images at 10 and 70 μm depth whereas bottom row shows 3-D volume of SHG and TPEF, and percent change. Overall, retardation and depolarization do not change significantly with depth. Imaging maps however clearly show stronger degree of spatial retardation and depolarization 70 μm depth.
Fig. 8.
Fig. 8.
Images from transmission channel for the same cornea sample as in Fig. 6 at depth of 10 μm (a-c) and 70 μm (e-g). The bottom images (h-j) are zoomed in ROI (90 × 90 μm2) in (a-c). No significance changes in Δ and total R as depth increases. M11 shows similar cellular network to that of epithelium.
Fig. 9.
Fig. 9.
Images from non-confocal reflectance channel for the same cornea sample as in Fig. 5 at depth of 10 μm (a-c) and 70 μm (e-g). The bottom images (h-j) are zoomed in ROI (90 × 90 μm2) in (a-c). No significance changes in Δ, total R and M11 as depth increases. Zoomed in images (g-i) display similar complexity in Δ and total R as shown in Fig. 7.
Fig. 10.
Fig. 10.
Quantitative analysis for ROIs in Figs. 8&9 from 0 to 80 μm depth: (a) transmission and (b) non-confocal reflectance measurement. In compared to the trends shown in Fig. 3&5&7 for confocal reflectance measurement, no significant changes in Δ and total R were observed as depth increases.

References

    1. Westphal P., Kaltenbach J. M., Wicker K., “Corneal birefringence measured by spectrally resolved Mueller matrix ellipsometry and implications for non-invasive glucose monitoring,” Biomed. Opt. Express 7(4), 1160–1174 (2016).10.1364/BOE.7.001160 - DOI - PMC - PubMed
    1. Tuchin V. V., “Polarized light interaction with tissues,” J. Biomed. Opt. 21(7), 071114 (2016).10.1117/1.JBO.21.7.071114 - DOI - PubMed
    1. Ghosh N., Vitkin I. A., “Tissue polarimetry: concepts, challenges, applications, and outlook,” J. Biomed. Opt. 16(11), 110801 (2011).10.1117/1.3652896 - DOI - PubMed
    1. Vizet J., Rehbinder J., Deby S., Roussel S., Nazac A., Soufan R., Genestie C., Haie-Meder C., Fernandez H., Moreau F., Pierangelo A., “In vivo imaging of uterine cervix with a Mueller polarimetric colposcope,” Sci. Rep. 7(1), 2471 (2017).10.1038/s41598-017-02645-9 - DOI - PMC - PubMed
    1. Pierangelo A., Nazac A., Benali A., Validire P., Cohen H., Novikova T., Ibrahim B. H., Manhas S., Fallet C., Antonelli M.-R., Martino A.-D., “Polarimetric imaging of uterine cervix: a case study,” Opt. Express 21(12), 14120–14130 (2013).10.1364/OE.21.014120 - DOI - PubMed

LinkOut - more resources