

Cross-frequency coupling between gamma oscillations and deep brain stimulation frequency in Parkinson's disease
- PMID: 33150359
- PMCID: PMC7116448
- DOI: 10.1093/brain/awaa297
Cross-frequency coupling between gamma oscillations and deep brain stimulation frequency in Parkinson's disease
Abstract
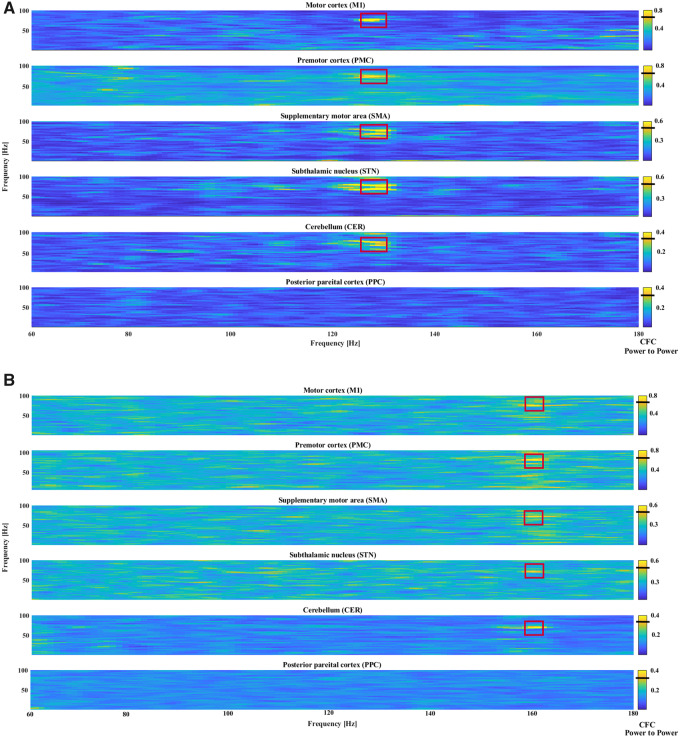
The disruption of pathologically enhanced beta oscillations is considered one of the key mechanisms mediating the clinical effects of deep brain stimulation on motor symptoms in Parkinson's disease. However, a specific modulation of other distinct physiological or pathological oscillatory activities could also play an important role in symptom control and motor function recovery during deep brain stimulation. Finely tuned gamma oscillations have been suggested to be prokinetic in nature, facilitating the preferential processing of physiological neural activity. In this study, we postulate that clinically effective high-frequency stimulation of the subthalamic nucleus imposes cross-frequency interactions with gamma oscillations in a cortico-subcortical network of interconnected regions and normalizes the balance between beta and gamma oscillations. To this end we acquired resting state high-density (256 channels) EEG from 31 patients with Parkinson's disease who underwent deep brain stimulation to compare spectral power and power-to-power cross-frequency coupling using a beamformer algorithm for coherent sources. To show that modulations exclusively relate to stimulation frequencies that alleviate motor symptoms, two clinically ineffective frequencies were tested as control conditions. We observed a robust reduction of beta and increase of gamma power, attested in the regions of a cortical (motor cortex, supplementary motor area, premotor cortex) and subcortical network (subthalamic nucleus and cerebellum). Additionally, we found a clear cross-frequency coupling of narrowband gamma frequencies to the stimulation frequency in all of these nodes, which negatively correlated with motor impairment. No such dynamics were revealed within the control posterior parietal cortex region. Furthermore, deep brain stimulation at clinically ineffective frequencies did not alter the source power spectra or cross-frequency coupling in any region. These findings demonstrate that clinically effective deep brain stimulation of the subthalamic nucleus differentially modifies different oscillatory activities in a widespread network of cortical and subcortical regions. Particularly the cross-frequency interactions between finely tuned gamma oscillations and the stimulation frequency may suggest an entrainment mechanism that could promote dynamic neural processing underlying motor symptom alleviation.
Keywords: cross-frequency coupling; deep brain stimulation; gamma oscillations; source analysis; volume of tissue activated.
© The Author(s) (2020). Published by Oxford University Press on behalf of the Guarantors of Brain.
Figures


References
-
- Abbasi O, Hirschmann J, Storzer L, Ozkurt TE, Elben S, Vesper J, et al. Unilateral deep brain stimulation suppresses alpha and beta oscillations in sensorimotor cortices. Neuroimage 2018; 174: 201–7. - PubMed
-
- Allert N, Cheeran B, Deuschl G, Barbe MT, Csoti I, Ebke M, et al. Postoperative rehabilitation after deep brain stimulation surgery for movement disorders. Clin Neurophysiol 2018; 129: 592–601. - PubMed
-
- Alonso-Frech F, Zamarbide I, Alegre M, Rodriguez-Oroz MC, Guridi J, Manrique M, et al. Slow oscillatory activity and levodopa-induced dyskinesias in Parkinson's disease. Brain 2006; 129 (Pt 7): 1748–57. - PubMed
-
- Amjad AM, Halliday DM, Rosenberg JR, Conway BA.. An extended difference of coherence test for comparing and combining several independent coherence estimates: theory and application to the study of motor units and physiological tremor. J Neurosci Methods 1997; 73: 69–79. - PubMed
Publication types
MeSH terms
Grants and funding
LinkOut - more resources
Full Text Sources
Other Literature Sources
Medical
