Observational Study
. 2021 Mar 1;56(3):321-330.
doi: 10.4085/205-20.

Athlete Workloads During Collegiate Women's Soccer Practice: Implications for Return to Play

Affiliations
Observational Study

Athlete Workloads During Collegiate Women's Soccer Practice: Implications for Return to Play

Natalie Kupperman et al. J Athl Train. .

Abstract

Context: Athlete monitoring via wearable technology is often used in soccer athletes. Although researchers have tracked global outcomes across soccer seasons, little information exists on athlete loads during individual practice drills. Understanding these demands is important for athletic trainers in making decisions about return to play.

Objective: To provide descriptive information on total distance, total player load (PL), total distance per minute, and PL per minute for practice drill structures and game play by player position among female soccer athletes across a competitive season.

Design: Retrospective observational study.

Setting: National Collegiate Athletic Association Division I university.

Patients or other participants: A total of 32 female collegiate soccer players (age = 20 ± 1 years, height = 168.75 ± 4.28 cm).

Intervention(s): Athletes wore a single global positioning system and triaxial accelerometer unit during all practices and games in a single soccer season. Individual practice drills were labeled by the team's strength and conditioning coach and binned into physical, technical and tactical skills and large- and small-sided competition drill structures.

Main outcome measure(s): Descriptive analyses were used to assess the median total distance, total PL, total distance per minute, and PL per minute by drill structure and player position (defender, forward or striker, and midfielder) during practices and games.

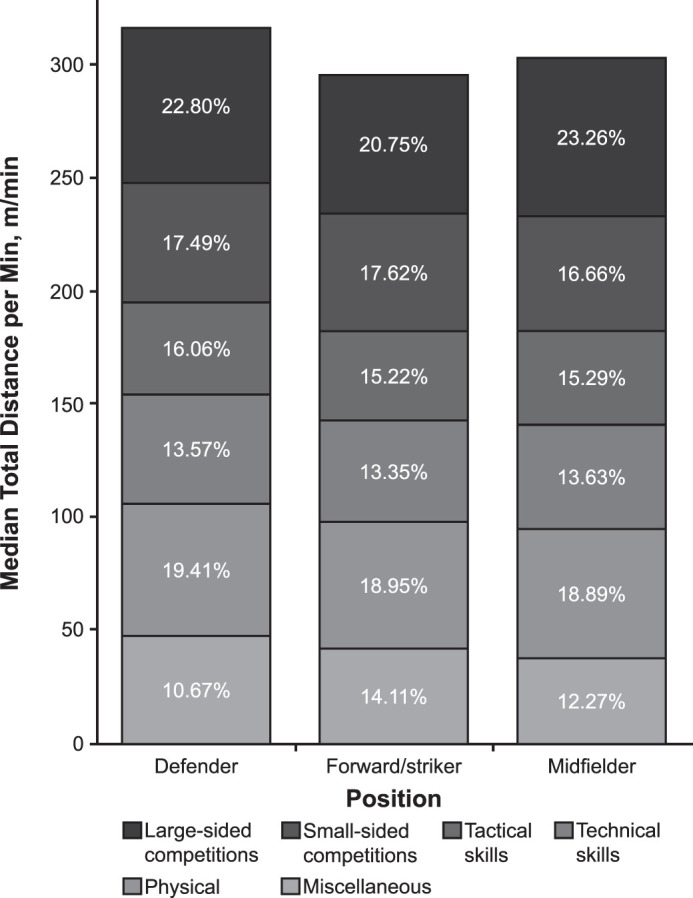
Results: Large- and small-sided competition drills imposed the greatest percentage of workload across all measures for each position (approximately 20% of total practice), followed by physical drills. When comparing technical and tactical skills drills, we found that technical skills drills required athletes to cover a greater distance (approximately 17% for technical skills and 15% for tactical skills), and tactical skills drills required higher play intensity during practices across all positions (approximately 18% for technical skills and 13% for tactical skills). Defenders had the highest median PL outcomes of all positions during practices.

Conclusions: Different practice drill types imposed various levels of demands, which simulated game play, on female soccer athletes. Athletic trainers and other clinicians may use this information in formulating objective return-to-play guidelines for injured collegiate women's soccer players.

Keywords: global positioning system; load; practice athlete monitoring; rehabilitation.


Figures

Figure 1
Figure 1
Distribution plots of total distance were based on drill type and athlete position. The distribution of total distance in an average practice was categorized by total session, drill type, and athlete position. The horizontal line in the overlaid box plot represents median values, box widths represent the first (25%) and third (75%) quantiles, and whiskers represent box quantiles ±1.5 × interquartile range. The individual dots reflect outliers in the data. The violin plot is a kernel density estimation showing the distribution shape of the data points.
Figure 2
Figure 2
Distribution plots of total distance per minute were based on drill type and athlete position. The distribution of total distance per minute in an average practice was categorized by total session, drill type, and athlete position. The horizontal line in the overlaid box plot represents median values, box widths represent the first (25%) and third (75%) quantiles, and whiskers represent box quantiles ±1.5 × interquartile range. The individual dots reflect outliers in the data. The violin plot is a kernel density estimation showing the distribution shape of the data points.
Figure 3
Figure 3
Distribution plots of total player load were based on drill type and athlete position. The distribution of player load in an average practice was categorized by total session, drill type, and athlete position. The horizontal line in the overlaid box plot represents median values, box widths represent the first (25%) and third (75%) quantiles, and whiskers represent box quantiles ±1.5 × interquartile range. The individual dots reflect outliers in the data. The violin plot is a kernel density estimation showing the distribution shape of the data points. Abbreviation: AU, arbitrary units.
Figure 4
Figure 4
Distribution plots of player load per minute were based on drill type and athlete position. The distribution of player load per minute in an average practice was categorized by total session, drill type, and athlete position. The horizontal line in the overlaid box plot represents median values, box widths represent the first (25%) and third (75%) quantiles, and whiskers represent box quantiles ±1.5 × interquartile range. The individual dots reflect outliers in the data. The violin plot is a kernel density estimation showing the distribution shape of the data points. Abbreviation: AU, arbitrary units.
Figure 5
Figure 5
Total distance by position. Stacked bar plots depict median total distance outcomes by drill structure for each women's soccer field position. The percentage of the session total for each drill structure is presented in the bar plot as a tooltip.
Figure 6
Figure 6
Total distance per minute by position. Stacked bar plots depict median total distance per minute outcomes by drill structure for each women's soccer field position. The percentage of the session total for each drill structure is presented in the bar plot as a tooltip.
Figure 7
Figure 7
Total player load by position. Stacked bar plots depict median total player load outcomes by drill structure for each women's soccer field position. The percentage of the session total for each drill structure is presented in the bar plot as a tooltip. Abbreviation: AU, arbitrary units.
Figure 8
Figure 8
Player load per minute by position. Stacked bar plots depict median player load per minute outcomes by drill structure (shades of gray) for each women's soccer field position. The percentage of the session total for each drill structure is presented in the bar plot as a tooltip. Abbreviation: AU, arbitrary units.
Figure 9
Figure 9
A, Median total distance. B, total distance per minute. C, total player load. D, total player load per minute in game by position. Abbreviation: AU, arbitrary units.

References

    1. Coughlan GF, Green BS, Pook PT, Toolan E, O'Connor SP. Physical game demands in elite rugby union: a global positioning system analysis and possible implications for rehabilitation. J Orthop Sports Phys Ther. 2011;41(8):600–605. doi: 10.2519/jospt.2011.3508. - DOI - PubMed
    1. Gabbett TJ, Nassis GP, Oetter E, et al. The athlete monitoring cycle: a practical guide to interpreting and applying training monitoring data. Br J Sports Med. 2017;51(20):1451–1452. doi: 10.1136/bjsports-2016-097298. - DOI - PubMed
    1. Austin DJ, Kelly SJ. Positional differences in professional rugby league match play through the use of global positioning systems. J Strength Cond Res. 2013;27(1):14–19. doi: 10.1519/JSC.0b013e31824e108c. - DOI - PubMed
    1. Austin DJ, Kelly SJ. Professional rugby league positional match-play analysis through the use of global positioning system. J Strength Cond Res. 2014;28(1):187–193. doi: 10.1519/JSC.0b013e318295d324. - DOI - PubMed
    1. Delaney JA, Duthie GM, Thornton HR, Scott TJ, Gay D, Dascombe BJ. Acceleration-based running intensities of professional rugby league match play. Int J Sports Physiol Perform. 2016;11(6):802–809. doi: 10.1123/ijspp.2015-0424. - DOI - PubMed

Publication types

LinkOut - more resources