. 2021 Feb;35(2):e21158.
doi: 10.1096/fj.202001820R. Epub 2020 Nov 5.

Transcription factor old astrocyte specifically induced substance is a novel regulator of kidney fibrosis

Affiliations

Transcription factor old astrocyte specifically induced substance is a novel regulator of kidney fibrosis

Ayaha Yamamoto et al. FASEB J. 2021 Feb.

Abstract

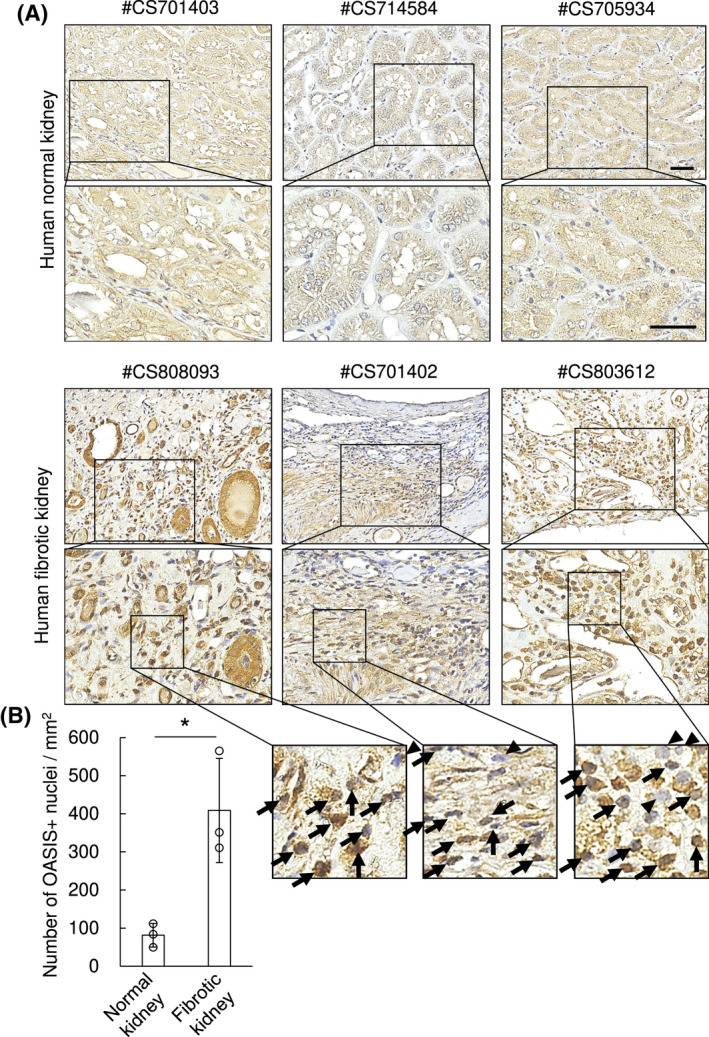
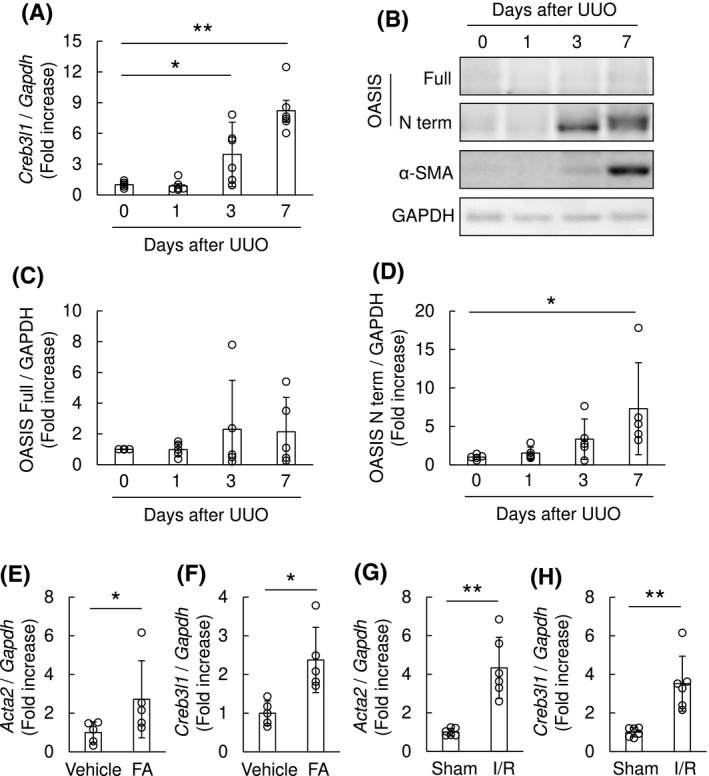
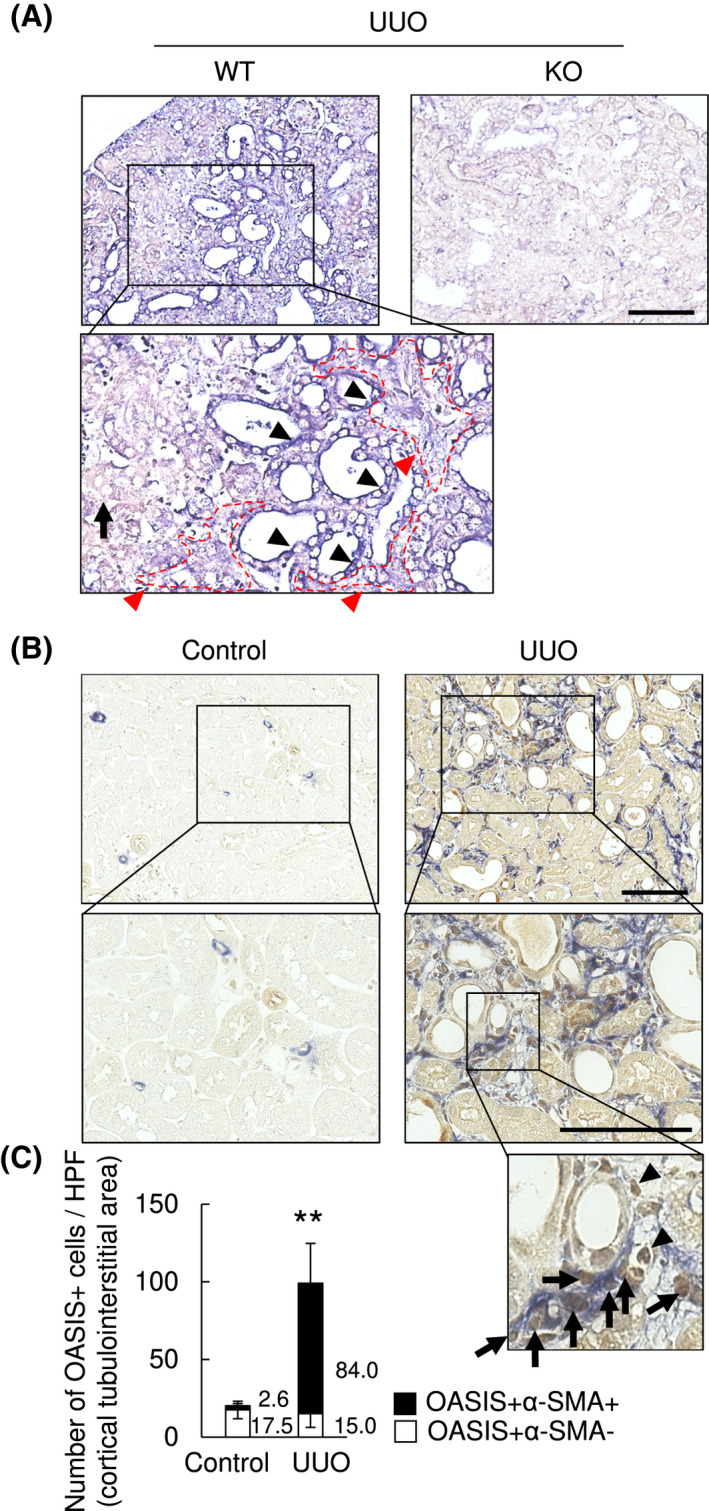
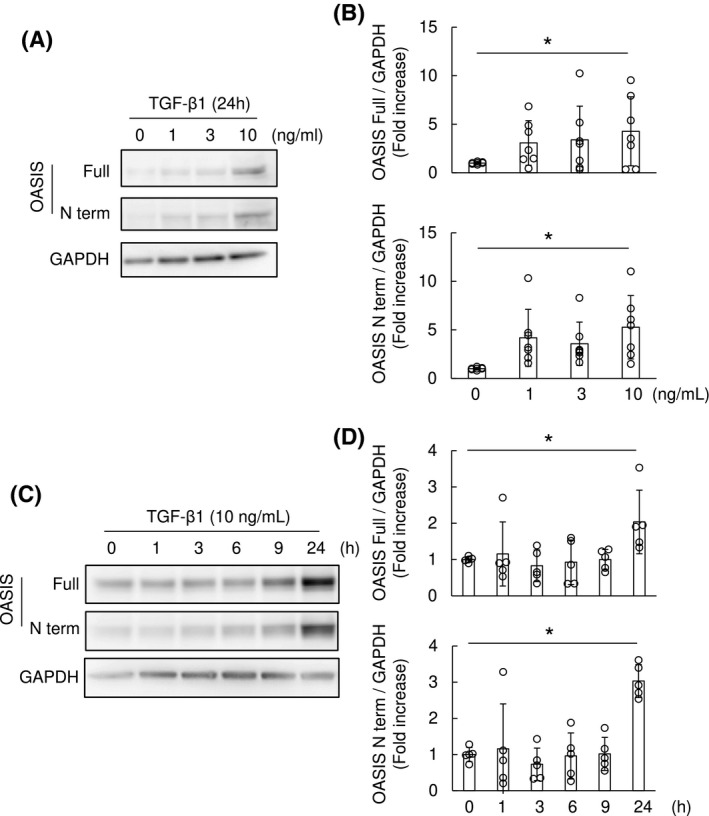
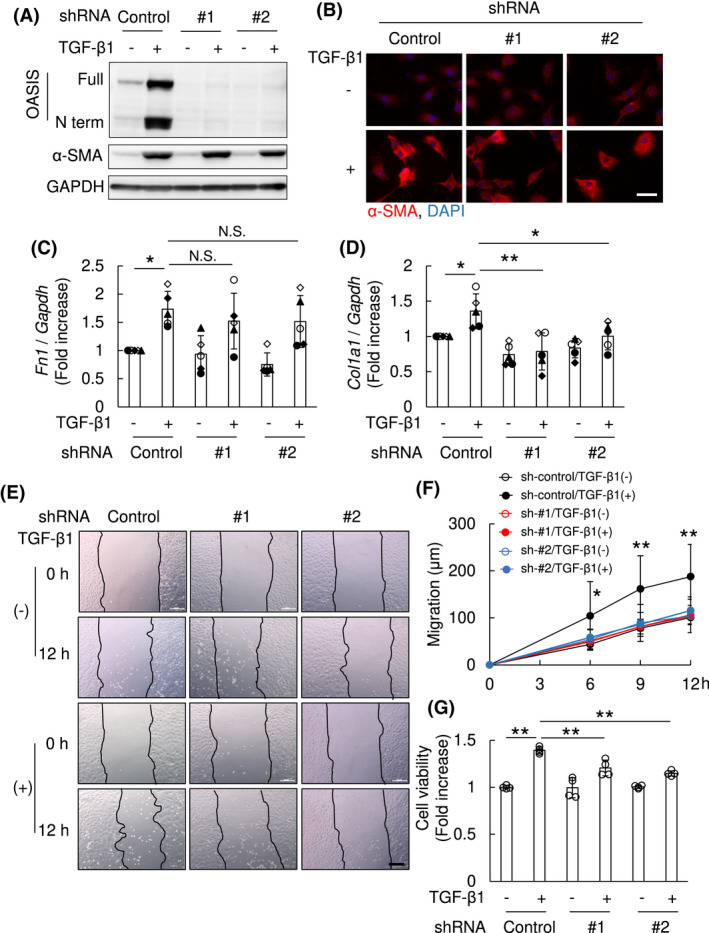
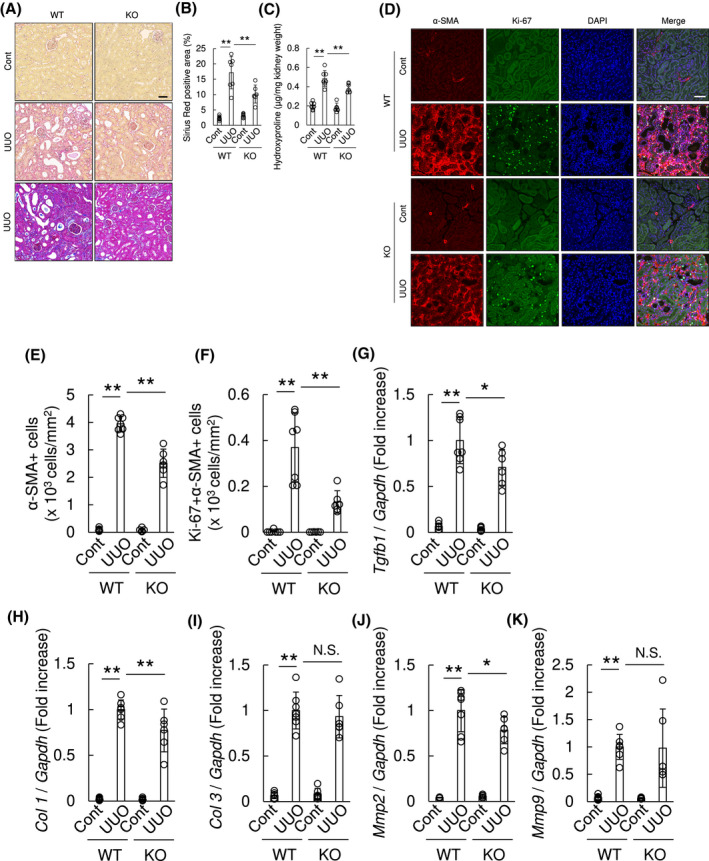
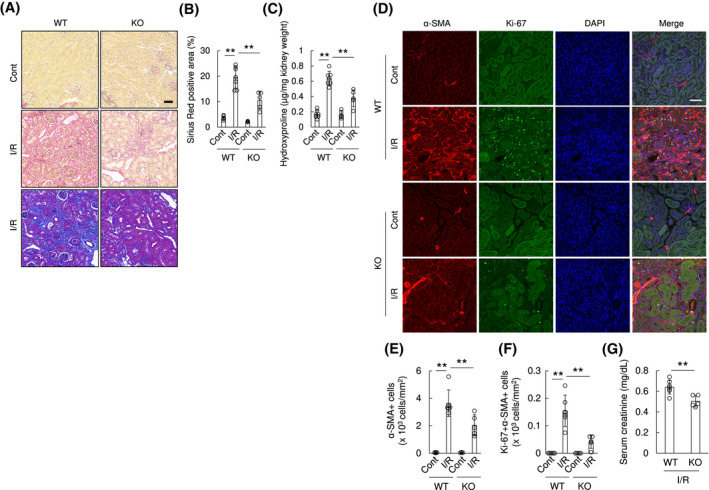
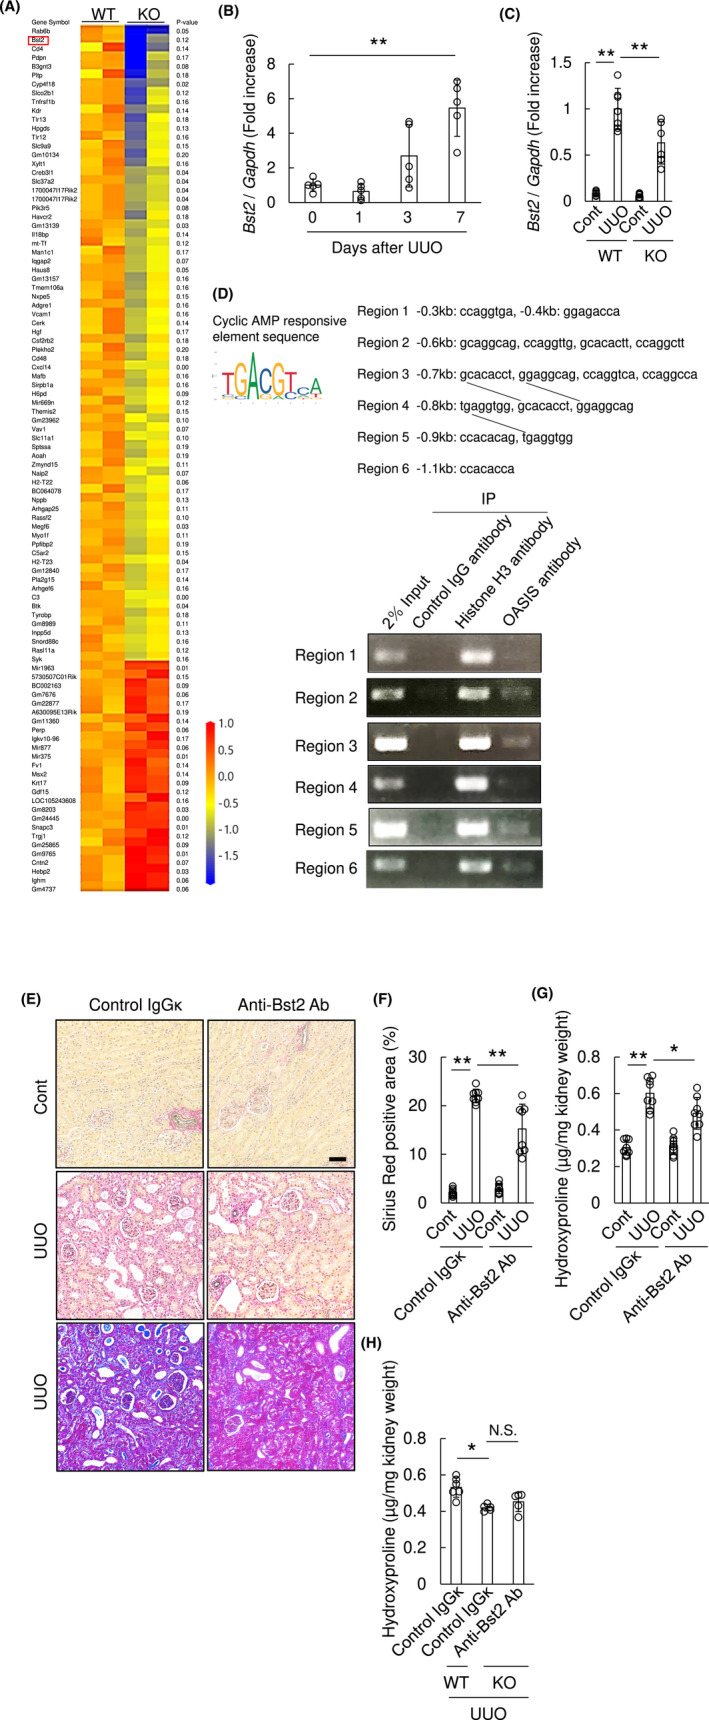
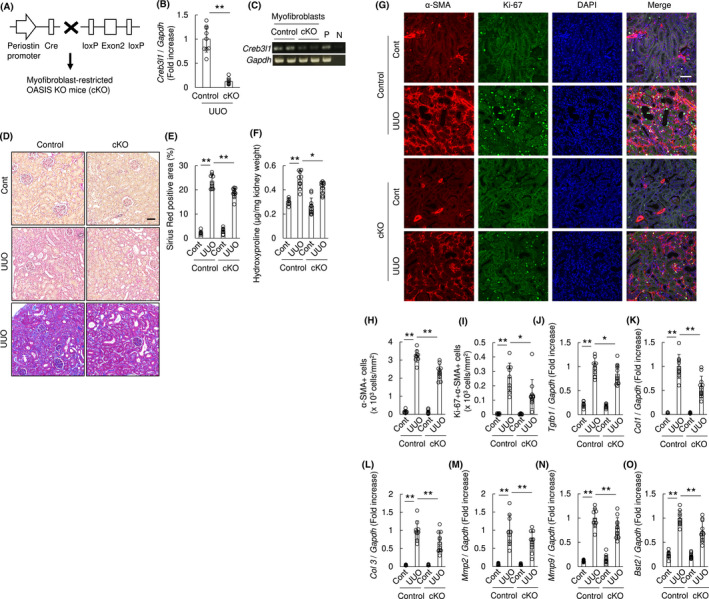
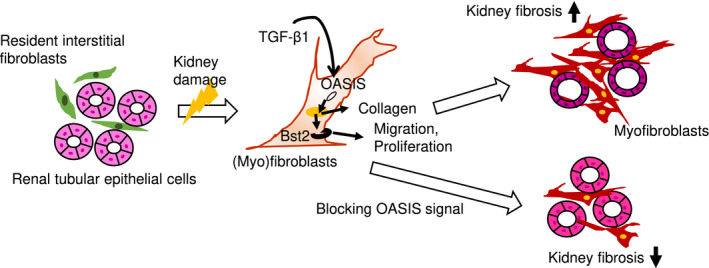
Prevention of kidney fibrosis is an essential requisite for effective therapy in preventing chronic kidney disease (CKD). Here, we identify Old astrocyte specifically induced substance (OASIS)/cAMP responsive element-binding protein 3-like 1 (CREB3l1), a CREB/ATF family transcription factor, as a candidate profibrotic gene that drives the final common pathological step along the fibrotic pathway in CKD. Although microarray data from diseased patient kidneys and fibrotic mouse model kidneys both exhibit OASIS/Creb3l1 upregulation, the pathophysiological roles of OASIS in CKD remains unknown. Immunohistochemistry revealed that OASIS protein was overexpressed in human fibrotic kidney compared with normal kidney. Moreover, OASIS was upregulated in murine fibrotic kidneys, following unilateral ureteral obstruction (UUO), resulting in an increase in the number of OASIS-expressing pathological myofibroblasts. In vitro assays revealed exogenous TGF-β1 increased OASIS expression coincident with fibroblast-to-myofibroblast transition and OASIS contributed to TGF-β1-mediated myofibroblast migration and increased proliferation. Significantly, in vivo kidney fibrosis induced via UUO or ischemia/reperfusion injury was ameliorated by systemic genetic knockout of OASIS, accompanied by reduced myofibroblast proliferation. Microarrays revealed that the transmembrane glycoprotein Bone marrow stromal antigen 2 (Bst2) expression was reduced in OASIS knockout myofibroblasts. Interestingly, a systemic anti-Bst2 blocking antibody approach attenuated kidney fibrosis in normal mice but not in OASIS knockout mice after UUO, signifying Bst2 functions downstream of OASIS. Finally, myofibroblast-restricted OASIS conditional knockouts resulted in resistance to kidney fibrosis. Taken together, OASIS in myofibroblasts promotes kidney fibrosis, at least in part, via increased Bst2 expression. Thus, we have identified and demonstrated that OASIS signaling is a novel regulator of kidney fibrosis.

Keywords: chronic kidney disease; fibrosis; myofibroblast; transcription regulation.


Conflict of interest statement

The authors have declared that no conflict of interest exists.

Figures

FIGURE 1
FIGURE 1
The number of OASIS‐positive nuclei was increased in the tubulointerstitium area of human fibrotic kidneys. A, Immunohistochemical analysis was performed with anti‐OASIS antibody (brown) in human kidney sections. Nuclei (blue) were stained with hematoxylin. Bar: 50 μm. B, OASIS‐positive nuclei were counted. Data are shown as mean ± SD (n = 3) * P < .05 by student's t test
FIGURE 2
FIGURE 2
Expression of OASIS was upregulated in murine fibrotic kidneys. A, Total RNA was prepared from the murine kidneys after UUO. The expression of OASIS/Creb3l1 transcript was analyzed at indicated time points after UUO by quantitative RT‐PCR. The expression of the transcript was normalized to that of Gapdh. Data are shown as mean ± SD (n = 6), ** P < .01 vs. Day 0 by one‐way ANOVA followed by Dunnett test. B, The kidney lysates from mice at 0, 1, 3 and 7 days after UUO were immunoblotted with anti‐OASIS, anti‐α‐SMA and anti‐GAPDH antibodies. Representative images are shown. C and D, Quantitative analysis for protein expression levels of OASIS in kidneys after UUO. Data are shown as mean ± SD (n = 5), * P < .05 vs. Day 0 by one‐way ANOVA followed by Dunnett test. E‐H, The expression of Acta2 (E, G) and OASIS/Creb3l1 (F, H) transcripts was estimated at 2 weeks after folic acid treatment (E, F; n = 5) or at 3 weeks after ischemia and reperfusion (I/R) injury (G, H; n = 6). The expression of the transcripts was normalized to that of Gapdh. Data are shown as mean ± SD, * P < .05, ** P < .01 vs. vehicle or sham by student's t test
FIGURE 3
FIGURE 3
The number of OASIS positive myofibroblasts was significantly increased after UUO. Murine kidney sections were prepared 7 days after UUO. A, In situ hybridization analysis was performed. Black arrowheads: OASIS/Creb3l1‐positive dilated tubules, black arrows: OASIS/Creb3l1‐weakly positive/negative tubules, red arrows (the area surrounded by red dotted line): OASIS/Creb3l1‐positive tubulointerstitial area, WT: Wild‐type, KO: OASIS knockout mouse. Bar: 50 µm. B, Immunohistochemical analysis was performed with anti‐OASIS antibody (brown) and anti‐α‐SMA antibody (blue). Representative images are shown. Arrows: OASIS + α‐SMA+ cells, arrowheads: OASIS + α‐SMA− cells in the tubulointerstitium. Bar: 50 µm. C, OASIS + cells in the tubulointerstitium were quantitatively estimated. Data are shown as mean ± SD (n = 5 animals) ** P < .01 by student's t test (Number of OASIS + α‐SMA+ cells in contralateral (Control) kidney vs. OASIS + α‐SMA+ cells in UUO kidney)
FIGURE 4
FIGURE 4
TGF‐β1 increased OASIS expression in NRK49F cells. A and B, NRK49F cells were stimulated with TGF‐β1 at the indicated concentrations for 24 hours. Immunoblotting was performed with anti‐OASIS and anti‐GAPDH antibodies. Representative images and quantitative analysis are shown. Data are shown as mean ± SD * P < .05 vs. Day 0 by ANOVA followed by Williams test, (n = 7). C and D, NRK49F cells were stimulated with TGF‐β1 (10 ng/mL) for the indicated time. The cell lysates were immunoblotted with anti‐OASIS and anti‐GAPDH antibodies. Representative images and quantitative results are shown. Data are shown as mean ± SD * P < .05 vs. Day 0 by ANOVA followed by Williams test (n = 5)
FIGURE 5
FIGURE 5
OASIS was necessary for TGF‐β1–mediated migration and proliferation in NRK49F cells. NRK49F cells were transfected with lentivirus expressing shRNA against OASIS/Creb3l1 (OASIS; #1 and #2), or a scramble control. At 24 hours after transfection, cells were stimulated with TGF‐β1 (10 ng/mL) for 24 hours. A, Immunoblot analysis was performed using anti‐OASIS, anti‐α‐SMA and anti‐GAPDH antibodies. Representative images are shown. Experiments were repeated three times with similar results. B, Immunofluorescence analysis was performed with anti‐α‐SMA antibody. Nuclei were identified by DAPI. Representative images are shown. Bar: 50 µm. C and D, Quantitative PCR was performed for transcript expression of fibronectin (Fn1) and collagen1a1 (Col1a1). The expression of the transcripts was normalized to that of Gapdh. Data are shown as mean ± SD (n = 5 times). The types of dot plots were displayed for each assay. * P < .05, ** P < .01 by one‐way ANOVA followed by Dunnett test. E and F, Cell migration induced by TGF‐β1 was examined by scratch assay. Representative images are shown (E, Bar: 200 µm). The migration distance was measured (F). Data are shown as mean ± SD (n = 7) * P < .05, ** P < .01 vs. other conditions by one‐way ANOVA followed by Dunnett test. G, Cell proliferation was examined by CellTiter‐Blue Cell viability assay. Values are shown as mean ± SD (quadruplicate), ** P < .01 by one‐way ANOVA followed by Dunnett test. Similar results were obtained from four independent experiments
FIGURE 6
FIGURE 6
Kidney fibrosis was reduced in OASIS KO mice after UUO. WT and OASIS KO mice were exposed to UUO, and analyzed at 7 days after UUO. Contralateral kidney (Cont) was used as a control. A, Representative images show the results of Sirius Red staining (upper and middle panel) or Masson's trichrome staining (lower panel). Bar: 50 µm. B, Sirius Red positive area was calculated. C, Hydroxyproline content in the kidney tissues was evaluated. D, Immunofluorescence analysis was performed with anti‐Ki‐67 antibody, anti‐α‐SMA antibody and DAPI. Representative images are shown. Bar: 50 µm. E and F, The number of α‐SMA+ cells (E) and the number of Ki‐67 + α‐SMA+ cells (F) was counted. G‐K, Quantitative PCR was performed for transcript expression of Tgfb1, Col 1, Col 3, Mmp2 and Mmp9. The expression of the transcripts was normalized to that of Gapdh. * P < .05, ** P < .01, by one‐way ANOVA followed by Dunnett test. Data are shown as mean ± SD (n = 7 for WT, n = 6 for KO)
FIGURE 7
FIGURE 7
Genetic deletion of OASIS resulted in decreased kidney fibrosis after ischemia and reperfusion. WT and OASIS KO mice were subjected to unilateral renal I/R. A, Three weeks post I/R, the kidney sections were stained with Sirius Red (upper and middle panel) or Masson's trichrome (lower panel). Representative images are shown. Bar: 50 µm. B, Sirius Red positive area was evaluated. C, Hydroxyproline content in the kidney tissues was evaluated. D, Immunofluorescence analysis was performed with anti‐Ki‐67 antibody, anti‐α‐SMA antibody, and DAPI. Representative images are shown. Bar: 50 µm. E and F, The number of α‐SMA+ cells (E) and the number of Ki‐67 + α‐SMA+ cells (F) was counted. ** P < .01 by one‐way ANOVA followed by Dunnett test. G, Serum creatinine level was measured 3 weeks after I/R. ** P < .05 by student's t test. Data are shown as mean ± SD (n = 6 for WT, n = 5 for KO)
FIGURE 8
FIGURE 8
Blocking Bst2, a candidate downstream pro‐fibrotic effector of OASIS, attenuated kidney fibrosis. A, Myofibroblasts were isolated from kidneys of WT and OASIS KO mice at Day 7 after UUO. Twenty‐four hours after TGF‐β1 treatment, the total mRNA was extracted from the cells and microarray analysis was performed (n = 2 in each group). Heat map shows the genes with >1.5‐fold change between WT and OASIS KO cells with a P‐value of <0.2. B, The expression of Bst2 transcript was measured at indicated time points after UUO by quantitative RT‐PCR. The expression of the transcript was normalized to that of Gapdh. Data are shown as mean ± SD (n = 5). C, At Day 7 after UUO, the transcript expression of Bst2 in kidney of WT and OASIS KO mice was analyzed by quantitative PCR. Data are shown as mean ± SD (n = 7 for WT, n = 6 for KO). D, Upper panel, cAMP responsive element‐like sequence was cited from JASPAR and was picked up in the upstream region of Bst2 gene. The line indicates same sequence. Lower panel, isolated myofibroblasts were treated with TGF‐β1 and chromatin immunoprecipitation assay was conducted. E‐G, C57BL/6J mice were intraperitoneally treated with anti‐Bst2 antibody or control IgGκ at Day 1 after UUO. E, Seven days after UUO, Sirius Red (upper and middle panel) or Masson's trichrome (lower panel) staining was performed. Representative images are shown. Bar: 50 µm. F, Sirius Red positive area was measured. G, Hydroxyproline assay was performed. Data are shown as mean ± SD (n = 8). H, OASIS KO or WT mice were intraperitoneally treated with anti‐Bst2 antibody or control IgGκ at Day 1 after UUO. Hydroxyproline assay was performed at Day 7 after UUO. Data are shown as mean ± SD (n = 6 for WT, n = 5 for KO). * P < .05, ** P < .01 by one‐way ANOVA followed by Dunnett test
FIGURE 9
FIGURE 9
Myofibroblast‐restricted OASIS deletion resulted in decreased kidney fibrosis after UUO. A, Generation of myofibroblasts‐restricted OASIS KO (cKO) mice using Cre‐loxP system. B, cKO and control mice were subjected to UUO. At Day 7 after UUO, quantitative PCR was performed for transcript expression of OASIS/Creb3l1. The expression of the transcripts was normalized to that of Gapdh. ** P < .01 by Student t test. C, Myofibroblasts were isolated from kidney of cKO and control. The transcript expression of OASIS/Creb3l1 was examined by PCR. P: positive control, N: negative control. D, Sirius Red (upper and middle panel) or Masson's trichrome (lower panel) staining was performed. Representative images are shown. Bar: 50 µm. E, Sirius Red positive area was measured. F, Hydroxyproline assay was performed. G, Immunofluorescence analysis was performed with anti‐Ki‐67 antibody, anti‐α‐SMA antibody and DAPI. Representative images are shown. Bar: 50 µm. H and I, The number of α‐SMA+ cells (H) and the number of Ki‐67 + α‐SMA+ cells (I) was quantitatively evaluated. J‐O, Quantitative PCR was performed for transcript expression of Tgfb1, Col 1, Col 3, Mmp2, Mmp9, and Bst2. The expression of the transcripts was normalized to that of Gapdh. * P < .05, ** P < .01 by one‐way ANOVA followed by Dunnett test. Data are shown as mean ± SD (n = 9 for control, n = 11 for cKO)
FIGURE 10
FIGURE 10
The graphical abstract of this study. OASIS is induced by TGF‐β1 and promotes collagen synthesis in myofibroblasts. Furthermore, OASIS contributes to progressive kidney fibrosis by facilitating migration and proliferation of myofibroblasts, accompanied by increased Bst2 expression

Similar articles

Cited by

References

    1. Go AS, Chertow GM, Fan D, McCulloch CE, Hsu CY. Chronic kidney disease and the risks of death, cardiovascular events, and hospitalization. N Engl J Med. 2004;351(13):1296‐1305. - PubMed
    1. Keith DS, Nichols GA, Gullion CM, Brown JB, Smith DH. Longitudinal follow‐up and outcomes among a population with chronic kidney disease in a large managed care organization. Arch Intern Med. 2004;164(6):659‐663. - PubMed
    1. Moll S, Meier M, Formentini I, Pomposiello S, Prunotto M. New renal drug development to face chronic renal disease. Expert Opin Drug Discov. 2014;9(12):1471‐1485. - PubMed
    1. Farris AB, Colvin RB. Renal interstitial fibrosis: mechanisms and evaluation. Curr Opin Nephrol Hypertens. 2012;21(3):289‐300. - PMC - PubMed
    1. Strutz F, Zeisberg M. Renal fibroblasts and myofibroblasts in chronic kidney disease. J Am Soc Nephrol. 2006;17(11):2992‐2998. - PubMed

Publication types

MeSH terms