Impact of prior and projected climate change on US Lyme disease incidence
- PMID: 33150704
- PMCID: PMC7855786
- DOI: 10.1111/gcb.15435
Impact of prior and projected climate change on US Lyme disease incidence
Abstract
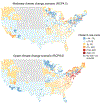
Lyme disease is the most common vector-borne disease in temperate zones and a growing public health threat in the United States (US). The life cycles of the tick vectors and spirochete pathogen are highly sensitive to climate, but determining the impact of climate change on Lyme disease burden has been challenging due to the complex ecology of the disease and the presence of multiple, interacting drivers of transmission. Here we incorporated 18 years of annual, county-level Lyme disease case data in a panel data statistical model to investigate prior effects of climate variation on disease incidence while controlling for other putative drivers. We then used these climate-disease relationships to project Lyme disease cases using CMIP5 global climate models and two potential climate scenarios (RCP4.5 and RCP8.5). We find that interannual variation in Lyme disease incidence is associated with climate variation in all US regions encompassing the range of the primary vector species. In all regions, the climate predictors explained less of the variation in Lyme disease incidence than unobserved county-level heterogeneity, but the strongest climate-disease association detected was between warming annual temperatures and increasing incidence in the Northeast. Lyme disease projections indicate that cases in the Northeast will increase significantly by 2050 (23,619 ± 21,607 additional cases), but only under RCP8.5, and with large uncertainty around this projected increase. Significant case changes are not projected for any other region under either climate scenario. The results demonstrate a regionally variable and nuanced relationship between climate change and Lyme disease, indicating possible nonlinear responses of vector ticks and transmission dynamics to projected climate change. Moreover, our results highlight the need for improved preparedness and public health interventions in endemic regions to minimize the impact of further climate change-induced increases in Lyme disease burden.
Keywords: Ixodes pacificus; Ixodes scapularis; Lyme disease; climate change; disease projections; least squares dummy variables.
© 2020 John Wiley & Sons Ltd.
Figures


Similar articles
-
Estimated effects of projected climate change on the basic reproductive number of the Lyme disease vector Ixodes scapularis.Environ Health Perspect. 2014 Jun;122(6):631-8. doi: 10.1289/ehp.1307799. Epub 2014 Mar 14. Environ Health Perspect. 2014. PMID: 24627295 Free PMC article.
-
Expansion of the Lyme Disease Vector Ixodes Scapularis in Canada Inferred from CMIP5 Climate Projections.Environ Health Perspect. 2017 May 31;125(5):057008. doi: 10.1289/EHP57. Environ Health Perspect. 2017. PMID: 28599266 Free PMC article.
-
Climate change and the potential for range expansion of the Lyme disease vector Ixodes scapularis in Canada.Int J Parasitol. 2006 Jan;36(1):63-70. doi: 10.1016/j.ijpara.2005.08.016. Epub 2005 Oct 5. Int J Parasitol. 2006. PMID: 16229849
-
Brave New Worlds: The Expanding Universe of Lyme Disease.Vector Borne Zoonotic Dis. 2017 Sep;17(9):619-629. doi: 10.1089/vbz.2017.2127. Epub 2017 Jul 20. Vector Borne Zoonotic Dis. 2017. PMID: 28727515 Free PMC article. Review.
-
The Impacts of Climate Change on Ticks and Tick-Borne Disease Risk.Annu Rev Entomol. 2021 Jan 7;66:373-388. doi: 10.1146/annurev-ento-052720-094533. Annu Rev Entomol. 2021. PMID: 33417823 Review.
Cited by
-
Infectious disease in an era of global change.Nat Rev Microbiol. 2022 Apr;20(4):193-205. doi: 10.1038/s41579-021-00639-z. Epub 2021 Oct 13. Nat Rev Microbiol. 2022. PMID: 34646006 Free PMC article. Review.
-
Current and future burden from Lyme disease in Québec as a result of climate change.Can Commun Dis Rep. 2023 Oct 1;49(10):446-456. doi: 10.14745/ccdr.v49i10a06. eCollection 2023 Oct 1. Can Commun Dis Rep. 2023. PMID: 38481649 Free PMC article.
-
Models and data used to predict the abundance and distribution of Ixodes scapularis (blacklegged tick) in North America: a scoping review.Lancet Reg Health Am. 2024 Mar 7;32:100706. doi: 10.1016/j.lana.2024.100706. eCollection 2024 Apr. Lancet Reg Health Am. 2024. PMID: 38495312 Free PMC article.
-
Opposing Patterns of Spatial Synchrony in Lyme Disease Incidence.Ecohealth. 2024 Mar;21(1):46-55. doi: 10.1007/s10393-024-01677-8. Epub 2024 May 4. Ecohealth. 2024. PMID: 38704455 Free PMC article.
-
Correlation between mean temperature and incidence of tick-borne diseases among active duty service members in the contiguous U.S., 2000-2023.MSMR. 2025 Mar 20;32(3):11-19. MSMR. 2025. PMID: 40173394 Free PMC article.
References
-
- Allen PG, and Fildes R. 2001. Econometric Forecasting Pages 303–362 in Armstrong JS, editor. Principles of Forecasting. Springer; US, Boston, MA.
-
- Bascle G 2008. Controlling for endogeneity with instrumental variables in strategic management research. Strategic Organization 6:285–327.

