. 2021 Feb;30(2):497-512.
doi: 10.1002/pro.3989. Epub 2020 Nov 16.

TSGIT: An N- and C-terminal tandem tag system for purification of native and intein-mediated ligation-ready proteins

Affiliations

TSGIT: An N- and C-terminal tandem tag system for purification of native and intein-mediated ligation-ready proteins

Vlad-Stefan Raducanu et al. Protein Sci. 2021 Feb.

Abstract

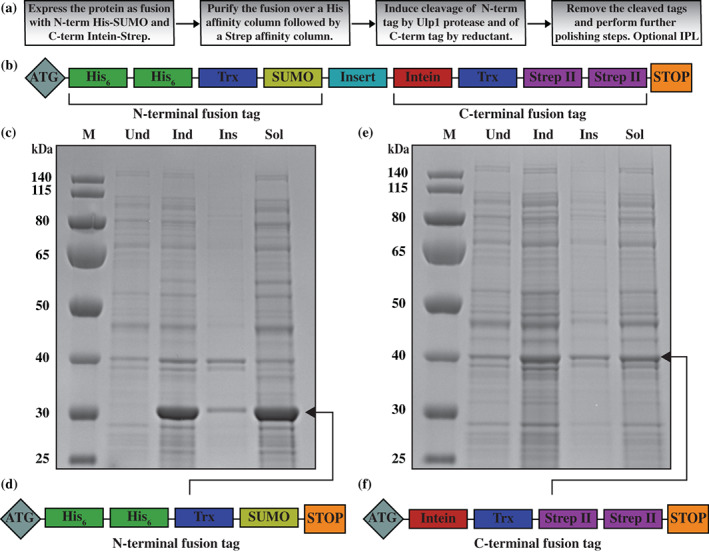
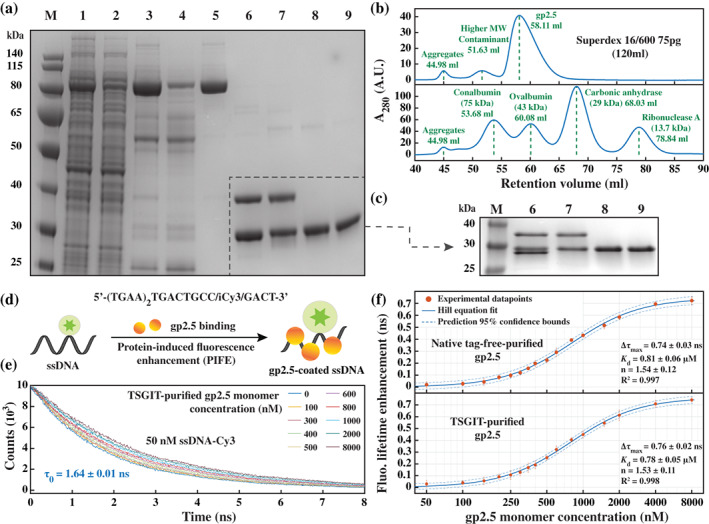
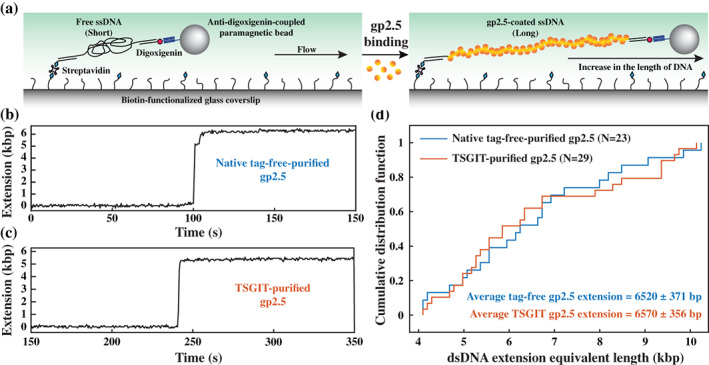
A large variety of fusion tags have been developed to improve protein expression, solubilization, and purification. Nevertheless, these tags have been combined in a rather limited number of composite tags and usually these composite tags have been dictated by traditional commercially-available expression vectors. Moreover, most commercially-available expression vectors include either N- or C-terminal fusion tags but not both. Here, we introduce TSGIT, a fusion-tag system composed of both N- and a C-terminal composite fusion tags. The system includes two affinity tags, two solubilization tags and two cleavable tags distributed at both termini of the protein of interest. Therefore, the N- and the C-terminal composite fusion tags in TSGIT are fully orthogonal in terms of both affinity selection and cleavage. For using TSGIT, we streamlined the cloning, expression, and purification procedures. Each component tag is selected to maximize its benefits toward the final construct. By expressing and partially purifying the protein of interest between the components of the TSGIT fusion, the full-length protein is selected over truncated forms, which has been a long-standing problem in protein purification. Moreover, due to the nature of the cleavable tags in TSGIT, the protein of interest is obtained in its native form without any additional undesired N- or C-terminal amino acids. Finally, the resulting purified protein is ready for efficient ligation with other proteins or peptides for downstream applications. We demonstrate the use of this system by purifying a large amount of native fluorescent mRuby3 protein and bacteriophage T7 gp2.5 ssDNA-binding protein.

Keywords: IPL; Intein; SUMO; biotin; fusion tag; protein cleavage; protein degradation; protein expression; protein ligation; purification tag; truncated protein.


Conflict of interest statement

The authors declare no conflict of interest.

Figures

FIGURE 1
FIGURE 1
Design of the TSGIT system. (a) Workflow diagram for protein expression and purification using TSGIT. (b) Schematic representation of component tags of the TSGIT fusion system. Induction and solubility controls for the (c) N‐terminal and (e) C‐terminal parts of TSGIT. 10% SDS‐PAGE gels showing the uninduced (Und), induced (Ind), insoluble (Ins), and soluble (Sol) samples for TSGIT‐N and TSGIT‐C. The marker (M) is PageRuler Prestained Protein Ladder. Schematic representation of the components of the independently tested (d) N‐terminal and (f) C‐terminal fusion tags
FIGURE 2
FIGURE 2
Amino acid sequence of empty TSGIT and cleavage mechanisms of its component cleavable tags. (a) The amino acid sequence and the corresponding nucleotide sequence are presented in FASTA format. The different tags that compose TSGIT are identified by their corresponding color code. The sequence encoding the protein of interest is inserted between the SUMO and Intein regions. (b) Schematic representation of the cascade of chemical reactions that leads to the cleavage of the C‐terminal fusion tag via traceless Intein cleavage at its N‐terminal junction; based on the reaction schemes presented in 30 , 61 . (c) Chemical structures of commonly employed thiol reagents for Intein‐tag cleavage at its N‐terminal junction. (d) Chemical structures of sulfhydryl‐free reducing agents. (e) Schematic representation of the IPL reaction between a C‐terminal 2‐MESNA‐activated protein of interest and a peptide that contains an N‐terminal cysteine residue. Additional details about thiol‐mediated Intein cleavage and IPL can be found in Supporting Information Material. (f) Schematic representation of the traceless cleavage of the SUMO‐tag and therefore of the N‐terminal fusion tag by the specific SUMO protease Ulp1 between the first amino acid of the protein of interest (X) and the second glycine residue of the C‐terminal diglycine motif of SUMO
FIGURE 3
FIGURE 3
Purification of mRuby3 by employing TSGIT. (a) A schematic of the procedure employed for purification of mRuby3 using TSGIT. (b) Image of a 10% SDS‐PAGE gel showing the different steps of purification of mRuby3 starting from E. colily sate containing the expression product of the pTSGIT‐mRuby3 expression vector: Lane 1, soluble fraction of the lysate; Lane 2, flow‐through of the first HisTrap affinity column; Lane 3, TSGIT‐mRuby3 elution from the HisTrap affinity column; Lane 4, flow‐through of the first StrepTrap affinity column; Lane 5, elution of TSGIT‐mRuby3 from StrepTrap affinity column; Lane 6, release of mRuby3 from the TSGIT‐mRuby3 fusion via SUMO protease and 2‐MESNA cleavage; Lane 7, flow‐through of cleaved mRuby3 through the second HisTrap affinity column; Lane 8, flow‐through of cleaved mRuby3 through the second StrepTrap affinity column; Lane 9, mRuby3 after Superdex 75 pg size‐exclusion elution. The marker (M) is PageRuler Prestained Protein Ladder. (c) Schematic representation of the IPL reaction of activated mRuby3 produced by TSGIT and the biotin‐containing BioP peptide. (d) Bar chart illustrating the percentage of flow‐through, wash and bound fractions of unlabeled and IPL biotin‐labeled mRuby3 from NeutrAvidin resin. The inset schematic shows the three coexisting populations: unlabeled mRuby3, free and NeutrAvidin‐bound biotin‐labeled mRuby3. (e) Image of an SDS‐PAGE gel showing the sample (S), flow‐through (F), wash (W), and bound (B) fractions of unlabeled and IPL biotin‐labeled mRuby3 from NeutrAvidin resin. The marker (M) is the 30 kDa band of PageRuler Prestained Protein Ladder
FIGURE 4
FIGURE 4
Fluorescence functionality of the TSGIT‐purified mRuby3. (a) Emission spectra of various concentrations of NeutrAvidinDyLight650. Corrected and normalized emission spectra of various concentrations of NeutrAvidinDyLight650 in the presence of (b) 50 nM unlabeled mRuby3 or (c) 50 nM IPL biotin‐labeled mRuby3. All data points represent the average of three independent acquisitions. All spectra were collected between 530 and 750 nm upon excitation at 520 nm. All spectra follow the color codes presented in the inset tables. Correction and normalization of the emission spectra were performed as described inSupporting Information Materials and Methods section. (d) Plot of the enhancement in corrected and normalized emission intensity at 673 nm upon addition of various concentrations of NeutrAvidinDyLight650 to 50 nM unlabeled mRuby3 (blue crosses) or to 50 nM IPL biotin‐labeled mRuby3 (red circles). All error bars represent the standard deviation of three independent acquisitions. For IPL biotin‐labeled mRuby3, the experimental datapoints were fit to a Hill equation, as described inSupporting Information Materials and Methods section. The parameters of the fit are described in the inset table together with their standard deviations. The 95% confidence bounds of the fitted model are depicted by the dashed lines. In all panels, the concentration of NeutrAvidinDyLight650 is indicated as the concentration of NeutrAvidin monomers, that is, biotin binding sites
FIGURE 5
FIGURE 5
Purification of gp2.5 by employing TSGIT and its microscopic characterization. (a) Image of a 10% SDS‐PAGE gel showing the different steps of purification of gp2.5 starting from E. colily sate containing the expression product of the pTSGIT‐gp2.5 expression vector: Lane 1, soluble fraction of the lysate; Lane 2, flow‐through of the first HisTrap affinity column; Lane 3, TSGIT‐gp2.5 elution from the HisTrap affinity column; Lane 4, flow‐through of the first StrepTrap affinity column; Lane 5, elution of TSGIT‐gp2.5 from StrepTrap affinity column; Lane 6, release of gp2.5 from the TSGIT‐gp2.5 fusion via SUMO protease and DTT cleavage; Lane 7, flow‐through of cleaved gp2.5 through the second HisTrap affinity column; Lane 8, flow‐through of cleaved gp2.5 through the second StrepTrap affinity column; Lane 9, gp2.5 after Superdex 75 pg size‐exclusion elution. The marker (M) is PageRuler Prestained Protein Ladder. (b) Chromatograms showing the elution of TSGIT‐purified gp2.5 (top) and four different molecular weight markers (bottom) from the Superdex 75 pg size‐exclusion column. (c) Image of a 12% SDS‐PAGE gel showing a better separation of the proteins in the gray dashed area from the 10% SDS‐PAGE shown in panel (a) with the same numbering of the lanes. (d) Schematic representation of the PIFE assay used to monitor the binding affinity of gp2.5 to short ssDNA. (e) Examples of time‐resolved fluorescence decays of the Cy3‐labelled ssDNA obtained in the presence of various concentrations of TSGIT‐purified gp2.5. (f) Binding isotherms (log‐linear) of native tag‐free‐purified gp2.5 (top) and TSGIT‐purified gp2.5 (bottom) to the Cy3‐labelled ssDNA as determined from time‐resolved fluorescence measurements. The y‐axis represents the increase in Cy3 lifetime upon gp2.5 binding as compared to the lifetime of the oligo alone. All the elements of the plots have the same meaning as in Figure 4d
FIGURE 6
FIGURE 6
ssDNA stretching power of TSGIT‐purified gp2.5. (a) Schematic representation of the single‐molecule flow‐stretching bead assay used to monitor the elongation of collapsed long ssDNA upon binding of gp2.5. The position of the DNA‐attached bead is monitored over time and converted to dsDNA extension equivalent length as described in Supporting Information Materials and Methods section. (b) Example of a single‐molecule time‐trace showing the stretching of the ssDNA‐containing substrate upon injection of native tag‐free‐purified gp2.5. (c) Example of a single‐molecule time‐trace showing the stretching of the ssDNA‐containing substrate upon injection of TSGIT‐purified gp2.5. For both panels, the maximum extension was calculated between the initial and final basslines along the y‐axis. (d) A plot of the empirical cumulative distribution function, obtained from the indicated number (N) of individual time‐traces, of the maximum dsDNA equivalent stretching length by native tag‐free‐purified gp2.5 (blue) and TSGIT‐purified gp2.5 (red). The average stretching length together with its standard deviation is indicated for both proteins

Similar articles

Cited by

References

    1. Kimple ME, Brill AL, Pasker RL. Overview of affinity tags for protein purification. Curr Protoc Protein Sci. 2013;73:9.9.1–9.9.23. - PMC - PubMed
    1. Terpe K. Overview of tag protein fusions: From molecular and biochemical fundamentals to commercial systems. Appl Microbiol Biotechnol. 2003;60:523–533. - PubMed
    1. Costa S, Almeida A, Castro A, Domingues L. Fusion tags for protein solubility, purification and immunogenicity in Escherichia coli: The novel Fh8 system. Front Microbiol. 2014;5:63. - PMC - PubMed
    1. Young CL, Britton ZT, Robinson AS. Recombinant protein expression and purification: A comprehensive review of affinity tags and microbial applications. Biotechnol J. 2012;7:620–634. - PubMed
    1. Waugh DS. An overview of enzymatic reagents for the removal of affinity tags. Protein Expr Purif. 2011;80:283–293. - PMC - PubMed

Publication types

MeSH terms

Substances