

Association of Serum Neurofilament Light Levels With Long-term Brain Atrophy in Patients With a First Multiple Sclerosis Episode
- PMID: 33151313
- PMCID: PMC7645699
- DOI: 10.1001/jamanetworkopen.2020.16278
Association of Serum Neurofilament Light Levels With Long-term Brain Atrophy in Patients With a First Multiple Sclerosis Episode
Abstract
Importance: Data are needed on the potential long-term prognostic association of serum neurofilament light in multiple sclerosis (MS).
Objective: To evaluate serum neurofilament light as a biomarker associated with long-term disease outcomes in clinically isolated syndrome.
Design, setting, and participants: This post hoc cohort study used data from the Controlled High-Risk Avonex Multiple Sclerosis Prevention Study, a 36-month, multicenter, placebo-controlled interferon β-1a randomized clinical trial conducted from April 1996 to March 2000, and its long-term (5- and 10-year) extension study from February 2001 to March 2009. Participants included individuals with a symptomatic initial demyelinating event and brain magnetic resonance imaging (MRI) lesions suggestive of MS. Data were analyzed from April 2017 through 2019.
Exposure: The variable of interest was naturally occurring serum neurofilament light concentration.
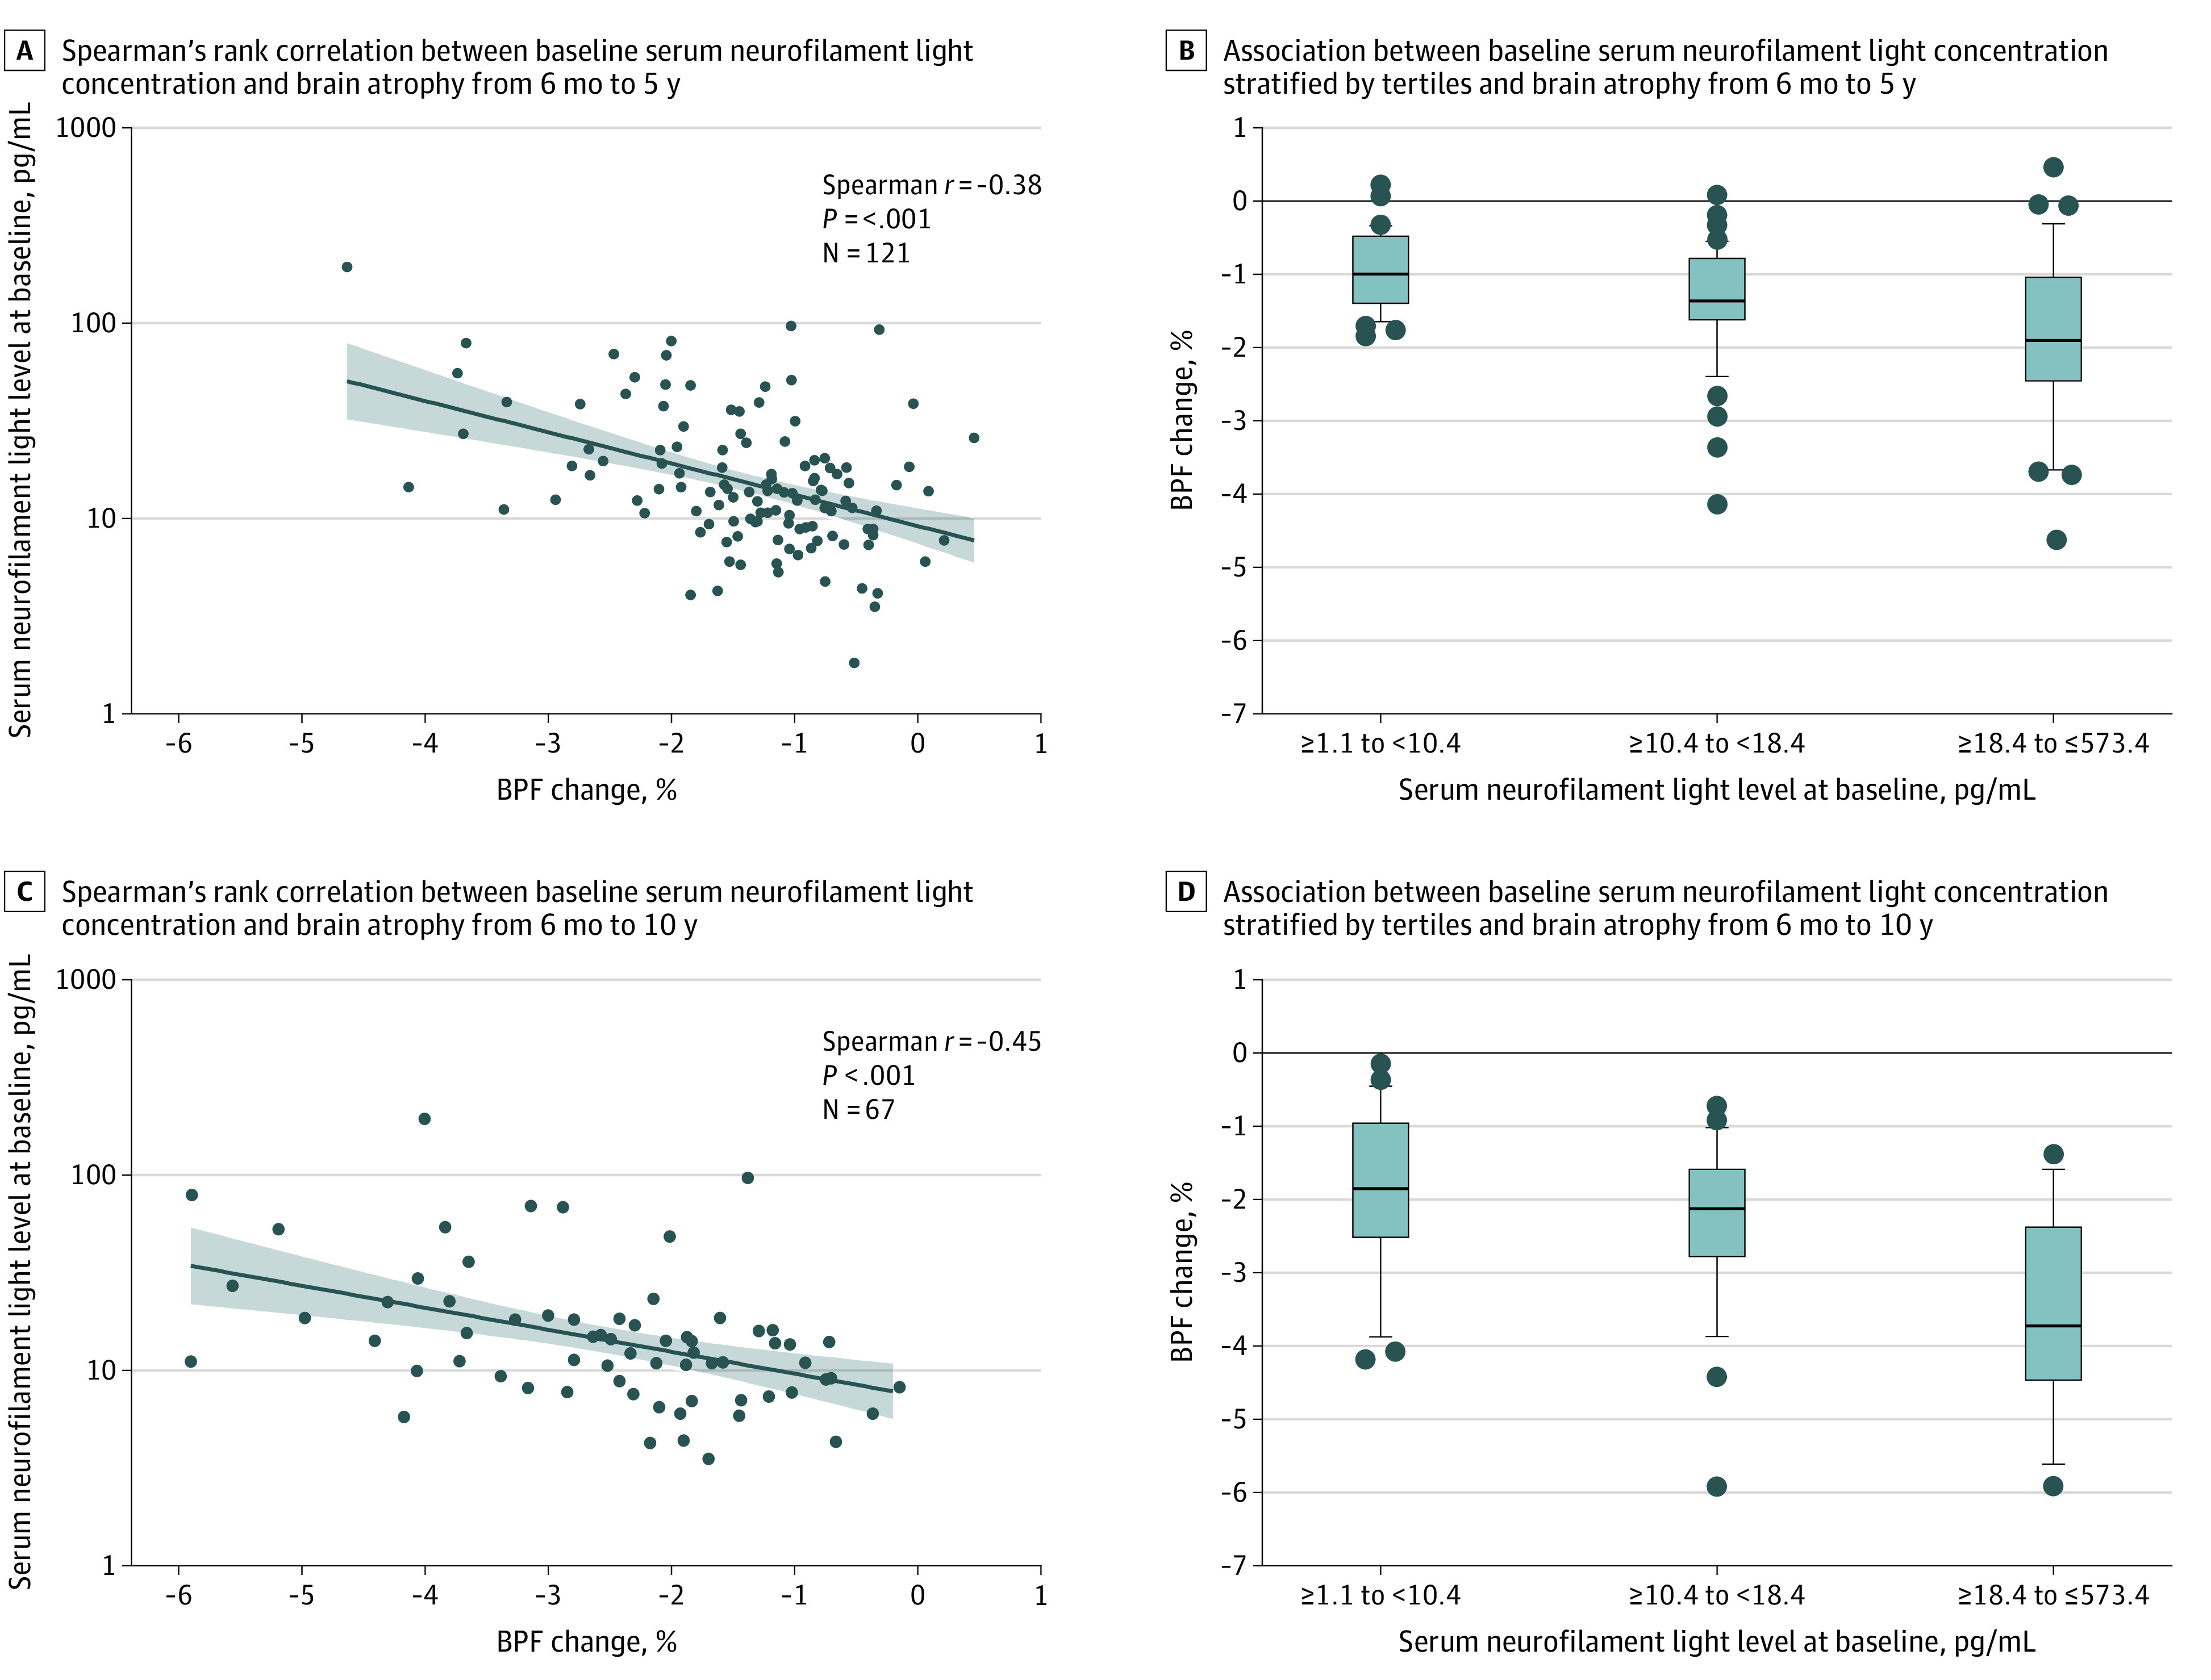
Main outcomes and measures: Gadolinium-enhancing (Gd+) lesion number, T2 lesion volume, and brain parenchymal fraction, a measure of brain atrophy were measured at baseline and 5 and 10 years. Multivariate regression models evaluated whether age, sex, and baseline covariates, including serum neurofilament light, brain parenchymal fraction, Expanded Disability Status Scale, Gd+ lesion count, and T2 lesion volume, were associated with brain parenchymal fraction changes over 5 and 10 years.
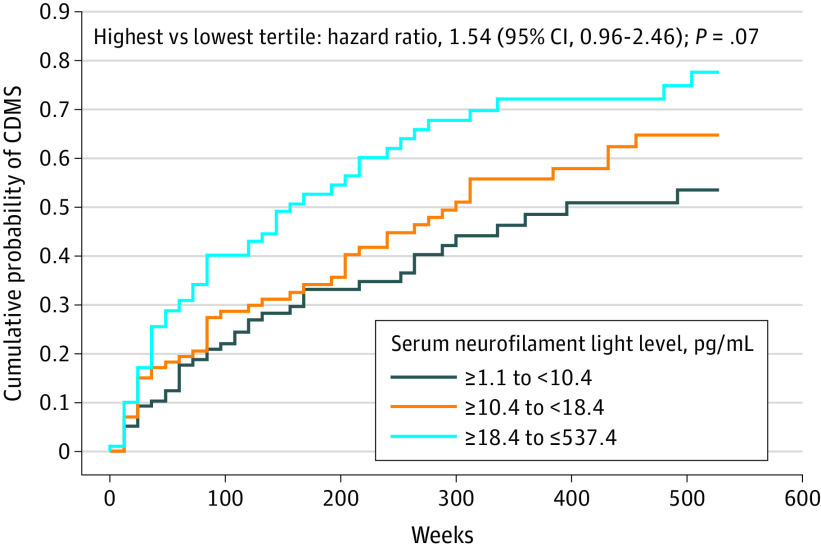
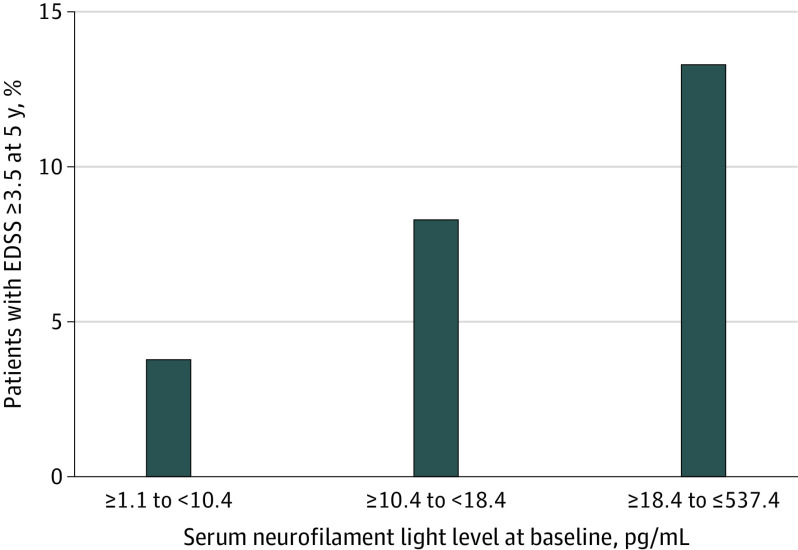
Results: Among 308 included participants (mean [SD] age, 33.2 [7.6] years; 234 [76.0%] women), baseline serum neurofilament light concentrations were associated with Gd+ lesions (Spearman r = 0.41; P < .001) and T2 lesion volume (Spearman r = 0.42; P < .001). Among covariates for brain parenchymal fraction change, serum neurofilament light concentration had the greatest correlation with change in brain parenchymal fraction at 5 years (Spearman r = -0.38; P < .001) and was the only variable associated with brain parenchymal fraction at 10 years (Spearman r = -0.45; P < .001). Participants in the highest vs lowest baseline serum neurofilament light tertiles showed brain parenchymal fraction reduction at 5 years (-1.83% [95% CI, -1.49% to -2.18%] vs -0.95% [95% CI, -0.78% to -1.12%]; P < .001) and 10 years (-3.54% [95% CI, -2.90% to -4.17%] vs -1.90% [95% CI, -1.43% to -2.37%]; P < .001). At 5 years, 6 of 45 participants (13.3%) in the highest neurofilament tertile and 2 of 52 participants (3.8%) in the lowest neurofilament tertile achieved an Expanded Disability Status Scale score of 3.5 or greater.
Conclusions and relevance: This cohort study found that higher baseline serum neurofilament light levels were associated with increased brain atrophy over 5 and 10 years. These findings suggest that serum neurofilament light could be a biomarker associated with disease severity stratification in early MS and may help to guide intervention.
Conflict of interest statement
Figures
References
Publication types
MeSH terms
Substances
LinkOut - more resources
Full Text Sources
Medical
Miscellaneous
