. 2021 Mar;78(6):2949-2962.
doi: 10.1007/s00018-020-03686-6. Epub 2020 Nov 5.

Gefitinib induces EGFR and α5β1 integrin co-endocytosis in glioblastoma cells

Affiliations

Gefitinib induces EGFR and α5β1 integrin co-endocytosis in glioblastoma cells

Anne-Florence Blandin et al. Cell Mol Life Sci. 2021 Mar.

Abstract

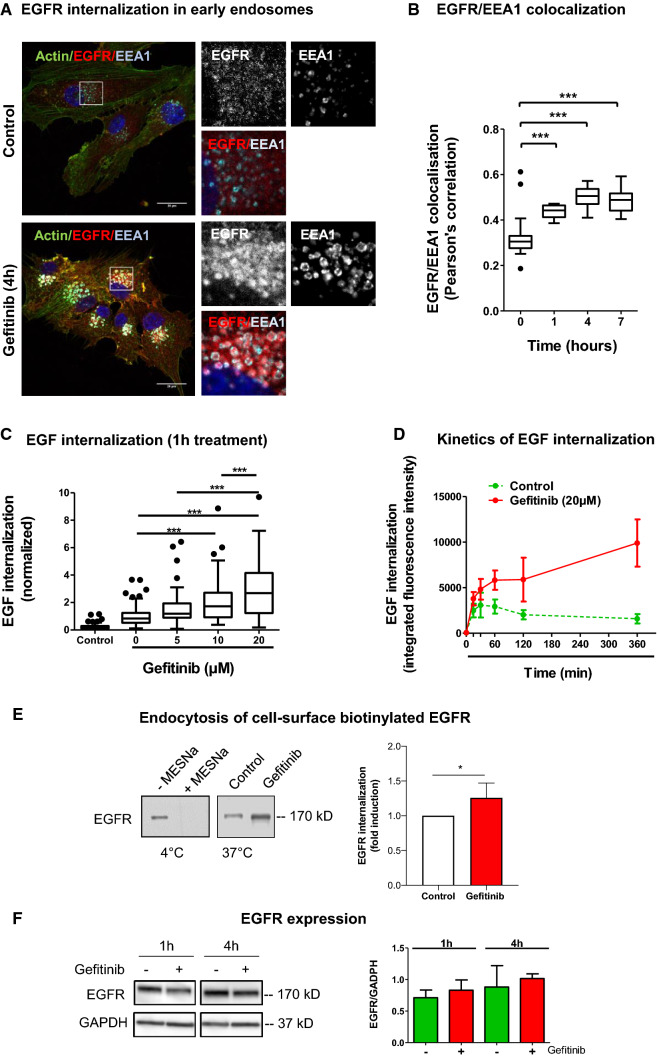
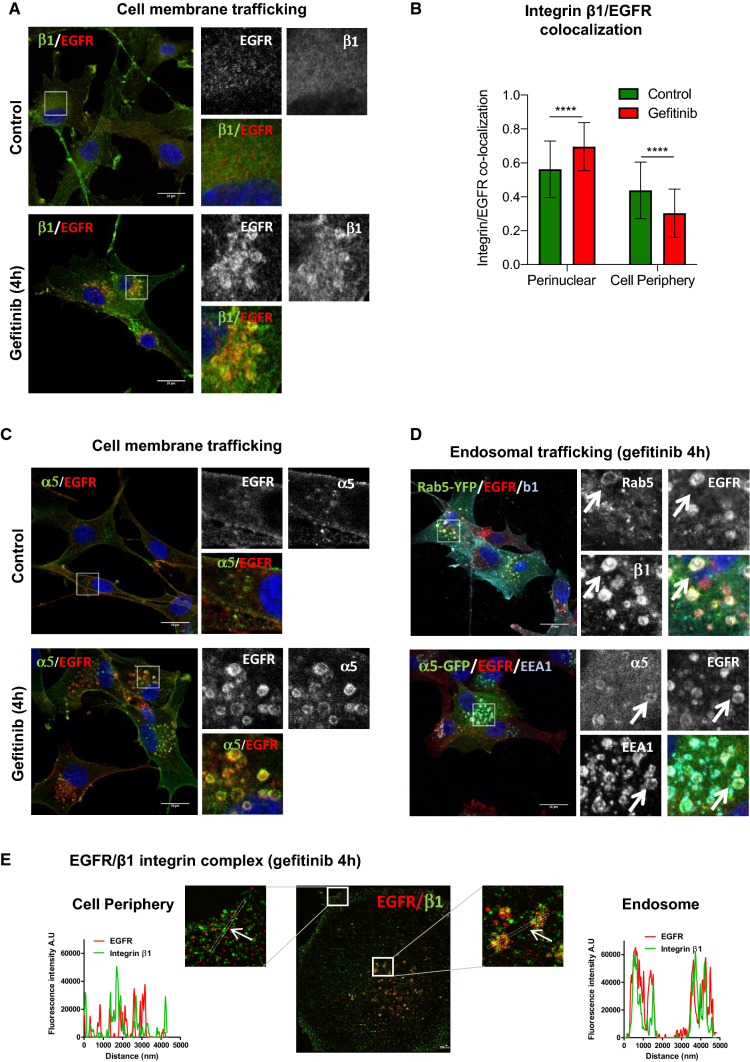
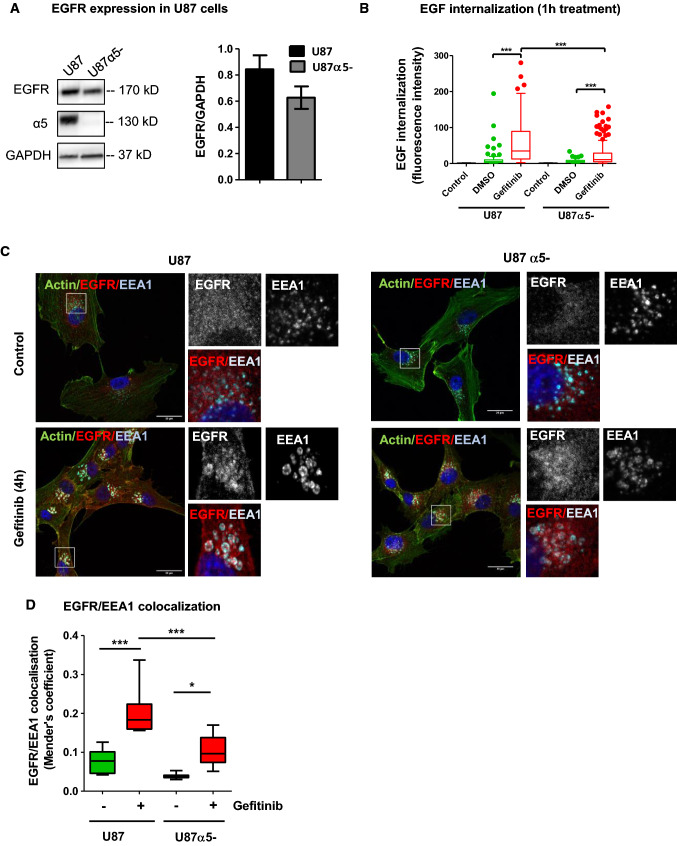
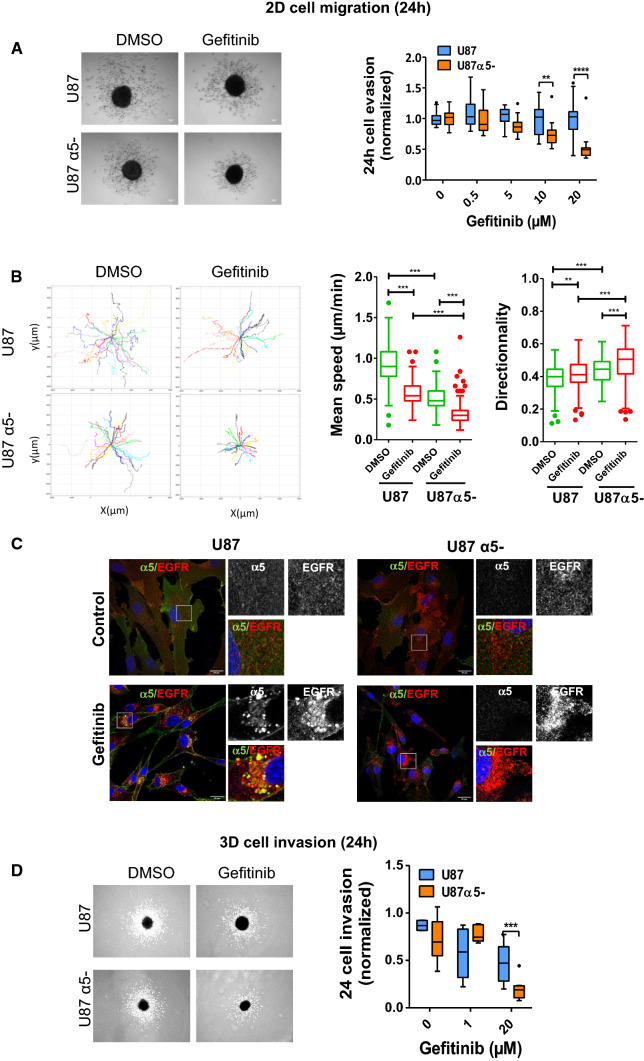
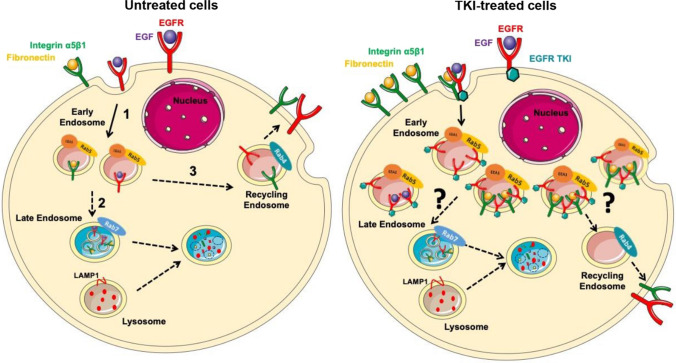
Overexpression of EGFR drives glioblastomas (GBM) cell invasion but these tumours remain resistant to EGFR-targeted therapies such as tyrosine kinase inhibitors (TKIs). Endocytosis, an important modulator of EGFR function, is often dysregulated in glioma cells and is associated with therapy resistance. However, the impact of TKIs on EGFR endocytosis has never been examined in GBM cells. In the present study, we showed that gefitinib and other tyrosine kinase inhibitors induced EGFR accumulation in early-endosomes as a result of an increased endocytosis. Moreover, TKIs trigger early-endosome re-localization of another membrane receptor, the fibronectin receptor alpha5beta1 integrin, a promising therapeutic target in GBM that regulates physiological EGFR endocytosis and recycling in cancer cells. Super-resolution dSTORM imaging showed a close-proximity between beta1 integrin and EGFR in intracellular membrane compartments of gefitinib-treated cells, suggesting their potential interaction. Interestingly, integrin depletion delayed gefitinib-mediated EGFR endocytosis. Co-endocytosis of EGFR and alpha5beta1 integrin may alter glioma cell response to gefitinib. Using an in vitro model of glioma cell dissemination from spheroid, we showed that alpha5 integrin-depleted cells were more sensitive to TKIs than alpha5-expressing cells. This work provides evidence for the first time that EGFR TKIs can trigger massive EGFR and alpha5beta1 integrin co-endocytosis, which may modulate glioma cell invasiveness under therapeutic treatment.

Keywords: Adhesion receptors; Brain cancer; Cell migration; Growth factors receptors; Membrane trafficking.


Conflict of interest statement

The authors disclose no conflicts.

Figures

Fig. 1
Fig. 1
Gefitinib provokes EGFR endocytosis in U87 cells. a Immunodetection of actin (green), EGFR (red) and the endosomal marker EEA1 (cyan) after 4 h treatment with DMSO (control cells) or gefitinib (20 µM). Magnified images are from the inserts to the peri-nuclear area. Scale bar = 20 μm. b EGFR/EEA1 colocalization following gefitinib treatment. We collected 10–12 images from 3 independent experiments. ***p < 0.001. cd EGF-Alexa488 internalization in U87 cells. Following serum-starvation and EGF-Alexa488 binding to the cell surface, cells were replaced in complete medium at 37 °C to allow internalization of the ligand, in presence of the indicated concentration of gefitinib. The internalization was measured by integrated fluorescence density of 20–30 cells from 3 independent experiments. c Cells were treated with different concentrations of gefitinib (5-20 µM) for 1 h at 37 °C incubation. ***p < 0.001. d Cells were treated with 20 µM of gefitinib for 15 min to 6 h. Data are represented as mean ± s.d. e Left panel: Immunoblot showing the endocytosis of biotinylated EGFR. Following cell-surface biotinylation, cells were incubated in complete media (with or without 15 µM gefitinib) for 3 h. Cells were treated with MESNa agent to remove biotin present on cell-surface proteins. After purification, biotinylated proteins were then subjected EGFR immunoblot. Right panel: Quantification of EGFR protein bands (mean of 4 independent experiment). *p < 0.05. f Left panel: Immunoblot showing similar EGFR protein expression in gefitinib-treated and untreated cells. Right panel: Quantification of EGFR/GAPDH protein ratio (mean of 3 independent experiments)
Fig. 2
Fig. 2
Gefitinib provokes the co-endocytosis of EGFR and α5β1 integrin. ac Confocal images of U87 cells treated with vehicle (control) or gefitinib. Immunodetection of EGFR and β1 (a) or α5 (c) integrin subunits by confocal microscopy. Scale bar = 20 μm. b Quantification of the ratio β1 integrin/EGFR colocalized pixels in the perinuclear compartments compared to the cell periphery. The degree of colocalization between the β1 integrin and EGFR was quantified using a home-made plugin with the ImageJ software. d Confocal images of U87 cells expressing Rab5-YFP or α5-eGFP and treated with 20 µM of gefitinib. High magnification images of the inserts at the peri-nuclear area. Arrows highlight vesicles that are labelled with both EGFR, integrin and early-endosome marker. Scale bar = 20 μm. e Two-color dSTORM images of gefitinib-treated cells showing EGFR/β1 integrin complex at the cell periphery and endosomes. High magnification images of the inserts at the cell periphery and endosomes are shown. Plot profiles of pixel intensity of EGFR (red) and β1 integrin (green) corresponding to the region marked with white arrows. Scale bar = 200 nm
Fig. 3
Fig. 3
Silencing of α5β1 integrin delayed gefitinib-mediated EGFR endocytosis. a Left panel: U87 and U7α5- cell lysates were immunoblotted to detect EGFR, α5 integrin and GAPDH. Right panel: densitometric analysis. b EGF-Alexa488 internalization assays in U87 cells and U87α5-. Following serum-starvation and EGF-Alexa488 binding to the cell surface, cells were replaced in complete medium at 37 °C to allow internalization of the ligand in presence of gefitinib (20 µM) or DMSO. The internalization was measured by integrated fluorescence density on 20–30 cells/experiment of 3 independent experiments and reported in the histogram by arbitrary units of fluorescence (AUF). ***p < 0.001. c Confocal microscopy detection of actin filaments (green), EGFR (red) and EEA1 (cyan) in U87 and U87α5- cells treated with vehicle (control) or gefitinib (20 µM, 4 hours). High-magnification images are from the inserts into the peri-nuclear area. Scale bar = 20 μm. d EGFR/EEA1 colocalization using Mender’s coefficient. Confocal images from 3 independents experiments were analyzed with JACOPs plugin of ImageJ software
Fig. 4
Fig. 4
Silencing of α5β1 integrin sensitizes GBM cells to gefitinib treatment during GBM cell evasion in 2D and 3D environment. a Phase-contrast image of representative spheroids after 24 h of migration in the presence of DMSO or gefitinib (20 µM). Scale bar = 100 µm. After DAPI staining, the number of evading cells were quantified by automated counting of nuclei using an ImageJ homemade plugin. **p < 0.01, ***p < 0.001. b Left panels show the migratory tracks of individual cells. Right panels: Mean speed and directionality of DMSO or gefitinib-treated escaping cells (30 cells/spheroids, 5 spheroids/experiment, 3 independent experiments).**p < 0.05, ***p < 0.001. c EGFR and α5 integrin are co-distributed in intracellular compartment of cells migrating at long distance during 24 h of gefitinib treatment. Confocal microscopy detection of EGFR and α5 integrin in cells treated with DMSO (control) or gefitinib. High magnification images are from the inserts into the peri-nuclear area. Scale bar = 20 μm. d Left panel: Phase-contrast image of representative spheroids embedded in collagen/fibronectin 3D matrix after 24 h of invasion in the presence of DMSO or gefitinib (20 µM). Scale bar = 100 µm. Right panel: Curve-dose effect of gefitinib on cell invasion was quantified using ImageJ. Quantification of 15 spheroids from 3 independent experiments, normalized to the control cells. ***p < 0.001
Fig. 5
Fig. 5
Proposed mechanism of gefitinib-mediated endocytosis of EGFR and α5β1 integrin in glioma cells. In untreated cells, upon ligand-binding, EGFR is internalized into early endosomes (1). EGF receptors are sorted to different fates, either degradation (2) or recycling (3), accordingto receptor-ligand dissociation. Ligand-bound receptors are led to degradation by the maturation of early-to-late endosomes and further fusion with lysosomes (2). Otherwise, EGFR can be recycled back to the plasma membrane (3). Upon treatment with an EGFR-tyrosine kinase inhibitor (TKI), EGFR is massively internalized into enlarged and abundant early endosomes (4). This massive internalization seems to happen to both bound and unbound EGFR. Moreover, TKI treatment also caused internalization of other membrane receptor such as the α5β1 integrin. EGFR and integrin were found together in early endosomes (5). After endocytosis, the journey of integrin and EGFR remains to be clarified and might modulate invasive behaviour of glioma cells under treatment

Similar articles

Cited by

References

    1. Louis DN, Perry A, Reifenberger G, et al. The 2016 World Health Organization classification of tumors of the central nervous system: a summary. Acta Neuropathol. 2016;131:803–820. doi: 10.1007/s00401-016-1545-1. - DOI - PubMed
    1. Brennan CW, Verhaak RGW, McKenna A, et al. The somatic genomic landscape of glioblastoma. Cell. 2013;155:462–477. doi: 10.1016/j.cell.2013.09.034. - DOI - PMC - PubMed
    1. An Z, Aksoy O, Zheng T, et al. Epidermal growth factor receptor (EGFR) and EGFRvIII in glioblastoma (GBM): signaling pathways and targeted therapies. Oncogene. 2018;37:1561–1575. doi: 10.1038/s41388-017-0045-7. - DOI - PMC - PubMed
    1. Taylor TE, Furnari FB, Cavenee WK. Targeting EGFR for treatment of glioblastoma: molecular basis to overcome resistance. Curr Cancer Drug Targets. 2012;12:197–209. doi: 10.2174/156800912799277557. - DOI - PMC - PubMed
    1. Mellinghoff IK, Cloughesy TF, Mischel PS. PTEN-mediated resistance to epidermal growth factor receptor kinase inhibitors. Clin Cancer Res. 2007;13:378–381. doi: 10.1158/1078-0432.CCR-06-1992. - DOI - PubMed

MeSH terms