. 2021 Feb;599(4):1173-1198.
doi: 10.1113/JP280670. Epub 2020 Nov 26.

Loss of Baiap2l2 destabilizes the transducing stereocilia of cochlear hair cells and leads to deafness

Affiliations

Loss of Baiap2l2 destabilizes the transducing stereocilia of cochlear hair cells and leads to deafness

Adam J Carlton et al. J Physiol. 2021 Feb.

Abstract

Key points: Mechanoelectrical transduction at auditory hair cells requires highly specialized stereociliary bundles that project from their apical surface, forming a characteristic graded 'staircase' structure. The morphogenesis and maintenance of these stereociliary bundles is a tightly regulated process requiring the involvement of several actin-binding proteins, many of which are still unidentified. We identify a new stereociliary protein, the I-BAR protein BAIAP2L2, which localizes to the tips of the shorter transducing stereocilia in both inner and outer hair cells (IHCs and OHCs). We find that Baiap2l2 deficient mice lose their second and third rows of stereocilia, their mechanoelectrical transducer current, and develop progressive hearing loss, becoming deaf by 8 months of age. We demonstrate that BAIAP2L2 localization to stereocilia tips is dependent on the motor protein MYO15A and its cargo EPS8. We propose that BAIAP2L2 is a new key protein required for the maintenance of the transducing stereocilia in mature cochlear hair cells.

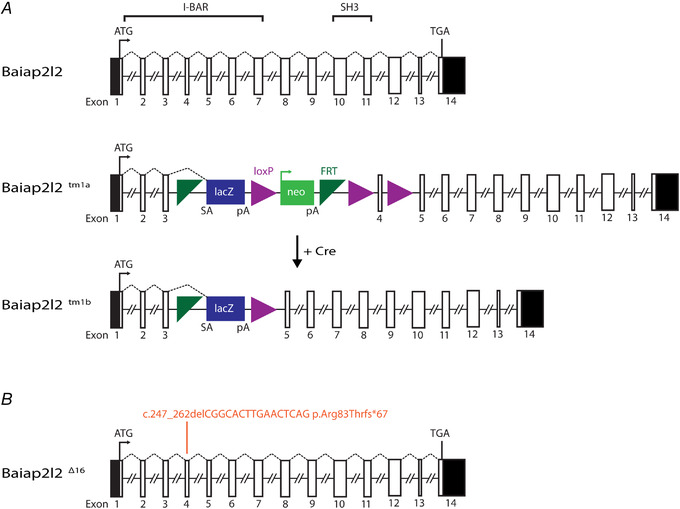
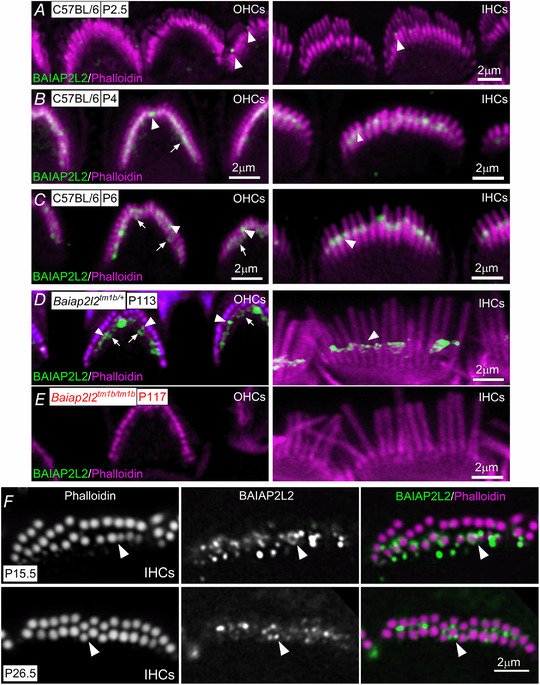
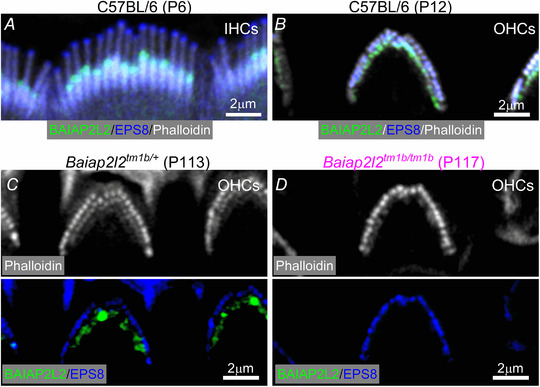
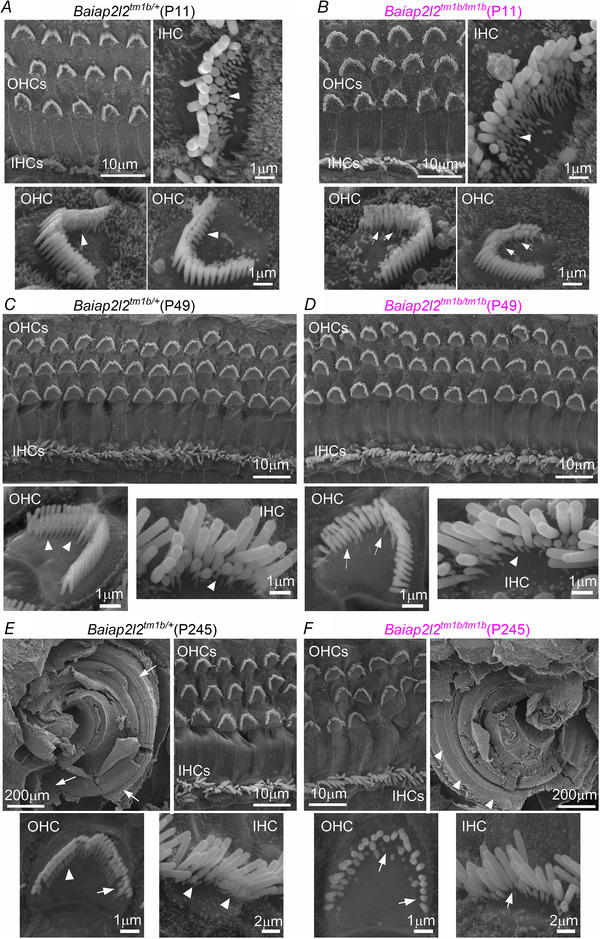
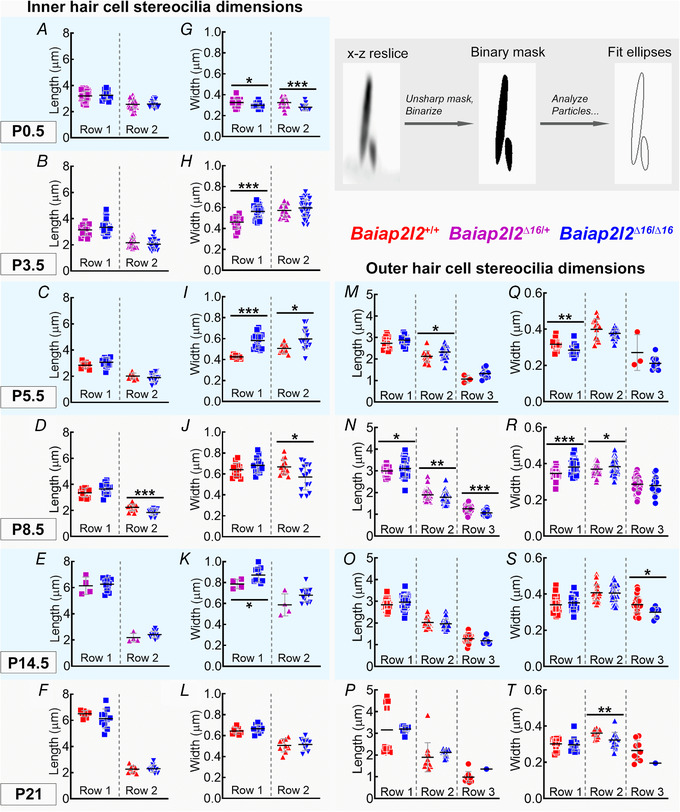
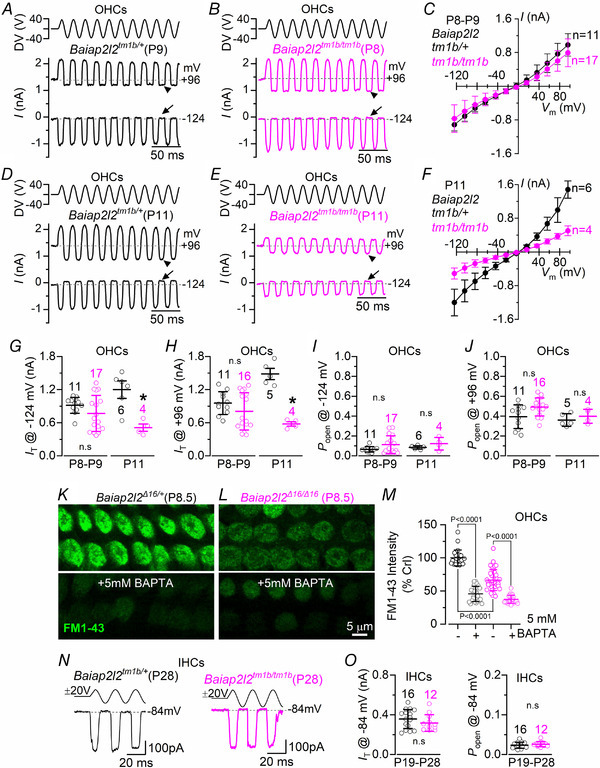
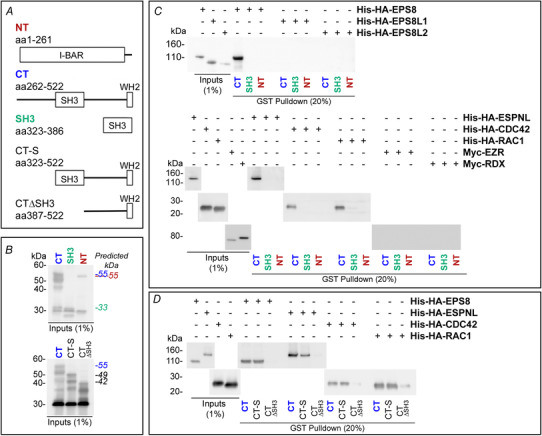
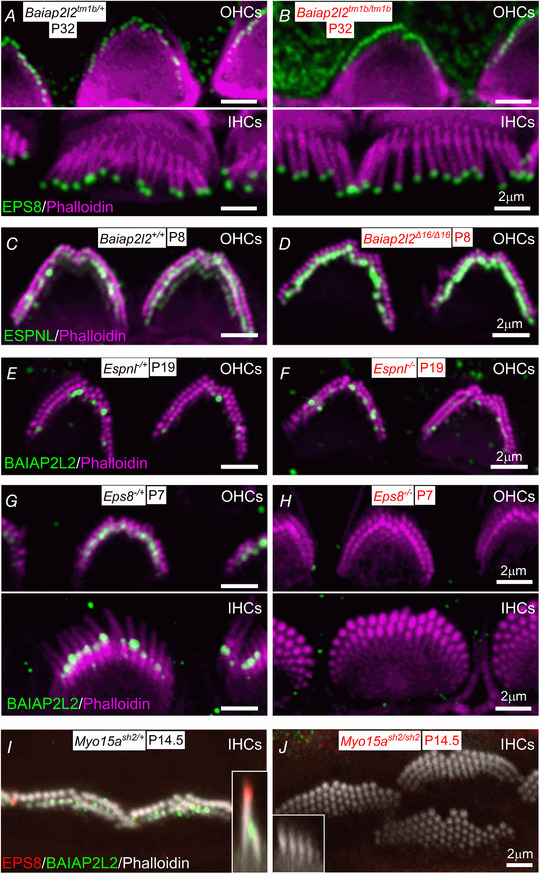
Abstract: The transduction of sound waves into electrical signals depends upon mechanosensitive stereociliary bundles that project from the apical surface of hair cells within the cochlea. The height and width of these actin-based stereocilia is tightly regulated throughout life to establish and maintain their characteristic staircase-like structure, which is essential for normal mechanoelectrical transduction. Here, we show that BAIAP2L2, a member of the I-BAR protein family, is a newly identified hair bundle protein that is localized to the tips of the shorter rows of transducing stereocilia in mouse cochlear hair cells. BAIAP2L2 was detected by immunohistochemistry from postnatal day 2.5 (P2.5) throughout adulthood. In Baiap2l2 deficient mice, outer hair cells (OHCs), but not inner hair cells (IHCs), began to lose their third row of stereocilia and showed a reduction in the size of the mechanoelectrical transducer current from just after P9. Over the following post-hearing weeks, the ordered staircase structure of the bundle progressively deteriorates, such that, by 8 months of age, both OHCs and IHCs of Baiap2l2 deficient mice have lost most of the second and third rows of stereocilia and become deaf. We also found that BAIAP2L2 interacts with other key stereociliary proteins involved in normal hair bundle morphogenesis, such as CDC42, RAC1, EPS8 and ESPNL. Furthermore, we show that BAIAP2L2 localization to the stereocilia tips depends on the motor protein MYO15A and its cargo EPS8. We propose that BAIAP2L2 is key to maintenance of the normal actin structure of the transducing stereocilia in mature mouse cochlear hair cells.

Keywords: actin; cochlear; development; hearing loss; mechanoelectrical transduction; mouse; stereocilia.


Figures

Figure 1
Figure 1. Schematic representation of the genomic structure of the mouse Baiap2l2
A, BAI1‐associated protein 2‐like 2 (Baiap2l2) gene (ENSMUSG00000018126; MGI:2 652 819) comprises 14 exons, spanning ∼30 kb of genomic DNA on chromosome 15. BAIAP2L2 is a 522 amino acid phosphoinositide‐binding protein that contains an I‐BAR domain (encoded by exons 1 to 7) and an SH3 domain (encoded by exons 10 and 11). The ATG (translation start) and the TGA (Stop) sites are in exons 1 and 14, respectively, and the untranslated regions are shown in black. The IMPC uses different targeting strategies to produce knockout alleles, which rely on the identification of a critical exon common to all transcript variants that when deleted disrupts gene function (Skarnes PMID: 21 677 750). For the Baiap2l2 gene, a promoter‐driven targeting cassette was used to generate a ‘knockout‐first’ allele (tm1a) in C57BL/6N embryonic stem cells. Insertion of the lacZ trapping cassette and a floxed promoter‐driven neo cassette inserted into intron 3 of the gene is expected to disrupt gene function. Cre‐mediated deletion of the selection cassette and floxed exon 4 of the tm1a allele generates a lacZ‐tagged allele (tm1b), which was used for the present study. Abbreviations: FRT, flippase recognition target; neo, neomycin resistance gene; pA, polyadenylation site; SA, splice acceptor. B, generation of the null allele of Baiap2l2 using CRISPR/Cas9. gRNA was targeted to exon 4, and several mouse lines containing indels were obtained. We chose a line that had a 16 bp deletion (coding sequence deletion: c.247_262delCGGCACTTGAACTCAG; protein truncation: p.Arg83Thrfs*67). The protein product is predicted to be truncated in the I‐BAR domain. We referred to the allele we used here as Baiap2l2Δ16. Mice were backcrossed to C57BL/6 for more than six generations to minimize any off‐target modifications.
Figure 2
Figure 2. ABR thresholds evoked in Baiap2l2 mice
A, average ABR thresholds for click stimuli recorded from Baiap2l2 control (Baiap2l2tm1b/+) and knockout littermate mice (Baiap2l2tm1b/tm1b) of increasing ages. The dashed line represents the upper threshold limit of our system, 95dB. The number of mice tested is shown above or below the average data points (closed symbols) and single data points are plotted as small open symbols. B and C, ABR thresholds for frequency‐specific pure tone stimulation from 3 kHz to 36 kHz recorded from Baiap2l2tm1b/+and Baiap2l2tm1b/tm1b littermate mice at 14 days (B) and 19–22 days, 48–53 days, 104–116 days and 166–245 days (C) after birth. The number of mice tested for each age/strain is shown. D and E, average ABR waveform responses at 12 kHz at increasing stimulus intensity (dB SPL) relative to threshold at postnatal day 19–22 (Baiap2l2tm1b/+: n = 14; Baiap2l2tm1b/tm1b: n = 14) and 48–53 (Baiap2l2tm1b/+: n = 8; Baiap2l2tm1b/tm1b: n = 7). Continuous lines represent the average values and the shaded areas the SD. P1 and N1 indicate the positive and negative peaks of wave 1, respectively. F and G, average amplitude (from P1 to N1: top) and latency of wave 1 (time between the onset of the stimulus and P1: bottom) as a function of dB SPL (F) and relative to threshold (G) in both strains at 19–22 days and 48–53 days. In (F), the wave 1 amplitude of ABR signals below thresholds were set to zero, and were not used to measure the latency. For the individual recordings used to calculate the averages shown in (B), (C), (F) and (G), see Supporting information, Data S1.
Figure 3
Figure 3. DPOAE thresholds are elevated in Baiap2l2 knockout mice
AF, DPOAE thresholds measured from Baiap2l2tm1b/+ (A–C) and Baiap2l2tm1b/tm1b mice (D–F) at 19–61 days (A and D), 104–116 days (B and E) and 166–145 days (C and F) after birth. The frequency range tested: 6 kHz, 12 kHz, 18 kHz and 24 kHz. Due to the presence of ‘not‐found’ values (i.e. above the upper threshold limit of our system, 80 dB: dashed lines), values are plotted as the median (line and circles) together with the first (grey short lines) and third (blue short lines) quartiles. Single values are reported as open circles. For each animal, the number of ‘found’ and ‘not‐found’ values at each frequency is shown below and above the median, respectively. G, comparison of the median DPOAE thresholds from (A) to (F).
Figure 4
Figure 4. BAIAP2L2 localizes to stereocilia tips
A–D, antibody against BAIAP2L2 (green) labels its localization at stereocilia tips in apical‐coil OHCs (AD, left) and IHCs (AD, right) from P2.5 (A), P4 (B), P6 (C) and P113 (D) mice. Anti‐BAIAP2L2 was: Atlas Antibodies (HPA003043). Phalloidin (red) labels actin, marking the stereocilia. Note that BAIAP2L2 is localized at the tips of the second (arrowheads) and third (arrows) rows of stereocilia in OHCs, but primarily in the second rows of stereocilia in IHCs (arrowheads). E, BAIAP2L2 staining was absent in the stereocilia of OHCs (left) and IHCs (right) from P117 Baiap2l2tm1b/tm1b mice using the same antibody listed above. F, top view of the stereocilia from P15.5 (top) and P26.5 (bottom) IHCs to show that BAIAP2L2 (green) localization shifts to stereocilia shafts in older animals. Single slices shown at approximately mid‐way down the length of row, with instances of clear annular signal indicated by arrowheads.
Figure 5
Figure 5. Separate localization of BAIAP2L2 and EPS8 at the stereocilia tips
A–C, BAIAP2L2 (green) and EPS8 (blue) appear spatially segregated, with the latter primarily located at the tips of the taller rows of stereocilia in P6 IHCs (A) and P12 OHCs (B) from C57BL/6 mice and P113 OHCs (C) from Baiap2l2tm1b/+. D, OHCs from Baiap2l2tm1b/tm1b mice only showed EPS8 staining. In (C) and (D), the phalloidin staining (white: stereociliary marker) is shown separately to better visualize the segregated distribution of BAIAP2L2 and EPS8.
Figure 6
Figure 6. Hair bundle morphology in hair cells from adult Baiap2l2 mice
A–F, scanning electron micrographs showing the typical hair bundle structure from apical‐coil OHCs and IHCs in Baiap2l2tm1b/+ (A, C and E) and Baiap2l2tm1b/tm1b mice (B, D and F) at pre‐hearing stages of development (P11: A and B), at P49 (C and D) and at P245 (E and F). Note that, generally, hair bundles are composed of three rows of stereocilia: tall, intermediate and short. Arrowheads indicate the presence of the third row of stereocilia; arrows indicate missing stereocilia in Baiap2l2 knockout OHCs. E and F, also shows a low magnification SEM illustrating the gross morphology of the apical coil portion of the cochlea control (E, top left) and Baiap2l2tm1b/tm1b (F, top right) mice at P245 days of age. Note that the hair bundles of the hair cells are gradually disappearing from the surface of the epithelium in Baiap2l2tm1b/tm1b (arrowheads in F) but still present in littermate controls (arrows in E).
Figure 7
Figure 7. Bundle morphology is normal at early stages of development in both IHCs and OHCs
A–L, IHC stereocilia lengths and widths for rows 1 and 2. Row 3 stereocilia of IHCs are typically not resolvable by fluorescence, and thus are not measured here. P0.5 from Baiap2l2Δ16/+ (magenta: n = 42 stereocilia profiles from 15 IHCs, 4 cochleae), Baiap2l2Δ16/Δ16 (blue: n = 12 stereocilia profiles from 5 IHCs, 2 cochleae). P3.5 Baiap2l2Δ16/+ (n = 15 stereocilia, 5 IHCs, 3 cochleae), Baiap2l2Δ16/Δ16 (n = 42 stereocilia, 15 IHCs, 6 cochleae). P5.5 Baiap2l2+/+ (red, n = 9 stereocilia, 5 IHCs, 2 cochleae), Baiap2l2Δ16/Δ16 (n = 16 stereocilia, 7 IHCs, 2 cochleae). P8.5 Baiap2l2+/+ (n = 13 stereocilia, 5 IHCs, 1 cochlea), Baiap2l2Δ16/Δ16 (n = 15 stereocilia, 6 IHCs, 2 cochleae). P14.5 Baiap2l2Δ16/+ (n = 4 stereocilia, 3 IHCs, 1 cochlea), Baiap2l2Δ16/Δ16 (n = 12 stereocilia, 6 IHCs, 1 cochlea). P21 Baiap2l2+/+ (n = 9 stereocilia, 3 IHCs, 1 cochlea), Baiap2l2Δ16/Δ16 (n = 10 stereocilia, 7 IHCs, 3 cochleae). M–T, OHC stereocilia lengths and widths for rows 1, 2 and 3. The number of measurable row 3 stereocilia decreases by P21. P5.5 Baiap2l2+/+ (n = 13 stereocilia, 6 OHCs, 2 cochleae), Baiap2l2Δ16/Δ16 (n = 23 stereocilia, 5 OHCs, 1 cochleae). P8.5 Baiap2l2Δ16/+ (n = 73 stereocilia, 15 OHCs, 4 cochleae), Baiap2l2Δ16/Δ16 (n = 45 stereocilia, 9 OHCs, 2 cochleae). P14.5 Baiap2l2+/+ (n = 31 stereocilia, 7 OHCs, 3 cochleae), Baiap2l2Δ16/Δ16 (n = 38 stereocilia, 9 OHCs, 3 cochleae). P21 Baiap2l2+/+ (n = 12 stereocilia, 5 OHCs, 2 cochleae), Baiap2l2Δ16/Δ16 (n = 15 stereocilia, 8 OHCs, 2 cochleae). All measurements were made from apical turn of the cochlea. Pairwise comparisons between genotypes used t tests (two‐tailed, assumption of equal variance). Individual measurements of each stereocilia are plotted separately and overlaid with their mean ± SD. The inset shows an example stereocilia pair from P21 IHCs of Baiap2l2+/+ mice, demonstrating extraction of length and width measurements from fit ellipses applied to a processed xz reslice (panel width of 4 μm).
Figure 8
Figure 8. Mechanoelectrical transduction is reduced in Baiap2l2tmtb mice
A and B, saturating MET currents in apical OHCs from control Baiap2l2tm1b/+ (A, P9) and Baiap2l2tm1b/tm1b (B, P8) mice in response to 50 Hz sinusoidal force stimuli to the hair bundles at membrane potentials of −124 and +96 mV. Driver voltage (DV) stimuli to the fluid jet are shown above the traces, with positive deflections of the DV being excitatory. The arrows and arrowheads indicate the closure of the transducer channel in response to inhibitory bundle stimuli at −124 and +96 mV, respectively. C, average peak to peak MET current–voltage curves from apical OHCs of control Baiap2l2tm1b/+ (n = 11) and littermate Baiap2l2tm1b/tm1b (n = 17) mice. Recordings were obtained by mechanically stimulating the hair bundles of OHCs at the same time as stepping their membrane potential from −124 mV to +96 mV in 20 mV increments. D–F, saturating MET current recorded in P11 OHCs from control (n = 6) and littermate Baiap2l2tm1b/tm1b (n = 4) mice using the same protocols described in (A) to (C). For the single‐data recordings used to calculate the averages shown in (C) and (F), see Supporting information, Data S1. G and H, maximal size of the MET current in both genotypes measured at −124 mV (G) and +96 mV (H) at the two age ranges investigated in (A) to (F). I and J, resting open probability (P o) of the MET current in OHCs from the two genotypes and at the two ages tested from the holding of −124 mV (I) and +96 mV (J). The resting current is given by the holding current minus the current present during inhibitory bundle deflection. The P o was found not to be significantly different between the two genotypes, even though the size of the MET current was largely reduced at P11 (−124 mV: P = 0.1950; +96 mV: P = 0.4225, t test). At P8–P9, Po was also not significantly different between the two genotypes (−124 mV: P = 0.1035; +96 mV: P = 0.0680). For average data values, see Supporting information, Statistical Summary Document. KM, example experiment for FM1‐43 uptake by OHCs from P8.5 Baiap2l2Δ16/+ (K) and P8.5 Baiap2l2Δ16/Δ16 mice with and without the application of 5 mm BAPTA, with quantification (L). Representative results shown from a single experiment (n = 24–36 OHCs per condition). The statistical test was performed via one‐way ANOVA, Sidak's multiple comparison test. N, saturating MET currents in apical IHCs from Baiap2l2tm1b/+ (left, P28) and Baiap2l2tm1b/tm1b (right, P28) mice in response to 50 Hz sinusoidal force stimuli to the hair bundles at membrane potentials of −84. Driver voltage (DV) stimuli to the fluid jet are shown above the traces. O, maximal size of the MET current (left) and resting open probability (P o: right) in adult IHCs from both genotypes measured at −84 mV.
Figure 9
Figure 9. The basolateral membrane properties of adult IHCs are indistinguishable between control and littermate Baiap2l2tm1b/tm1b mice
A and B, current responses from IHCs of control Baiap2l2tm1b/+ (A) and Baiap2l2tm1b/tm1b (B) P28 mice. Current recordings were elicited by using depolarizing voltage steps (10 mV increments) from the holding potential of −84 mV to the various test potentials shown by some of the traces. The fast activation of the BK current (I K,f) is better appreciated in the expanded time scale (insets). C, steady‐state current–voltage curves obtained from IHCs of control (P28‐38) and Baiap2l2tm1b/tm1b (P28‐35) mice. For the single‐data recordings used to calculate the averages shown in (C), see Supporting information, Data S1. D, maximum intensity projections of confocal z‐stacks taken from the apical cochlear region of control and Baiap2l2tm1b/tm1b P32 mice using antibodies against BK (red) and the hair cell marker Myo7a (green). E, size of the outward K+ current I K,f, which was measured at −25 mV and at 1 ms from the onset of the voltage step (Marcotti et al. 2003). The number of IHCs recorded is shown above each column. F, current responses from IHCs of control Baiap2l2tm1b/+ and Baiap2l2tm1b/tm1b P28 mice, elicited by using hyperpolarizing and depolarizing voltage steps (10 mV increments) from the holding potential of −64 mV to the various test potentials shown by some of the traces. This protocol is used to emphasize the presence of I K,n. G, size of I K,n, which was measured as the difference between the peak and steady state of the deactivating inward current at –124 mV. Single cell value recordings (open symbols) are plotted behind the average data. The number of IHCs investigated is shown above the average data points. The average IHC resting membrane potential (V m) and membrane capacitance (C m) were not significantly different between Baiap2l2tm1b/+ (V m −70.4 ± 2.0 mV, n = 8; C m 11.4 ± 2.4 pF, n = 8) and Baiap2l2tm1b/tm1b mice (V m −70.7 ± 3.5 mV, n = 9, P = 0.8275; C m 12.2 ± 2.9 pF, n = 8, P = 0.5606, t test).
Figure 10
Figure 10. The basolateral membrane properties of adult OHCs are preserved in Baiap2l2tm1b mice
A–F, current responses from OHCs of control (Baiap2l2tm1b/+) and Baiap2l2tm1b/tm1b mice at the onset of hearing (P12: A–C) and adult mice (P29‐40: D–F). Currents were elicited by using depolarizing and hyperpolarizing voltage steps (10 mV increments) from the holding potential of −84 mV to the various test potentials shown by some of the traces. Note that the a large I K,n, which is carried by KCNQ4 channels, is present in OHCs at all ages and in both genotypes. Peak current–voltage curves obtained from OHCs of control and Baiap2l2tm1b/tm1b mice are shown in (B) (P12) and (E) (P29‐40). The size of the isolated I K,n (Fig. 9 E) was not significantly different between the two genotypes (C: P12: P = 0.4592; F: P29–40: P = 0.1022, t test). The number of IHCs recorded is shown next to the current–voltage traces (B and E) or above each column (C and F). For the single‐data recordings used to calculate the averages shown in (B) and (E), see Supporting information, Data S1. G, maximum intensity projections of confocal z‐stacks taken from the apical cochlear region of control and Baiap2l2tm1b/tm1b mice at P32 using antibodies against KCNQ4 (red) and prestin (green). Phalloidin (blue) highlights the cuticular plate of the OHCs. Single cell value recordings (open symbols) are also plotted behind the average closed symbols. The number of OHCs investigated is shown above the average data points. The average OHC resting membrane potential (V m) and membrane capacitance (C m) were not significantly different between Baiap2l2tm1b/+ (V m −73.1 ± 1.6 mV, n = 9; C m 10.6 ± 0.6 pF, n = 8) and Baiap2l2tm1b/tm1b mice (V m −73.7 ± 1.3 mV, n = 6, P = 0.7528; C m 10.1 ± 0.3 pF, n = 6, P = 0.5449, t test).
Figure 11
Figure 11. BAIAP2L2 interacts with actin‐associated stereociliary proteins
A, cartoon diagrams showing the GST‐tagged BAIAP2L2 fusion proteins used for the in vitro pull‐down assays (GST tag not included in diagrams). Residue numbering is from the canonical sequence for mouse BAIAP2L2. B, example immunoblot of GST inputs used for pull‐down assays. Detected with rabbit anti‐GST. The predicted molecular weight for each of the constructs is indicated on the right, with the text colour corresponding to the text colour for callout above the appropriate lane. C, immunoblots with His or Myc inputs and eluates containing BAIAP2L2 complexes from in vitro pull‐down assays with BAIAP2L2 fragments to identify interacting proteins. BAIAP2L2 C‐terminal domain interacted with EPS8, EPSNL, CDC42 and RAC1. Immunoblots detected with mouse anti‐His (EPS8, EPS8L1, EPSL2, ESPNL, CDC42 and RAC1) or rabbit anti‐Myc (EZR and RDX). The volume blotted was 1% for inputs and 20% for pull‐down eluates. D, immunoblots with His inputs and eluates containing BAIAP2L2 complexes from in vitro pull‐down assays with truncates of the BAIAP2L2 C‐terminal domain to map BAIAP2L2 binding site. The BAIAP2L2 SH3 domain was found to be necessary for the identified interactions. Detected with mouse anti‐His. For (B) to (D), the volume blotted for input lanes was 1% of the total volume used for the assay, whereas the volume blotted for pull‐down lanes was 20% of the total eluate volume.
Figure 12
Figure 12. BAIAP2L2 targeting to stereocilia tips requires EPS8 and MYO15A
A and B, EPS8 (green) localization in IHCs and OHCs is normal in Baiap2l2tm1b/tm1b mice at P32. C and D, ESPNL is normally localized at the stereocilia of Baiap2l2Δ16/Δ16 mice. E and F, BAIAP2L2 is also present at the stereocilia tip of Espnl−/− mice. G and H, BAIAP2L2 does not localize to stereocilia tips of OHCs (upper) and IHC (lower) in Eps8−/− mice at P7. I and J, BAIAP2L2 and EPS8 both fail to localize to stereocilia tips in Myo15ash2/sh2 mice. Insets of xz reslices to compare stereocilia profiles and respective localization at row 1 and row 2 tips for EPS8 and BAIAP2L2.

References

    1. Abe T, Kakehata S, Kitani R, Maruya S, Navaratnam D, Santos‐Sacchi J & Shinkawa H (2007). Developmental expression of the outer hair cell motor prestin in the mouse. J Membr Biol 215, 49–56. - PMC - PubMed
    1. Ahmed S, Goh WI & Bu W (2010). I‐BAR domains, IRSp53 and filopodium formation. Semin Cell Dev Biol 21, 350–356. - PubMed
    1. Avenarius MR, Krey JF, Dumont RA, Morgan CP, Benson CB, Vijayakumar S, Cunningham CL, Scheffer DI, Corey DP, Müller U, Jones SM & Barr‐Gillespie PG (2017). Heterodimeric capping protein is required for stereocilia length and width regulation. J Cell Biol 216, 3861–3881. - PMC - PubMed
    1. Bartles JR, Zheng L, Li A, Wierda A & Chen B (1998). Small espin: a third actinbundling protein and potential forked protein ortholog in brush border microvilli. J Cell Biol 143, 107–119. - PMC - PubMed
    1. Bartles JR (2000). Parallel actin bundles and their multiple actin‐bundling proteins. Curr Opin Cell Biol 12, 72–78. - PMC - PubMed

Publication types