. 2020 Nov 6;69(44):1625-1630.
doi: 10.15585/mmwr.mm6944a3.

Network Characteristics and Visualization of COVID-19 Outbreak in a Large Detention Facility in the United States - Cook County, Illinois, 2020

Network Characteristics and Visualization of COVID-19 Outbreak in a Large Detention Facility in the United States - Cook County, Illinois, 2020

Uzay Kırbıyık et al. MMWR Morb Mortal Wkly Rep. .

Abstract

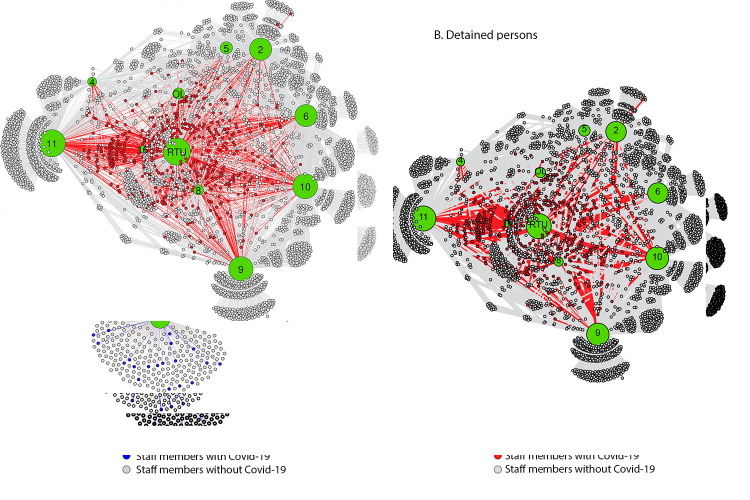
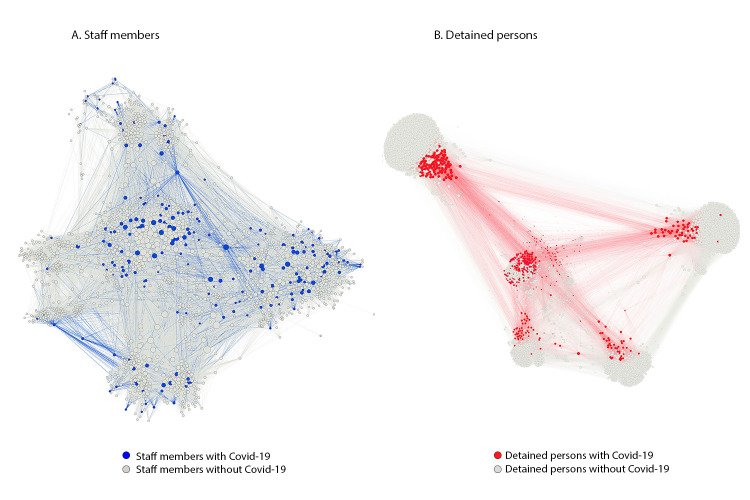
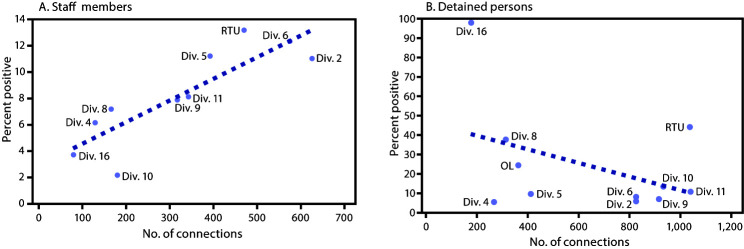
Correctional and detention facilities have been disproportionately affected by coronavirus disease 2019 (COVID-19) because of shared space and movement of staff members and detained persons within facilities (1,2). During March 1-April 30, 2020, at Cook County Jail in Chicago, Illinois, >900 COVID-19 cases were diagnosed across all 10 housing divisions, representing 13 unique buildings. Movement within the jail was examined through network analyses and visualization, a field that examines elements within a network and the connections between them. This methodology has been used to supplement contact tracing investigations for tuberculosis and to understand how social networks contribute to transmission of sexually transmitted infections (3-5). Movements and connections of 5,884 persons (3,843 [65%] detained persons and 2,041 [35%] staff members) at the jail during March 1-April 30 were analyzed. A total of 472 (12.3%) COVID-19 cases were identified among detained persons and 198 (9.7%) among staff members. Among 103,701 shared-shift connections among staff members, 1.4% occurred between persons with COVID-19, a percentage that is significantly higher than the expected 0.9% by random occurrence alone (p<0.001), suggesting that additional transmission occurred within this group. The observed connections among detained persons with COVID-19 were significantly lower than expected (1.0% versus 1.1%, p<0.001) when considering only the housing units in which initial transmission occurred, suggesting that the systematic isolation of persons with COVID-19 is effective at limiting transmission. A network-informed approach can identify likely points of high transmission, allowing for interventions to reduce transmission targeted at these groups or locations, such as by reducing convening of staff members, closing breakrooms, and cessation of contact sports.


Conflict of interest statement

All authors have completed and submitted the International Committee of Medical Journal Editors form for disclosure of potential conflicts of interest. No potential conflicts of interest were disclosed.

Figures

FIGURE 1
FIGURE 1
Visualization of staff members (A) and detained persons (B) epidemiologically linked to an outbreak of COVID-19 using person-division networks — Cook County Jail, Illinois, March 1–April 30, 2020 Abbreviations: COVID-19 = coronavirus disease 2019; OL = offsite location; RTU = residential treatment unit. * Staff members–division network includes 1,843 persons who did not have COVID-19 (gray) and 198 with COVID-19 (blue) as reported to the Cook County Sheriff’s Office. Lines (connections) are colored according to the same color scheme. Detained persons–division network includes 3,371 persons without COVID-19 (gray) and 472 persons with COVID-19 (red). Lines (connections) are colored according to the same color scheme. COVID-19 cases were defined as detection of SARS-CoV-2 (the virus that causes COVID-19) by real-time reverse transcription–polymerase chain reaction (RT-PCR) testing in specimens from detained persons, and among staff members, as reported symptoms or SARS-CoV-2 positive RT-PCR test results. Numbers and letters in large circles within figure represent the individual housing divisions; circle sizes correlate to the number of connections (e.g., a larger circle indicates higher number of connections). Location of division node is not representative of the geographic location of the division on-site at the jail.
FIGURE 2
FIGURE 2
Visualization of staff members (A) and detained persons (B) epidemiologically linked to an outbreak of COVID-19 using person-person networks — Cook County Jail, Illinois, March 1–April 30, 2020 Abbreviation: COVID-19 = coronavirus disease 2019. *Staff members–person-person network includes 103,701 connections between 1,843 persons who did not have COVID-19 (gray) and 198 persons with COVID-19 as reported to the Cook County Sheriff’s Office (blue). Lines (connections) are colored according to the same color scheme. Observed positive-positive connections were higher than expected (n = 1,420 [1.4%] versus n = 976 [0.9%], p<0.05). Most observed connections were between persons who did not have positive test results (n = 83,813, 80.8%). Detained persons–person-person network includes 1,214,462 connections between 3,371 persons without COVID-19 (gray) and 472 persons with COVID-19 (red). Connections are colored according to the same color scheme. Observed positive-positive connections were higher than expected (n = 39,141 [3.2%] versus n = 18,320 [1.5%], p<0.05). When excluding connections associated with persons in medical isolation or at off-site locations (e.g., residential treatment unit, division 16, and off-site locations, the rate of observed connections is significantly less than expected (n = 11,017 [1.0%] versus n = 12,165 [1.1%], p<0.05). In March, as the number of persons with COVID-19 were increasing, the mean number of interactions between staff members with COVID-19 (n = 377) was significantly higher than that of staff members without COVID-19 (n = 321) [p<0.001]. This difference was not seen in April when cases were declining. § COVID-19 cases were defined as detection of SARS-CoV-2 (the virus that causes COVID-19) by real-time reverse transcription–polymerase chain reaction (RT-PCR) testing in specimens from detained persons, and among staff members, as reported symptoms or SARS-CoV-2 positive RT-PCR test results.
FIGURE 3
FIGURE 3
Correlation between percentage of staff members (A) and detained persons (B) with COVID-19 with number of connections for all divisions — Cook County Jail, Illinois, March 1–April 30, 2020 Abbreviations: COVID-19 = coronavirus disease 2019; OL = offsite location; RTU = residential treatment unit. * Staff members: r = 0.86, p< 0.05; detained persons: r = −0.43, p = 0.20. A total of 3,278 connections were identified for staff members among all divisions with 198 with COVID-19 cases, as reported to the Cook County Sheriff’s Office. Connections were defined as having at least one shift in a given division during the study period; division connections are not mutually exclusive, so staff members who worked at least one shift in multiple divisions are represented. r = 0.86, p< 0.05 § A total of 6,056 connections were identified for detained persons among all divisions, with 472 COVID-19 cases. Connections were defined as having at least one bed or cell assignment in a given division during the study period; division connections are not mutually exclusive, so detainees with an assignment in more than one division are represented. COVID-19 cases were defined as detection of SARS-CoV-2 (the virus that causes COVID-19) by real-time reverse transcription–polymerase chain reaction (RT-PCR) testing specimens from in detained persons, and among staff members, as reported symptoms or SARS-CoV-2 positive RT-PCR test results.

References

    1. Kinner SA, Young JT, Snow K, et al. Prisons and custodial settings are part of a comprehensive response to COVID-19. Lancet Public Health 2020;5:e188–9. 10.1016/S2468-2667(20)30058-X - DOI - PMC - PubMed
    1. Wallace M, Hagan L, Curran KG, et al. COVID-19 in correctional and detention facilities—United States, February–April 2020. MMWR Morb Mortal Wkly Rep 2020;69:587–90. 10.15585/mmwr.mm6919e1 - DOI - PubMed
    1. Okano JT, Blower S. Preventing major outbreaks of COVID-19 in jails. Lancet 2020;395:1542–3. 10.1016/S0140-6736(20)31015-1 - DOI - PMC - PubMed
    1. Andre M, Ijaz K, Tillinghast JD, et al. Transmission network analysis to complement routine tuberculosis contact investigations. Am J Public Health 2007;97:470–7. 10.2105/AJPH.2005.071936 - DOI - PMC - PubMed
    1. Campbell EM, Jia H, Shankar A, et al. Detailed transmission network analysis of a large opiate-driven outbreak of HIV infection in the United States. J Infect Dis 2017;216:1053–62. 10.1093/infdis/jix307 - DOI - PMC - PubMed