. 2020 Nov 5;16(11):e1009128.
doi: 10.1371/journal.pgen.1009128. eCollection 2020 Nov.

The Bric-à-Brac BTB/POZ transcription factors are necessary in niche cells for germline stem cells establishment and homeostasis through control of BMP/DPP signaling in the Drosophila melanogaster ovary

Affiliations

The Bric-à-Brac BTB/POZ transcription factors are necessary in niche cells for germline stem cells establishment and homeostasis through control of BMP/DPP signaling in the Drosophila melanogaster ovary

Laurine Miscopein Saler et al. PLoS Genet. .

Abstract

Many studies have focused on the mechanisms of stem cell maintenance via their interaction with a particular niche or microenvironment in adult tissues, but how formation of a functional niche is initiated, including how stem cells within a niche are established, is less well understood. Adult Drosophila melanogaster ovary Germline Stem Cell (GSC) niches are comprised of somatic cells forming a stack called a Terminal Filament (TF) and associated Cap and Escort Cells (CCs and ECs, respectively), which are in direct contact with GSCs. In the adult ovary, the transcription factor Engrailed is specifically expressed in niche cells where it directly controls expression of the decapentaplegic (dpp) gene encoding a member of the Bone Morphogenetic Protein (BMP) family of secreted signaling molecules, which are key factors for GSC maintenance. In larval ovaries, in response to BMP signaling from newly formed niches, adjacent primordial germ cells become GSCs. The bric-à-brac paralogs (bab1 and bab2) encode BTB/POZ domain-containing transcription factors that are expressed in developing niches of larval ovaries. We show here that their functions are necessary specifically within precursor cells for TF formation during these stages. We also identify a new function for Bab1 and Bab2 within developing niches for GSC establishment in the larval ovary and for robust GSC maintenance in the adult. Moreover, we show that the presence of Bab proteins in niche cells is necessary for activation of transgenes reporting dpp expression as of larval stages in otherwise correctly specified Cap Cells, independently of Engrailed and its paralog Invected (En/Inv). Moreover, strong reduction of engrailed/invected expression during larval stages does not impair TF formation and only partially reduces GSC numbers. In the adult ovary, Bab proteins are also required for dpp reporter expression in CCs. Finally, when bab2 was overexpressed at this stage in somatic cells outside of the niche, there were no detectable levels of ectopic En/Inv, but ectopic expression of a dpp transgene was found in these cells and BMP signaling activation was induced in adjacent germ cells, which produced GSC-like tumors. Together, these results indicate that Bab transcription factors are positive regulators of BMP signaling in niche cells for establishment and homeostasis of GSCs in the Drosophila ovary.


Conflict of interest statement

The authors have declared that no competing interests exist.

Figures
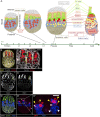
Fig 1
Fig 1. Specific cell types of the developing and adult Drosophila ovary.
(A) Schematic drawings of a developing ovary from mid L3 to prepupal stages and of an adult germarium. Anterior is to the top and for the developing ovaries, medial is to the left. Intervals on the X-axis indicate the duration of each stage. The red, spherical structure in Germ Cells (GCs), Germline Stem Cells (GSCs) and precystoblasts represent the spectrosome and the red, branched structures in maturing germline cysts in the germarium represent fusomes, which are derived from spectrosomes. Spectrosomes and fusomes are cytoplasmic structures composed of cytoskeletal proteins. A fully-formed GSC niche is composed of a Terminal Filament (TF), which is a stack of about 8 flattened cells, approximately 5–6 Cap Cells (CCs) present at the base of the TF, one triangularly-shaped transition cell (TC) between the bottom of the TF and the CCs [10] and, in adult ovaries, the anterior Escort Cells (ECs) derived from larval posterior most-Intermingled Cells (ICs). At the prepupal stage, Sheath Cells (SHCs) begin to separate individual ovarioles having already begun with the TFs. (B-D”) Whole mount immunostaining of wild type prepupal ovaries. Anterior is up, medial is to the left. Scale bar: 10 μm. (B’,D”) Higher magnifications of the niche regions of the corresponding ovaries (B,D). (B,B') Engrailed/Invected (En/Inv) (red) mark the niche cell nuclei specifically and F-actin labeled with phalloidin (grey) marks all cell membranes. (B’) TF cells (green bracket) and the TC (green arrowhead) present nuclei accumulating high levels of En/Inv, while CCs (yellow bracket) present lower En/Inv levels. (C) Bab2 accumulates in the nuclei of all somatic cells, but at a higher level in TFs and CCs (green and yellow brackets, respectively). (C') Bab1 accumulates in TF cells and CCs, and is detected at low levels in ICs (blue bracket). (D) En/Inv (green) mark the nuclei of niche cells, and Vasa (blue) marks the cytoplasm of GCs. (D',D") In the most anterior GCs, the BMP signaling pathway is activated as evidenced by accumulation of pMad (red) at high (red arrowheads) or low (pink arrowheads) levels. GCs accumulating pMad and in contact with CCs are considered as GSCs. CCs (yellow arrowheads) and other peripheral posterior somatic cells (blue arrowhead) also accumulate pMad.
Fig 2
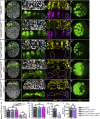
Fig 2. Reduction of both Bab1 and Bab2, but not each separately, in developing niches impedes Terminal Filament formation in prepupal ovaries.
(A-E) Whole mount prepupal ovaries immunostained for detection of GFP (green), Bab1 (magenta) and Bab2 (yellow). Nuclei are labeled with DAPI (grey). The yellow dotted lines encircle GSC niches in the medial region of the ovary, and the blue dotted lines indicate laterally positioned niches. Anterior is up, medial is left. Scale bars: 10 μm. (A’,B’,C’,D’,E’) Higher magnifications of the niche regions of the corresponding ovaries. (A”,B”,C”,D”,E”) Anterior views of ovaries using 3D reconstruction. Each GFP circle corresponds to the cross section of one TF. (A-A’) Control ovary expressing a UAS-GFP construct under the control of a hedgehog(hh)-Gal4 driver (hhG>GFP). Bab2 accumulates in nuclei of all somatic ovarian cells, but at a higher level in TF cell and Cap Cell (CC) nuclei. Bab1 accumulates at a high level in TF cell and CC nuclei. (B-B’) Prepupal ovary expressing an RNAi transgene against bab2 (hhG>GFP, bab2IR). Consistent with the expression profile of the hhG driver, Bab2 depletion is obtained in all medial TF cells but not in all CCs at the base of these TFs, and is not obtained in lateral hhG+ cells. (C-C’) Prepupal ovary from a female homozygous for a bab1 mutant allele (babA128, hhG>GFP). Bab1 is not detectable in medial or lateral niches, or in underlying ICs. (D-D’) Prepupal ovary homozygous for babA128 and expressing an RNAi transgene against bab2 (babA128, hhG>GFP, bab2IR). Bab2 depletion is obtained in medial but not lateral hhG+ cells. Bab1 is not detectable. (E-E’) Prepupal ovary expressing RNAi transgenes against bab1 and bab2 (hhG>GFP, bab1IR, bab2IR). Bab1 and Bab2 depletion is obtained in medial but not lateral hhG+ cells. (D-D’,E-E’) Upon reduction of both Bab1 and Bab2 in hhG+ cells (yellow dotted lines), these cells fail to flatten, to stack and to form TFs. (F-I) Graphs comparing different parameters related to TF formation. (F) The mean number of TFs per ovary is not significantly different between the control and the ovaries depleted of either Bab1 or Bab2. However, the ovaries depleted of both Bab1 and Bab2 have significantly fewer TFs per ovary than the control. The higher penetrance evidenced by the abnormally low TF number per ovary phenotype using babA128 instead of UAS-bab1IR for the double bab1/bab2 knockdown may be attributable to the more efficient depletion obtained for Bab1 with babA128 than with UAS-bab1IR. (G) The mean number of TF cells (TFCs) per TF is not different between control ovaries and ovaries depleted of Bab1 or Bab2. (H) Control hhG+ cells are significantly flatter than those knocked down for bab1 and bab2, with the degree of flattening measured as the ratio between the width and height of the cells using F-actin labeling to visualize cell perimeters. (I) The mean number of hhG+ cells per ovary is comparable in control ovaries and ovaries depleted of Bab1 and Bab2. Values are presented as means +s.d., p-values are calculated using a one-way ANOVA test for F and G, and a two-tailed t-test for H and I. n: sample size; NS: Not Significant (p>0.05); **** (p<0.0001).
Fig 3
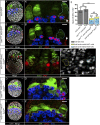
Fig 3. Reduction of both Bab1 and Bab2, but not each separately, in developing niches of larval ovaries leads to almost no Germline Stem Cell establishment by the prepupal stage.
(A-E) Prepupal ovaries immunostained for GFP to mark niche cells (green), Vasa (blue) to mark germ cells (GCs) and pMad (red) to mark GSCs. Nuclei are labeled with DAPI (grey). Anterior is up, medial is left. Scale bars: 10 μm. The yellow dotted lines encircle niches (A-C) or hhG+ cells depleted of Bab1 and Bab2 (D-E) of the medial region of the ovaries while the blue dotted lines encircle niches of the lateral region. (A’,B’,C’,C”,D’,E’) Higher magnifications of the niche regions of the corresponding ovaries. (A-A’) In a control ovary, pMad is detected in the anterior-most Germ Cells (GCs). These Vasa+/pMad+ GCs are in direct contact with the niches and are considered as Germline Stem Cells (GSCs). (B-B') In an ovary mutant for bab1 (babA128, hhG>GFP), no significant difference is observed when compared to the control regarding the presence of GSCs in contact with the niches. (A’,B’) Cap Cells (CCs) and some peripheral posterior somatic cells (arrowheads) accumulate pMad, but can be distinguished from GCs since they do not accumulate Vasa. (C-C”) In a hhG>GFP,dicer2,bab2IR ovary, the rare medial niches strongly depleted of Bab2 in all CCs (yellow dotted lines) are associated with GSCs, as are lateral niches not depleted of Bab2 (blue dotted lines). (D-E’) In babA128,hhG>GFP,bab2IR and hhG>GFP, bab1IR,bab2IR prepupal ovaries, almost none of the GCs in contact with hhG+ medial cells, strongly depleted of Bab1 and Bab2, are GSCs since they are not pMad+. In contrast, in the same ovaries, in lateral niches where Bab depletion does not occur, normal niches are formed and are associated with GSCs as in the control. (F) Graph comparing the mean number of GSCs per ovary in control ovaries (hhG>GFP) and in ovaries strongly depleted of Bab1 alone (babA128,hhG>GFP) or both Bab1 and Bab2 (babA128,hhG>GFP,bab2IR and hhG>GFP, bab1IR,bab2IR). A significantly lower number of GSCs per ovary was obtained only when Bab1 and Bab2 were depleted together. Moreover, in both mutant contexts, the majority of GSCs were found in the lateral part of the ovary were TFs form (blue bar) and very few in the medial part where they do not form (about 3 GSCs per ovary, yellow bar). Values are presented as means +s.d., p-values are calculated using a one-way ANOVA test. n: sample size; NS: Not Significant (p>0.05); **** (p<0.0001).
Fig 4
Fig 4. Some Germ Cells adjacent to niches with undetectable levels of Bab proteins begin to differentiate into cystoblasts.
(A-B’) Prepupal ovaries immunostained to reveal β-Galactosidase (β-Gal, grey) for hhG+ cells, GFP (green) for bamP-GFP transcriptional reporter expression, and Vasa (red) for Germ Cells (GCs). Nuclei are labeled with DAPI (blue). Anterior is up, medial is left. Scale bars: 10 μm. hhG+ cells are encircled in yellow and blue dotted lines in the medial and lateral regions of the ovaries, respectively. (A’,B’) Higher magnifications of the niche regions of the corresponding ovaries in (A,B). (A') In a control ovary, the differentiating GCs expressing the bamP-GFP transcriptional reporter are mainly found one-cell diameter away from the β-Gal+ niche cells. A faint GFP signal is also sometimes observed in some GSC niche cells. (B') In ovaries depleted of Bab1 and Bab2, some differentiating GCs can be observed in direct contact with β-Gal+ cells (white arrowhead). (C) Quantification of the mean number of GFP+ differentiating GCs in contact with β-Gal+ cells per ovary. In the ovaries depleted of Bab1 and Bab2, significantly more GFP+ differentiating GCs are found in contact with β-Gal+ cells and most of these cells are found in the medial part of the ovary where depletion of the Bab proteins is efficient (yellow bar), rather than laterally where it is not (blue bar). Values are presented as means +s.d., p-values are calculated using a t-test with Welch’s correction. n: sample size; **** (p<0.0001).
Fig 5
Fig 5. bab1 and bab2 functions are not necessary in Cap Cells for expression of several specific markers at the prepupal stage.
(A-F”) Medial region of prepupal ovaries. Nuclei are labeled with DAPI (grey). Anterior is up. Scale bars: 10 μm. (A-A”’,C-C”,E-E”) hhG>GFP control ovaries. One niche is encircled in each panel (pink dotted line). The green and yellow brackets indicate Terminal Filament (TF) cells and Cap Cells (CCs), respectively, and the green arrowheads point to transition cells. (B-B”’,D-D”,F-F”) hhG>GFP,bab1IR,bab2IR knockdown ovaries. The entire cluster of hhG+ cells strongly depleted of Bab1 and Bab2 is encircled in each panel (pink dotted line). The green and yellow brackets indicate the anterior- and posterior-most hhG+ cells, respectively. (A-A”’) In a control ovary, the two nuclear CC markers, P1444-lacZ (grey) and Traffic Jam (Tj, red), are detected in CCs and sometimes in the transition cell. P1444-lacZ is also detected at a low level in some TF cells. The Germ Cells (GCs) marked with Vasa (red) in direct contact with niche cells (white arrowheads) and showing nuclear pMad (green) are considered as Germline Stem Cells (GSCs). (B-B”’) Posterior-most medial hhG+ cells depleted of Bab1 and Bab2, express both Tj and P1444-lacZ and are adjacent to GCs, which do not present pMad+ (B”’, arrowheads). (C-C") In a control ovary, Delta (grey) accumulating at the plasma membrane and in cytoplasmic vesicles in TF cells is also detected in vesicles around the transition cell (green arrowhead) and sometimes in CCs (arrow). (D-D") Upon depletion of Bab1 and Bab2 in hhG+ cells, Delta is not present at the plasma membrane, but is found in some vesicles (arrows). (E-E",F-F") In both the control (E-E") and upon depletion of Bab1 and Bab2 in hhG+ cells (F-F"), the Notch pathway transcriptional reporter E(spl)mβ-CD2 is expressed since CD2 (grey) accumulates at the plasma membrane of TF cells and anterior hhG+ cells, respectively, as well as in CCs and posterior hhG+ cells, respectively, the latter also accumulating Tj.
Fig 6
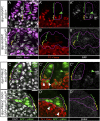
Fig 6. bab1 and bab2 functions in niche cells are required for expression of several dpp reporter transgenes.
(A-D) Medial region of prepupal ovaries. Nuclei are labeled with DAPI (grey). Germ Cells (GCs) are visualized with immunostaining of cytoplasmic Vasa (red). Anterior is up. Scale bars: 10 μm. (A-A",C-C") One hhG>GFP medial niche is encircled (pink dotted line) in control ovaries and green and yellow brackets indicate Terminal Filament (TF) cells and Cap Cells (CCs), respectively. The green arrowheads point to transition cells. (B-B”, D-D”) The entire cluster of medial hhG+ cells is encircled (pink dotted line) in bab1 and bab2 knockdown ovaries, and green and yellow brackets indicate the anterior- and posterior-most hhG+ cells, respectively. (A,B) Somatic cells are marked with Bab2 (magenta). (A-A”) In a control ovary, dpp-nlsGFP (grey) is specifically expressed in CCs along with nuclear Traffic Jam (Tj, red) and sometimes in the transition cell, but not in TFs. (B-B”) Upon bab1 and bab2 RNAi-mediated knockdown, dpp-nlsGFP is not expressed in posterior-most hhG+ cells that are positive for the nuclear CC marker Tj, and in contact with the GCs. (C-C”) In a control ovary, dpp-P4lacZ expression (grey) is found in CCs in contact with GSCs that are marked with nuclear pMad+ (green, white arrowheads) and often in the transition cell (green arrowhead). (D-D”) Upon bab1 and bab2 knockdown, dpp-P4lacZ expression is not detected in the posterior-most hhG+ cells that are positive for the CC marker Tj, and this correlates with an absence of pMad in the underlying GCs (white arrowheads).
Fig 7
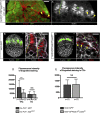
Fig 7. bab gene functions contribute to regulation of Engrailed/Invected accumulation in Terminal Filament cells but not in Cap Cells.
(A-C') Prepupal ovaries immunostained for detection of GFP (green) and Engrailed/Invected (En/Inv) (grey in A’ and red in B’,C’). F-actin labeling is shown in red (A) and grey (B-C'). Anterior is up, medial is left. Scale bars: 10 μm. (A-A', B') Green and yellow brackets indicate Terminal Filament (TF) cells and Cap Cells (CCs), respectively. (C-C') The cluster of medial hhG+ cells depleted of Bab1 and Bab2 is encircled (pink dotted line). Green and yellow arrowheads indicate the anterior- and posterior-most hhG+ cells, respectively. (A-A’) Niche region of a mosaic ovary (hs-FLP; FRT-babAR07/FRT-GFP) containing mitotic cell clones homozygous for the babAR07 mutation that are marked by absence of GFP (green and yellow arrowheads). In babAR07 mutant TF cells (green arrowheads), the signal for En/Inv is lower than that in wild type TF cells (green brackets). However, in babAR07 mutant Cap Cells (CCs) in contact with GCs (yellow arrowheads), the level of En/Inv is similar to its endogenous level in wild type CCs (yellow bracket). (B,C) Prepupal ovaries expressing GFP in hhG+ cells (hhG>GFP), and in C, RNAi transgenes against bab1 and bab2 (hhG>GFP, bab1IR, bab2IR) as well. (B’,C’) Higher magnifications of the regions framed with dotted lines in (B,C). The anterior-most cells hhG+ cells of hhG>GFP, bab1IR, bab2IR ovaries (C’, green arrowheads) present lower levels of En/Inv (C’, green arrowheads) than TF cells in the control (B’, green brackets). The posterior-most hhG+ cells depleted of Bab1 and Bab2 (C', yellow arrowheads) show a similar level of En/Inv than in control CCs (B’, yellow brackets). (D) Graph comparing the fluorescence intensity (arbitrary units) of En/Inv in control niche and babAR07 clonal cells. In babAR07 mutant TF cells (hs-FLP, babAR07), the En/Inv fluorescence intensity is more than 2-fold lower than in adjacent control TF cells (hs-FLP, GFP). However, in babAR07 mutant CCs, the En/Inv fluorescence intensity is similar to that in adjacent control CCs. (E) Graph comparing the fluorescence intensity (arbitrary units) of En/Inv in CCs in the control (B', yellow brackets) and in posterior-most hhG+ cells knocked down for bab1 and bab2 using RNAi (C', yellow arrowheads). Values are presented as means +s.d. p-values are calculated using a Kruskal-Wallis (D) or Mann-Whitney (E) test. n: sample size; NS: Not Significant (p>0.05); **** p<0.0001).
Fig 8
Fig 8. Reduction of Engrailed/Invected levels in developing niche cells does not impair Terminal Filament formation.
(A-B”) Prepupal ovaries immunostained for detection of Engrailed/Invected (En/Inv) (grey). F-actin labeling is shown in red (A,A”,B,B”). Nuclei are labeled with DAPI (cyan). Anterior is up, medial is left. Scale bars: 10 μm. (A’,A”,B’,B”) Higher magnifications of the niche regions of the corresponding ovaries in (A,B). (A) Control ovary (babG>+), showing accumulation of En/Inv in the niche cells (Terminal Filament (TF) cells, green bracket and Cap Cells (CCs), yellow bracket). (B-B”) In an ovary carrying transgenes targeting en/inv for RNAi (babG>UAS-enIR, UAS-invIR), En/Inv are efficiently depleted (B), while TF morphology resembles that of control TFs (B,B"). However, some TFs are not well separated from each other (arrows). (C-E) Graphs comparing different parameters related to TF formation, between control ovaries and ovaries depleted of En/Inv. (C) Mean number of TFs per ovary, (D) mean number of TF cells per TF and (E) mean number of CCs per TF. The TF cells were distinguished from CCs by their flattened nuclei and their flat shape, as determined by DAPI (A’,B’) and F-actin labeling (A",B"), respectively. CCs were distinguished from Intermingled Cells (ICs) using Bab1 immunostaining, which is high in CCs and low in ICs (Fig 1C’). None of these parameters were significantly different between control and En/Inv depleted ovaries. Values are presented as means +s.d., p-values are calculated using a two-tailed t-test (C, E) or a Mann-Whitney test (D). n: sample size; NS: Not Significant (p>0.05).
Fig 9
Fig 9. Reduction of en/inv functions during larval stages leads to only a partial loss of Germline Stem Cells by the prepupal stage but to strong Germline Stem Cells loss in adult germaria.
(A-B) Prepupal ovaries immunostained for detection of Engrailed/Invected (En/Inv) (green), Vasa (red) and pMad (grey). Nuclei are labeled with DAPI (grey). Anterior is up, medial is left. Scale bars: 10 μm. (A’,B’) Higher magnifications of the niche regions of the corresponding ovaries in (A,B). In control ovaries (G80TS; babG>+) and ovaries depleted of En/Inv (G80TS; babG/UAS-enIR, UAS-invIR), Germline Stem Cells (GSCs) with both high and low pMad levels are present (red and pink arrowheads, respectively). (C) Pie charts comparing the proportion of prepupal niches associated with: at least one GSC with a high level of pMad (red), at least one GSC with a low level of pMad (pink), GCs without nuclear pMad (blue) and no Germline Cells (GCs) (green). The depletion of En/Inv does not change the proportion of prepupal niches associated with at least one GSC (sum of pink and red portions, 91.3% and 92.7% in control and En/Inv-depleted niches, respectively). (D) Graph comparing the mean number of GSCs per prepupal ovary in control and En/Inv depleted ovaries. The number of GSCs per ovary is significantly lower in En/Inv depleted ovaries (black bar), due to the significantly lower mean number of high-level pMad+ GSCs (red bar) and not to the mean number of low-level pMad+ GSCs (pink bar). Values are presented as means +s.d. p-values are calculated using a two-tailed t-test or a Mann-Whitney test. n: sample size; NS: Not Significant (p>0.05); **** (p<0.0001). (E-H) Germaria from 1 day-old adult females carrying transgenes for temperature-controlled RNAi of en/inv (G80TS; babG/UAS-enIR, UAS-invIR), immunostained for En/Inv (green), Vasa (red) and pMad and Bab1 (yellow). Anterior is up. Scale bars: 10μm. The temperatures used for raising the flies are indicated on top of the images. (E’-E”’,F’-F”’, G’-G”’) Higher magnifications of the corresponding niche regions in (E,F,G). (E-E‴) Germarium of a female raised at 29°C from the L1 stage to one-day old adulthood showing efficient depletion of En/Inv in Cap Cells (CCs) (9E”, yellow bracket). This germarium does not contain any GSCs (E”’, blue arrowheads). (F-F‴) Germarium of a female raised at 18°C from the L1 stage to one-day old adulthood is not depleted of En/Inv in CCs (F”, yellow bracket) and exhibits GSCs with high and low levels of pMad (F”’, red and pink arrowheads, respectively). (G-G‴) Germarium of a female raised at 29°C from L1 stage and transferred to 18°C at the prepupal stage, showing the presence of En/Inv in CCs (G”, yellow bracket) and a GSC (G”’, pink arrowhead). (H) Germarium of a female raised at 29°C from the L1 stage to one-day old adulthood showing efficient depletion of En/Inv in CCs (yellow bracket) but no GCs close to the niche. (I) Pie charts comparing the proportion of germaria present in ovaries from females raised at the indicated temperatures with: at least one GSC with a high level of pMad (red), at least one GSC with a low level of pMad (pink), GCs without nuclear pMad (blue), or no GCs (green). The re-expression of en/inv in ovaries from the prepupal stage onwards (29->18°C) leads to significant rescue (from 0% to 62.6%) of the proportion of germaria containing GSCs.
Fig 10
Fig 10. Bab proteins are required for the activation of a transgene reporting dpp expression in Cap Cells and contribute to GSC maintenance in adult ovaries.
(A-H) Adult germaria from females carrying transgenes for temperature-controlled RNAi of bab1 and bab2 (G80TS; hhG/UAS-bab1IR, UAS-bab2IR) or of the control genotype (G80TS; hhG/+). Females were raised at 18°C to the young pupal stage, shifted to 29°C until eclosion and shifted to 31°C for 7 days. Ovaries were immunostained for detection of Dpp-nlsGFP (green), Traffic Jam (Tj, red) and Bab1 (yellow) (A-B), Engrailed/Invected (En/Inv, red) and Bab2 (yellow) (C-D), and pMad (red) and Vasa (cyan) (E-G). Nuclei are labeled with DAPI (grey). (A’-A”’ to H’-H”’) Higher magnifications of the corresponding niche regions are shown (dotted lines). Anterior is to the left. Scale bars: 10μm. Yellow brackets indicate CCs, detected according to their location in the germarium and to their expression of CC markers, Tj (A-B) and En/Inv (C-D). (A-D) Germaria showing efficient depletion of Bab1 (B”) and Bab2 (D”’) in Cap Cells (CCs), correlated with barely detectable expression of dpp-nlsGFP in CCs (B”’) when compared to the corresponding control (A”, C”’ and A”’, respectively). (E-H”’) Niches depleted of Bab1 and Bab2 are associated with GSCs exhibiting high to barely detectable levels of pMad (F’,G’, red and pink arrowheads, respectively, compared to the control, E’). Germaria that do not contain any GCs close to the niche are also observed (H’). The expression of dpp-nlsGFP (E”,F”, green arrowheads) can be detected at a very low level in some CCs (F”) compared to the control (E”), but is undetectable in the majority of cases (G”). (I) Pie charts comparing the proportion of germaria from ovaries of control and bab gene knockdown females with: at least one GSC with a high level of pMad (red), at least one GSC with a low level of pMad (pink), GCs without nuclear pMad (blue), or no GCs (green). The knockdown of bab genes thus leads to the appearance of germaria devoid of GSCs and to rudimentary germaria devoid of GCs. (J) Graph comparing the mean number of GSCs per germarium in control ovaries and in ovaries depleted of Bab proteins from 7- or 16-day old females. At 7 days, the average number of GSC per germaria is significantly lower (black bar) in Bab depleted ovaries (1.8) compared to the controls (2.7), largely due to the significantly lower number of high-level pMad+ GSCs (red bar). At 16 days, similar results are obtained with the exception that no difference is observed for low-level pMad+ GSCs (pink bar). Values are presented as means +s.d., p-values are calculated using a two-tailed t-test or a Mann-Whitney test. n: sample size; NS: Not Significant (p>0.05); * (p<0.05); **** (p<0.0001). (K) Graph comparing the mean number of CCs per germarium in control germaria (dpp-nlsGFP, G80TS, hhG>+) to that in germaria with temporally controlled RNAi-induced knockdown of bab genes from the young pupal stage onwards (G80TS; hhG/UAS-bab1IR, UAS-bab2IR). A small but significantly lower number of CCs/germarium was observed in bab1 and bab2 knockdown adult ovaries when compared to the control. Values are presented as means +s.d. p-values are calculated using a two-tailed t-test with Welch’s correction. n: sample size; * (p<0.05).
Fig 11
Fig 11. The overexpression of bab2 in somatic cells outside the niche is sufficient to induce GSC expansion in adult germaria and ectopic expression of a dpp-nlsGFP reporter.
(A-I) Adult germaria from 10-day old females raised at 18°C during development and transferred to 29°C upon eclosion. DAPI nuclear labeling is in grey. Yellow brackets indicate the GSC niches. Anterior is up. Scale bars: 10μm. (A-D) Ovaries were immunostained for detection of pMad (green) and Vasa (red). (A,A') In a control C578G>+ ovary, Germline Stem Cells (GSCs) are marked with pMad at high or low levels (red and pink arrowheads, respectively). pMad also accumulates faintly in the maturating germline cyst (red brackets). (B,B’) In rare cases, the ectopic expression of bab1 (C578>UAS-bab1) leads to the presence of ectopic pMad+ Germ Cells (GCs) (pink arrowheads). (C-C’) Inducing higher levels of Bab2 (C578>UAS-bab2) in ECs and prefollicle cells leads to an increase in the number of GSCs in continuity with the niche (pink bracket) or at ectopic positions in the germaria (pink arrowheads). (D-D”) Engrailed/Invected (En/Inv, yellow) are not detected in somatic cells (yellow dotted lines) in contact with the ectopic GSCs (pink arrowheads) contrasting with the accumulation of these proteins in the endogenous niche (yellow bracket). (E) The overexpression of bab2 leads to the formation of huge germaria with GSC-like tumors marked by the presence of spectrosome-containing (Hts, yellow) GCs (Vasa, red). (F-F’, H-H’) Projections of all confocal sections, (G-G’, I-I’) projections of 4 adjacent confocal sections. (F-I) Ovaries were immunostained for detection of Dpp-nlsGFP (green) and Bab2 (magenta). (F,G) In the germaria of a control ovary from a female carrying the dpp-nlsGFP transgene (dpp-nlsGFP, C587G > +), GFP is present at high levels in Cap Cells (CCs; yellow brackets), and in prefollicle cells (orange brackets), while low GFP levels are observed in posterior Escort Cells (ECs, F, blue brackets). (F’, G’) Bab2 accumulates at high levels in CCs (yellow brackets), at low levels in more anterior ECs (below yellow brackets through blue bracket region). Barely detectable levels of Bab2 are present in prefollicle cells (orange brackets). Dpp-nlsGFP and Bab2 are therefore largely mutually exclusive except in niche cells. (F-I’) Upon induction of increased levels of Bab2 (dpp-nlsGFP, C587G>UAS-bab2), low ectopic Dpp-nlsGFP signal is present in some ECs (H-H’ green bracket, I-I’ blue arrowheads, and corresponding merges), and higher Dpp-nlsGFP signal is found in more posterior somatic cells (H-H’ below green bracket, I-I’ orange arrowheads, and corresponding merges), whereas this is not the case in the control (dpp-nlsGFP, C587G>+, F-G’ and merges). (J) Graph comparing the mean number of Dpp-nlsGFP+ cells in control and in Bab2-overexpressing germaria. When females raised at 18°C during development were transferred to either 29°C or 31°C for 10 days upon eclosion, a mean of 78.0 Dpp-nlsGFP-positive cells per germarium was obtained with Bab2 overexpression when compared to a mean of 45.7 GFP-positive cells per control germarium. No statistical difference was obtained between shifts at 29°C or 31°C. Values are presented as mean +s.d., p-values are calculated using a two-tailed t-test. n = sample size; **** (p<0.0001).

Similar articles

Cited by

References

    1. Plaks V, Kong N, Werb Z. The cancer stem cell niche: how essential is the niche in regulating stemness of tumor cells? Cell Stem Cell. 2015;16: 225–238. 10.1016/j.stem.2015.02.015 - DOI - PMC - PubMed
    1. Prager BC, Xie Q, Bao S, Rich JN. Cancer Stem Cells: The Architects of the Tumor Ecosystem. Cell Stem Cell. 2019;24: 41–53. 10.1016/j.stem.2018.12.009 - DOI - PMC - PubMed
    1. Zhao Y, Dong Q, Li J, Zhang K, Qin J, Zhao J, et al. Targeting cancer stem cells and their niche: perspectives for future therapeutic targets and strategies. Semin Cancer Biol. 2018;53: 139–155. 10.1016/j.semcancer.2018.08.002 - DOI - PubMed
    1. Ermolaeva M, Neri F, Ori A, Rudolph KL. Cellular and epigenetic drivers of stem cell ageing. Nat Rev Mol Cell Biol. 2018;19: 594–610. 10.1038/s41580-018-0020-3 - DOI - PubMed
    1. Aguado BA, Bushnell GG, Rao SS, Jeruss JS, Shea LD. Engineering the pre-metastatic niche. Nat Biomed Eng. 2017;1 10.1038/s41551-017-0077 - DOI - PMC - PubMed

Publication types

MeSH terms

LinkOut - more resources