. 2020 Nov 5;15(11):e0240597.
doi: 10.1371/journal.pone.0240597. eCollection 2020.

Short-term impact of sediment addition on plants and invertebrates in a southern California salt marsh

Affiliations

Short-term impact of sediment addition on plants and invertebrates in a southern California salt marsh

Kaelin J McAtee et al. PLoS One. .

Abstract

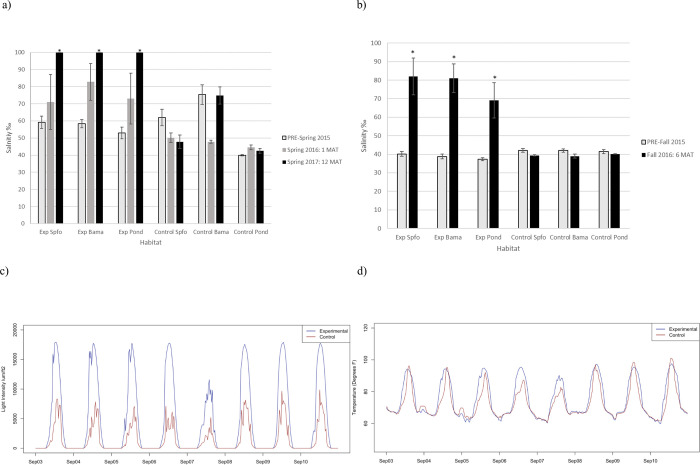
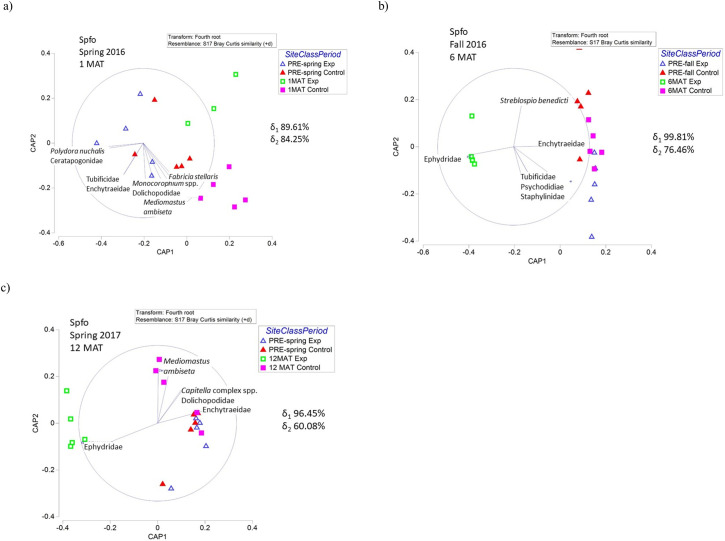
The implementation and monitoring of management strategies is integral to protect coastal marshes from increased inundation and submergence under sea-level rise. Sediment addition is one such strategy in which sediment is added to marshes to raise relative elevations, decrease tidal inundation, and enhance ecosystem processes. This study looked at the plant and invertebrate community responses over 12 months following a sediment addition project on a salt marsh located in an urbanized estuary in southern California, USA. This salt marsh is experiencing local subsidence, is sediment-limited from landscape modifications, has resident protected species, and is at-risk of submergence from sea-level rise. Abiotic measurements, invertebrate cores, and plant parameters were analyzed before and after sediment application in a before-after-control-impact (BACI) design. Immediately following the sediment application, plant cover and invertebrate abundance decreased significantly, with smothering of existing vegetation communities without regrowth, presumably creating resulting harsh abiotic conditions. At six months after the sediment application treatment, Salicornia bigelovii minimally colonized the sediment application area, and Spartina foliosa spread vegetatively from the edges of the marsh; however, at 12 months following sediment application overall plant recovery was still minimal. Community composition of infaunal invertebrates shifted from a dominance of marsh-associated groups like oligochaetes and polychaetes to more terrestrial and more mobile dispersers like insect larvae. In contrast to other studies, such as those with high organic deposition, that showed vegetation and invertebrate community recovery within one year of sediment application, our results indicated a much slower recovery following a sediment addition of 32 cm which resulted in a supratidal elevation with an average of 1.62 m (NAVD88) at our sampling locations. Our results indicate that the site did not recover after one year and that recovery may take longer which illustrates the importance of long-term monitoring to fully understand restoration trajectories and inform adaptive management. Testing and monitoring sea-level rise adaptation strategies like sediment addition for salt marshes is important to prevent the loss of important coastal ecosystems.


Conflict of interest statement

The authors have declared that no competing interests exist.

Figures

Fig 1
Fig 1. Control and sediment application sites within the Seal Beach National Wildlife Refuge shown in relation to the dredge locations in neighboring Anaheim Bay.
Aerial images show the addition of sediment through time from early February 2016 (pre-sediment application) through end of February 2016 (midway through sediment application) until October 2016 (post-sediment application). Image data: Google, Maxar Technologies.
Fig 2
Fig 2
a) Salinity before sediment application (PRE-spring and PRE-fall) and b) after sediment application (1 MAT, 6 MAT, 12 MAT) *indicates a significant change from pre-sediment application levels compared to changes that occurred in the control site. P-values found in S1 Table c) One-week snapshot of light intensity and d) temperature at the control and experimental sites post-sediment application. This one week was selected from a six-week dataset. Habitats are abbreviated as follows: Spartina foliosa-dominated (Spfo), Batis maritima-dominated (Bama), and ponds or standing water (Pond). Exp is the experimental sediment application area/site. MAT is months after treatment.
Fig 3
Fig 3. Percent silt and clay in sediment cores collected through time from the control and experimental sites at SBNWR to document key changes.
Data are presented from before sediment application (PRE-fall), during sediment application (February 2016) and after sediment application (1 MAT, 12 MAT12MAT).
Fig 4
Fig 4. Experimental site photos through time taken from the same location at northeast end of the experimental site.
a) Marsh vegetation before sediment application (PRE-spring), b) marsh at 1 MAT, c) Salicornia bigelovii beginning to grow in sediment application area at 12 MAT, d) Spartina foliosa growing via vegetative spread from vegetated buffer zone (12 MAT). MAT is months after treatment.
Fig 5
Fig 5
Total plant cover in a) PRE-spring compared to 1 MAT, 12 MAT and b) PRE-fall as compared to 6 MAT. Species richness c) PRE-spring compared to 1 MAT, 12 MAT and d) PRE-fall as compared to 6 MAT. *indicates a significant change from pre-sediment application levels compared to changes that occurred in the control site. P-values found in S4–S6 Tables. Habitats are abbreviated as follows: Spartina foliosa-dominated (Spfo), Batis maritima-dominated (Bama), and ponds or standing water (Pond). Exp is the experimental sediment application area/site. MAT is months after treatment.
Fig 6
Fig 6
Epifauna invertebrate abundance a) PRE-spring compared to 1 MAT, 12 MAT and b) PRE-fall as compared to 6 MAT. Infauna invertebrate abundance c) PRE-spring compared to 1 MAT, 12 MAT and d) PRE-fall as compared to 6 MAT. *indicates a significant change from pre-sediment application levels compared to changes that occurred in the control site. P-values found in S7–S10 Tables. Habitats are abbreviated as follows: Spartina foliosa-dominated (Spfo), Batis maritima-dominated (Bama), and ponds or standing water (Pond). Exp is the experimental sediment application area/site. MAT is months after treatment.
Fig 7
Fig 7
Infaunal invertebrate CAP plots showing the change in community composition of invertebrates for each sampling season (a,b,c) in Spfo habitats compared to pre-sediment application data. Canonical correlation values (δ) for each axis are reported to show strength of the association between the multivariate data cloud and the hypothesized group differences. Habitats are abbreviated as follows: Spartina foliosa-dominated (Spfo), Batis maritima-dominated (Bama), and ponds or standing water (Pond). Exp is the experimental sediment application area/site. MAT is months after treatment.
Fig 8
Fig 8
Infaunal invertebrate CAP plots showing the change in community composition of invertebrates for each sampling season (a,b,c) in Bama habitats compared to pre-sediment application data. Canonical correlation values (δ) for each axis are reported to show strength of the association between the multivariate data cloud and the hypothesized group differences. Habitats are abbreviated as follows: Spartina foliosa-dominated (Spfo), Batis maritima-dominated (Bama), and ponds or standing water (Pond). Exp is the experimental sediment application area/site. MAT is months after treatment.
Fig 9
Fig 9
Infaunal invertebrate CAP plots showing the change in community composition of invertebrates for each sampling season (a,b,c) in Pond habitats compared to pre-sediment application data. Canonical correlation values (δ) for each axis are reported to show strength of the association between the multivariate data cloud and the hypothesized group differences. Habitats are abbreviated as follows: Spartina foliosa-dominated (Spfo), Batis maritima-dominated (Bama), and ponds or standing water (Pond). Exp is the experimental sediment application area/site. MAT is months after treatment.

References

    1. Constanza R. The value of ecosystem services. Ecol Econ. 1998;25: 1–2.
    1. Zedler JB, Kercher S. Wetland resources: Status, trends, ecosystem services, and restorability. Annu Rev Environ Resour. 2005;30: 39–74. 10.1146/annurev.energy.30.050504.144248 - DOI
    1. Mitsch WJ, Gosselink J. Wetlands. Hoboken, NJ: Wiley; 2007.
    1. Cahoon DR, Day JW. Chapter 3: Global Climate Change and Sea-level Rise: Estimating the Potential for Submergence of Coastal Wetlands Vertical Buildup of the Marsh Surface Vulnerability Coast Wetl Southeast United States Biol Sci Rep 1998–0002. Lafayette, LA; 1998.
    1. Spencer T, Schuerch M, Nicholls RJ, Hinkel J, Lincke D, Vafeidis AT, et al. Global coastal wetland change under sea-level rise and related stresses: The DIVA Wetland Change Model. 2016;139: 15–30.

Publication types

MeSH terms