. 2020 Nov 5;15(11):e0241818.
doi: 10.1371/journal.pone.0241818. eCollection 2020.

Caffeine reverses the unconsciousness produced by light anesthesia in the continued presence of isoflurane in rats

Affiliations

Caffeine reverses the unconsciousness produced by light anesthesia in the continued presence of isoflurane in rats

Aaron P Fox et al. PLoS One. .

Abstract

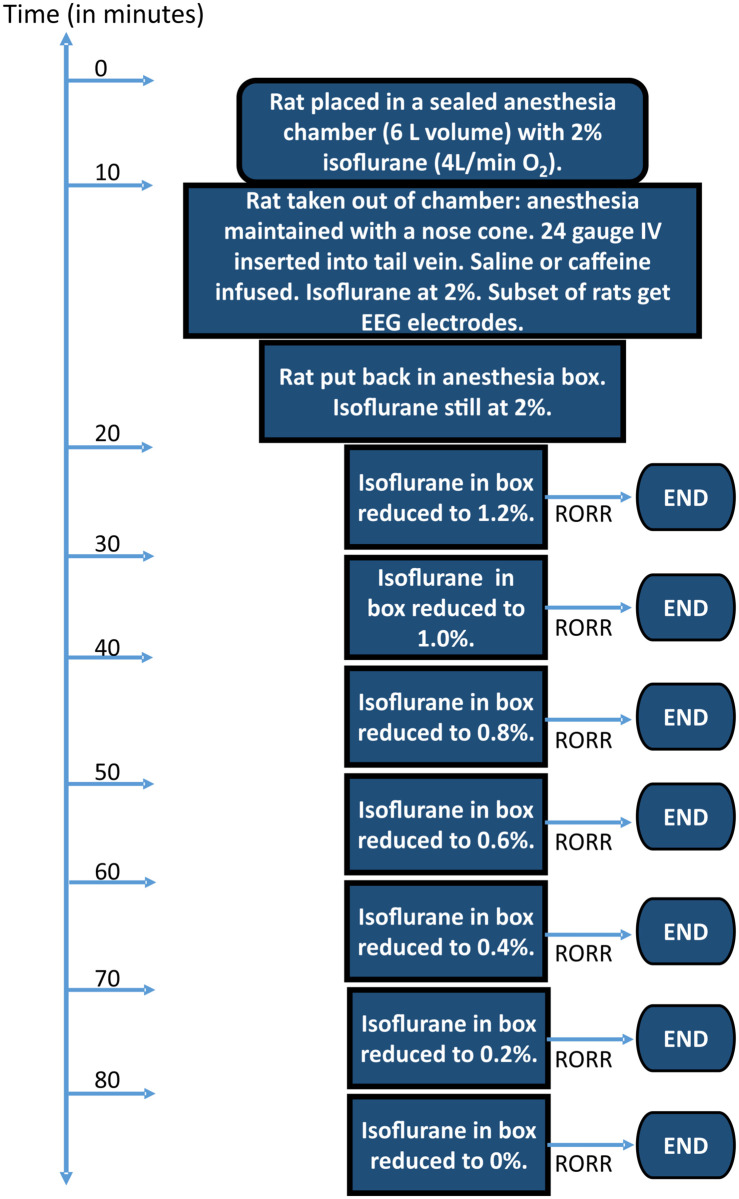
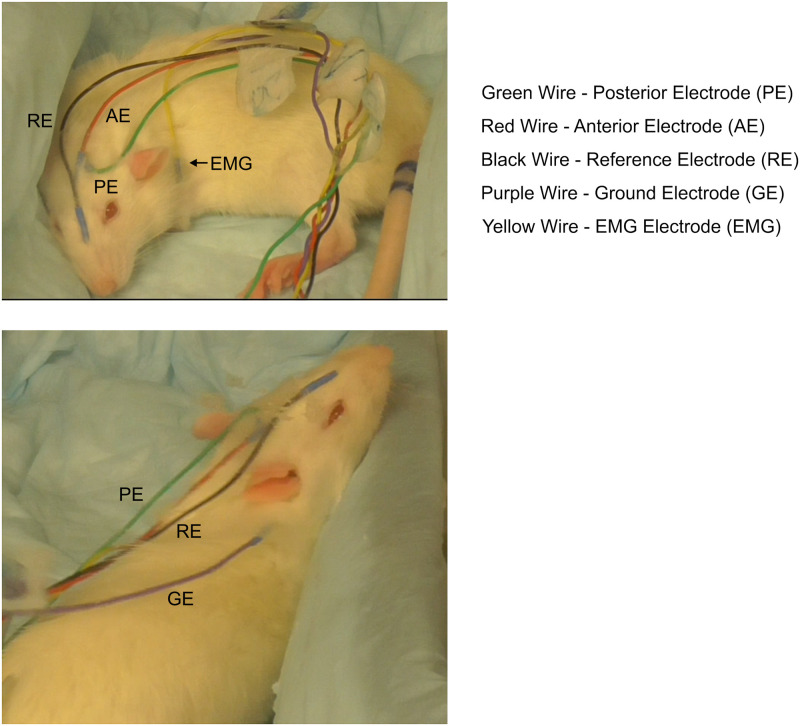
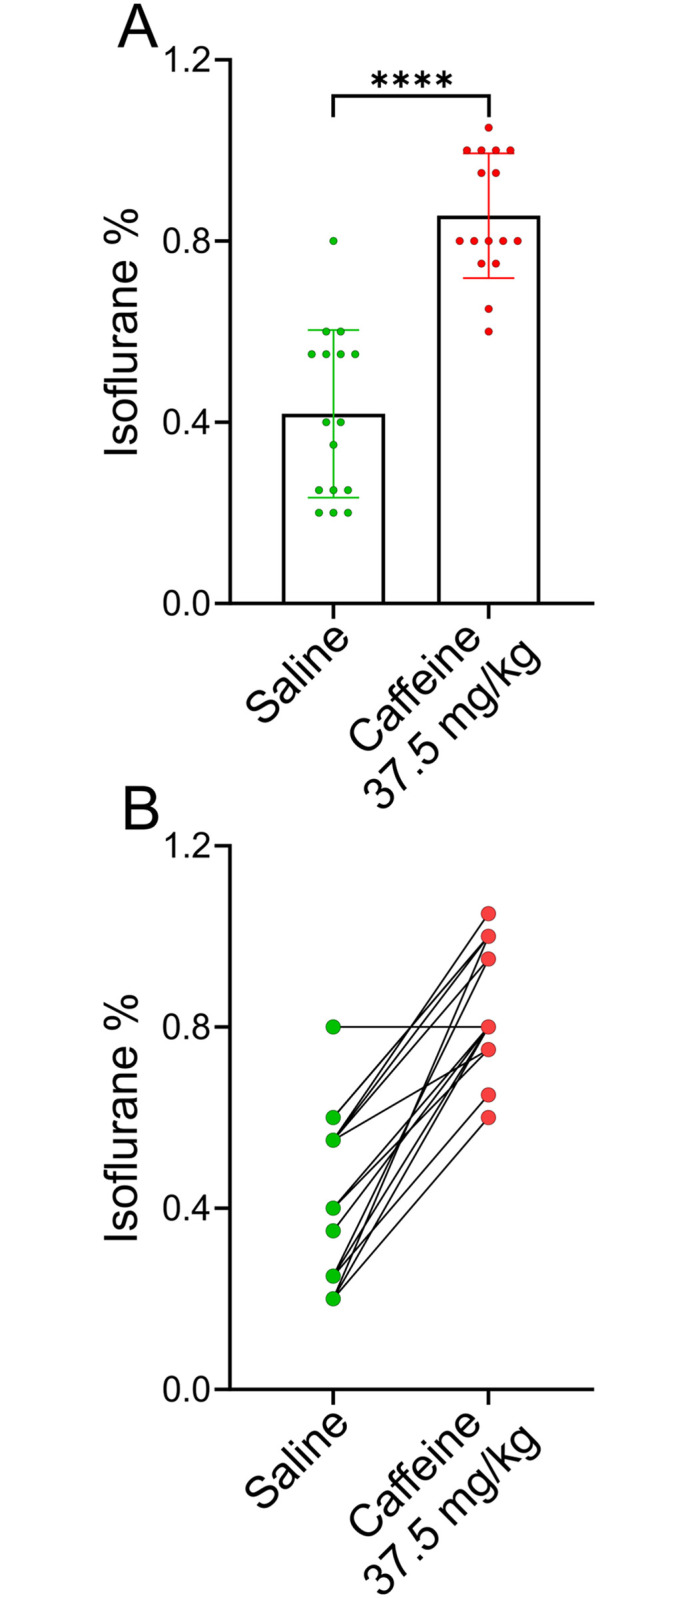
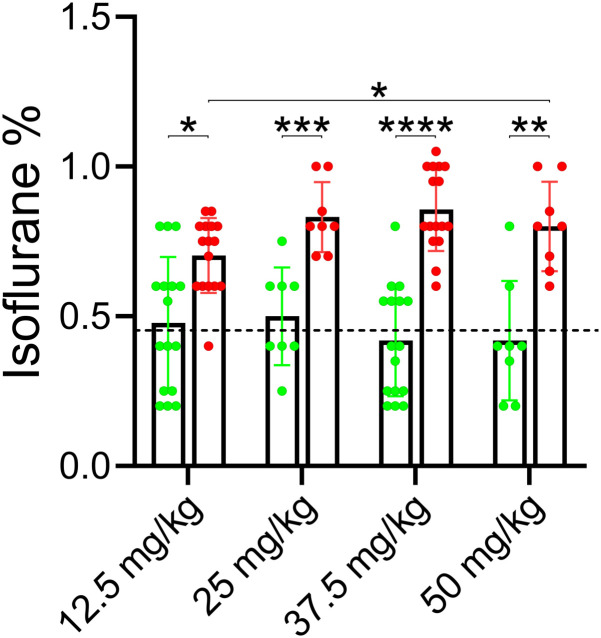
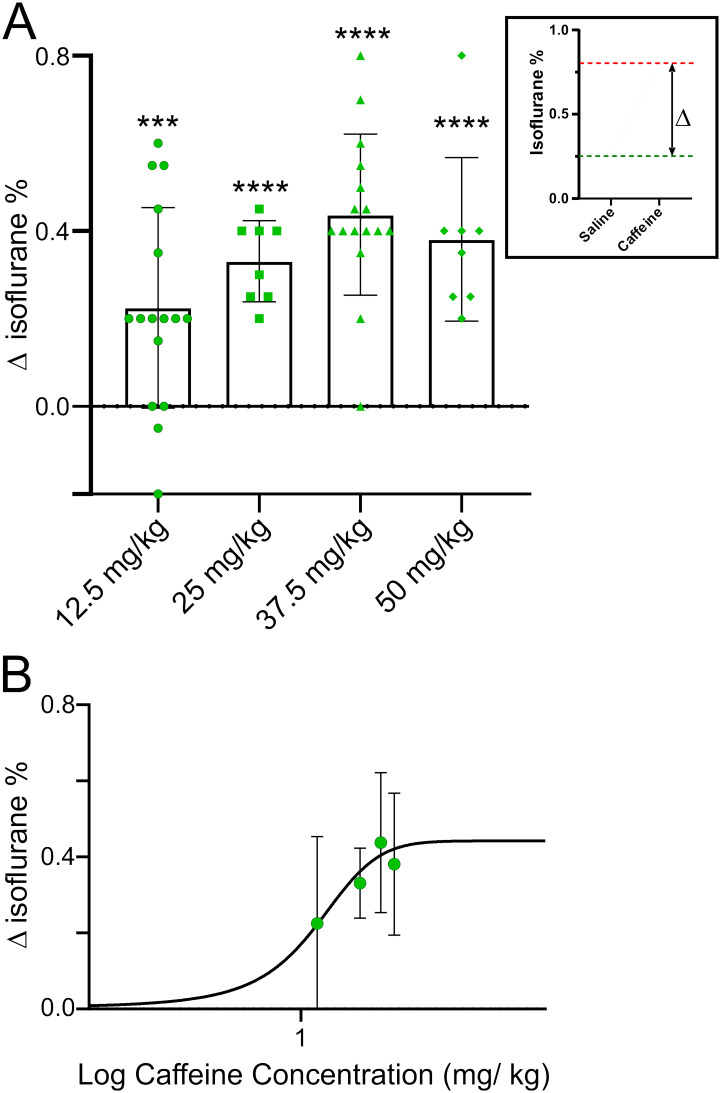
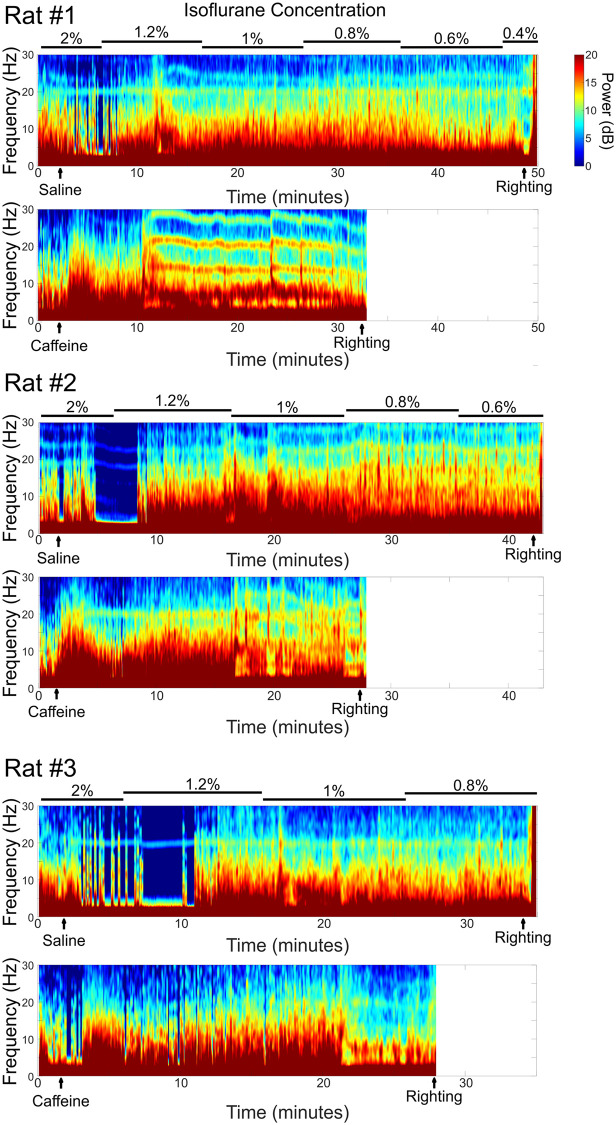
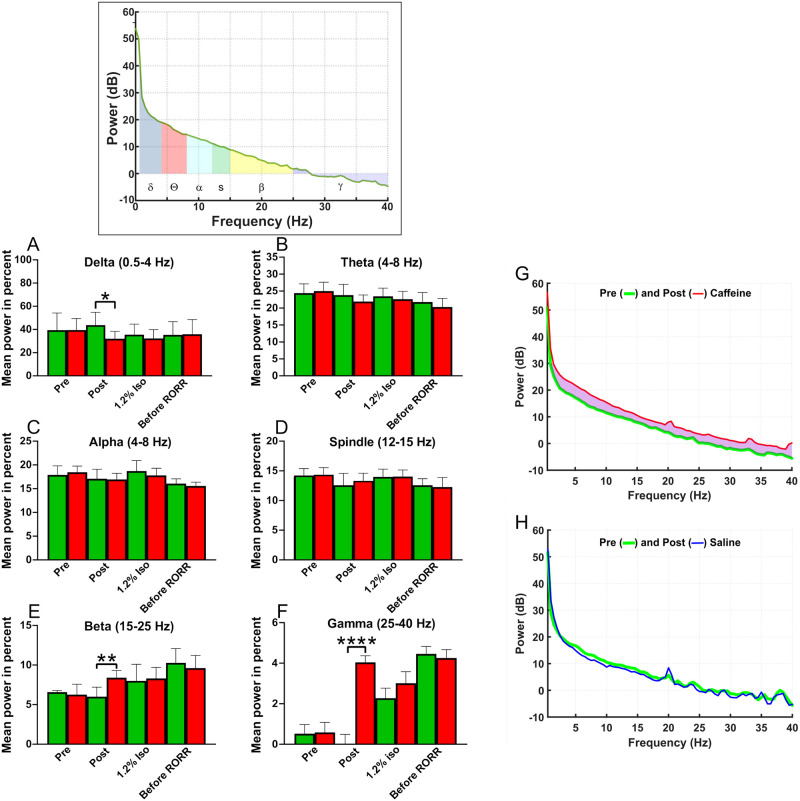
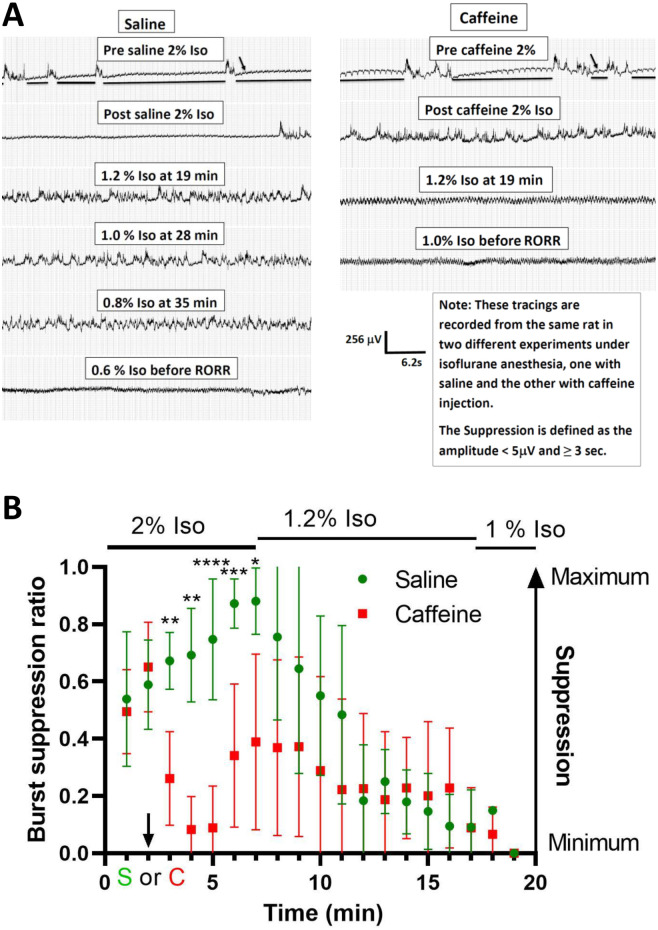
Currently no drugs are employed clinically to reverse the unconsciousness induced by general anesthetics. Our previous studies showed that caffeine, when given near the end of an anesthesia session, accelerated emergence from isoflurane anesthesia, likely caused by caffeine's ability to elevate intracellular cAMP levels and to block adenosine receptors. These earlier studies showed that caffeine did not rouse either rats or humans from deep anesthesia (≥ 1 minimum alveolar concentration, MAC). In this current crossover study, we examined whether caffeine reversed the unconsciousness produced by light anesthesia (< 1 MAC) in the continued presence of isoflurane. The primary endpoint of this study was to measure isoflurane levels at the time of recovery of righting reflex, which was a proxy for consciousness. Rats were deeply anesthetized with 2% isoflurane (~1.5 MAC) for 20 minutes. Subsequently, isoflurane was reduced to 1.2% for 10 minutes, then by 0.2% every 10 min; animals were monitored until the recovery of righting reflex occurred, in the continued presence of isoflurane. Respiration rate, heart rate and electroencephalogram (EEG) were monitored. Our results show that caffeine-treated rats recovered their righting reflex at a significantly higher inspired isoflurane concentration, corresponding to light anesthesia, than the same rats treated with saline (control). Respiration rate and heart rate increased initially after caffeine injection but were then unchanged for the rest of the anesthesia session. Deep anesthesia is correlated with burst suppression in EEG recordings. Our data showed that caffeine transiently reduced the burst suppression time produced by deep anesthesia, suggesting that caffeine altered neuronal circuit function but not to a point where it caused arousal. In contrast, under light anesthesia, caffeine shifted the EEG power to high frequency beta and gamma bands. These data suggest that caffeine may represent a clinically viable drug to reverse the unconsciousness produced by light anesthesia.


Conflict of interest statement

The authors have declared that no competing interests exist.

Figures

Fig 1
Fig 1. Schematic of experimental design.
Note that the time bar is not to scale.
Fig 2
Fig 2. Photograph showing placement of EEG electrodes.
The two photographs of the same rat were obtained as the animal was emerging from anesthesia. Two channels of EEG signals analyzed in this study were the difference between the reference electrode (Black wire) labeled RE and either the anterior electrode (Red wire) labeled AE or the posterior electrode (Green wire) labeled PE. Muscle movements were obtained from the EMG electrode (Yellow wire) labeled EMG. The ground electrode was labeled as GE (Purple wire).
Fig 3
Fig 3. Caffeine-treated rats recovered their righting reflex at a significantly higher isoflurane concentration than did the same rats when treated with saline.
A, A group of 16 adult female rats were anesthetized and then injected with either saline () or caffeine () (37.5 mg/ kg) on two different days. The protocol for determining the isoflurane concentration where rats recovered their righting reflex is described in the Methods section. The order of caffeine or saline was randomized, with 8 rats receiving caffeine on the first anesthesia session and 8 rats receiving saline. The caffeine-treated rats recovered their righting reflex at 0.86 ± 0.14% isoflurane (mean ± SD), while the saline-treated rats recovered their righting reflex at 0.42 ± 0.19% isoflurane, p < 0.0001, n = 16 (paired T-test). B, plots the isoflurane concentrations recorded at RORR for all 16 rats. Symbols in green represent the isoflurane levels recorded at RORR for the saline session, while those in red represent the caffeine session.
Fig 4
Fig 4. Increasing the caffeine concentration infused into rats caused the animals to emerge from anesthesia at a higher isoflurane concentration.
The protocol employed for this experiment was identical to that shown in Fig 1. Four different caffeine concentrations were tested, each one in a separate group of rats. Caffeine and saline were injected in alternate anesthesia sessions for each group. Group 1, 16 rats, were tested with 12.5 mg/ kg caffeine. Group 2, 8 rats, were tested with 25 mg/ kg caffeine. Group 3, 16 rats, were tested with 25 mg/ kg caffeine. Group 4, 8 rats, were tested with 50 mg/ kg caffeine. The isoflurane levels at RORR were recorded and then averaged for each group of rats and then plotted as a bar chart (± SD). The individual isoflurane values at RORR are superimposed on top. The data was analyzed with a mixed-effects ANOVA, without assuming sphericity and using Tukey’s multiple comparison test. Significant differences between groups is shown graphically with a line with stars superimposed representing the level of significance. Group 1 saline vs group 1 caffeine, p = 0.02. Group 2 saline vs group 2 caffeine, p = 0.0003. Group 3 saline vs group 3 caffeine, p < 0.0001. Group 4 saline vs group 4 caffeine, p = 0.0086. For emergence in caffeine the following comparisons were observed. Group 1 caffeine vs group 2 caffeine, p = 0.5. Group 1 caffeine vs group 3 caffeine, p = 0.0539. Group 1 vs group 4, p = 0.04. Group 2 caffeine vs group 3 caffeine, p = 0.9985. Group 2 caffeine vs group 4 caffeine, p = 0.9998. Group 3 caffeine vs group 4 caffeine, p = 0.9895. To examine reproducibility of the data the following comparisons were made: Group 1 saline vs group 2 saline, p = 0.9995. Group 1 saline vs group 3 saline, p = 0.9911. Group 1 saline vs group 4 saline, p = 0.9985. Group 2 saline vs group 3 saline, p = 0.9809. Group 2 saline vs group 4 saline, p = 0.9903. Group 3 saline vs group 4 saline, p > 0.9999.
Fig 5
Fig 5. Dose-response relationship for recovery of righting reflex as a function of caffeine concentration.
The data from Fig 4 was used to construct this figure. A, inset shows data from a single rat infused with either saline or caffeine during different anesthesia sessions. This rat emerged from anesthesia at ~0.25% isoflurane when infused with saline (green line) and ~0.8% isoflurane when infused with caffeine (37.5 mg/kg) (red line). The Δ in the inset is the difference in the “waking” isoflurane concentration after caffeine compared to saline. The main figure plots Δ in emergence for the four different caffeine concentrations shown in Fig 4. B, A dose response curve was fit to the data shown in A. In this graph the slope of the curve was not constrained. The top of the curve was at a Δ isoflurane of 0.44% and the EC50 was at 12.42 mg/ kg caffeine.
Fig 6
Fig 6. Caffeine reversed light anesthesia equally well in both male and female rats.
Two small groups, n = 4, of male and female rats were anesthetized using the protocol described in Fig 1. Both groups were anesthetized twice, once with a saline infusion and once with caffeine (37.5 mg/ kg). The Δ in isoflurane between caffeine and saline was ~0.4% isoflurane. Using a 2-way ANOVA with multiple comparisons and Tukey’s multiple comparison test, no significant differences between male and female rats were found. Female saline vs. female caffeine, p = 0.0081. Male saline vs. male caffeine, p = 0.0097. Female saline vs male saline, p = 0.1. Female caffeine vs male caffeine, p = 0.15. Isoflurane RORR concentrations in saline treated males: 0.5, 0.55, 0.6, 0.55. Isoflurane RORR concentrations in caffeine treated males: 0.75, 1.05, 1, 0.95. Δ for males: 0.25, 0.5, 0.4, 0.4. Isoflurane RORR concentrations in saline treated females: 0.25, 0.4, 0.35, 0.55. Isoflurane RORR concentrations in caffeine treated females: 0.65, 0.75, 0.8, 1.0. Δ for females: 0.4, 0.35, 0.45, 0.45.
Fig 7
Fig 7. Representative spectrograms from three different rats.
For each rat the top trace shows the saline control injection, while the bottom trace shows the caffeine spectrogram. Scalp EEG electrodes were placed after rats were anesthetized under 2% isoflurane for at least 10 minutes. Spectrograms are shown starting 2 minutes before saline or caffeine (37.5 mg/kg) injection until the recovery of righting reflex (as shown in the artifacts caused by the motion). These spectrograms demonstrated that caffeine injection elicited significant higher frequency EEG activity compared to saline controls even though the injection took place at 2% isoflurane. Caffeine reduced the burst suppression caused by higher concentrations of isoflurane immediately after caffeine injection. As isoflurane concentrations were reduced, caffeine caused an elevation of high frequency activity earlier than saline.
Fig 8
Fig 8. Caffeine’s effects were most apparent in high frequency bands of power spectra.
The inset plots a pre infusion power spectrum computed from a 2-minute epoch under 2% isoflurane (box at top of figure). Data from 2-minute epochs were divided into 512-point segments, analyzed and averaged. Each power spectrum was divided into component power bands as shown by the different colors and then analyzed. A-F) Data from 6 rats was averaged, with green bars from saline-infused (green) rats while red bars are from caffeine-infused (red) rats. Each rat was employed for both anesthesia sessions (caffeine and saline). Normalized power was calculated as the fraction of a specific frequency power, including delta (0.5–4 Hz), theta (4–8 Hz), alpha (8–12 Hz), spindle (12–15 Hz), beta (15–25 Hz) and gamma (25–40 Hz), divided by the total power over all frequency bands from 0.5–40 Hz. The normalized data was averaged between rats and then plotted as “Mean power in percent”. Power spectra were obtained from just before caffeine or saline infusion (pre), just after caffeine or saline infusion (post), during 1.2% isoflurane and before RORR. Comparisons were made between the saline and caffeine experiments at those 4 time periods. A repeated-measures ANOVA model was fit with condition (saline vs caffeine) and time as repeated factors. The normalized delta, beta and gamma bands between saline and caffeine experiment at the post infusion point were significant at *p<0.05 for delta, **p<0.01 for beta, ****p<0.0001 for gamma (n = 6). Theta, alpha and spindle bands did not reach significant difference between saline and caffeine experiments at any time points. G-H plot averaged power spectra from six rats, before (green line) and after caffeine infusion (red line) in caffeine session (G), or before (green line) and after saline infusion (blue line) in saline session (H), during 2% isoflurane. Saline did not alter the power spectrum in any measurable manner, while caffeine altered power at different frequencies, as indicated by the light purple shaded area between the green and red lines. This change in the power spectrum was transient and disappeared within 5 minutes.
Fig 9
Fig 9. Caffeine reduced burst suppression caused by deep anesthesia (≥ 1.2% Isoflurane).
In A, a representative raw EEGs from a rat in saline and caffeine experiments. Isoflurane at 2% caused significant burst suppression. Caffeine at 37.5 mg/kg reduced the burst suppression caused by deep anesthesia. Caffeine also led to the shift to high frequency in EGG at a higher concentration of isoflurane. The EEG patterns before RORR were similar in both saline and caffeine experiments. The horizontal lines represent examples of suppression. The small arrows (↓) point to 60 cycles on the EEG. The horizontal lines represent examples of suppression. In B, burst suppression ratio (BSR) was calculated. Each epoch length was 1 minute. BSR of 1 indicated no electrical activity while a ratio of 0 showed no suppression. The graph started 2 minutes before caffeine or saline injection and ended after the burst suppression disappeared. The chart represents an averaged number of 6 rats in both saline and caffeine (37.5 mg/kg) experiments. Caffeine reduced the BSR after the injection. The burst suppression was also reduced as isoflurane was dialed down in saline experiments. The burst suppression ratio was calculated with the formula, BSR = (total time of suppression/epoch length) x 100%. Two members of our group performed this calculation independently. ↓ represents the time of saline (S) or caffeine (C) injection. Comparisons were made at each time point between saline and caffeine experiments. A repeated-measures ANOVA model was fit with condition (saline vs caffeine) and time as repeated factors. There was evidence for a time by condition interaction (Green-Geisser adjusted p = 0.0003). Subsequently saline versus caffeine comparisons (Bonerroni adjusted) gave the following: no significant difference from times (t) of 2 min or less; t = 3 (**p<0.01), t = 4 (**p<0.01), t = 5 (****p<0.0001), t = 6 (***p<0.001), t = 7 (*p<0.05) and no significant difference from 8 to 19 min (n = 6).

Similar articles

Cited by

References

    1. Brown EN, Lydic R, Schiff ND. Mechanisms of Disease: General Anesthesia, Sleep, and Coma. New England Journal of Medicine. 2010;363(27):2638–50. - PMC - PubMed
    1. Solt K, Cotten JF, Cimenser A, Wong KFK, Chemali JJ, Brown EN. Methylphenidate Actively Induces Emergence from General Anesthesia. Anesthesiology. 2011;115(4):791–803. 10.1097/ALN.0b013e31822e92e5 - DOI - PMC - PubMed
    1. Cohn ML, Cohn M, Taylor FH, Scattaregia F. Direct Effect of Dibutyryl Cyclic-Amp on Duration of Narcosis Induced by Sedative, Hypnotic, Tranquilizer and Anesthetic Drugs in Rat. Neuropharmacology. 1975;14(7):483–7. - PubMed
    1. Alkire MT, Asher CD, Franciscus AM, Hahn EL. Thalamic microinfusion of antibody to a voltage-gated potassium channel restores consciousness during anesthesia. Anesthesiology. 2009;110(4):766–73. 10.1097/aln.0b013e31819c461c . - DOI - PubMed
    1. Hudetz AG, Wood JD, Kampine JP. Cholinergic reversal of isoflurane anesthesia in rats as measured by cross-approximate entropy of the electroencephalogram. Anesthesiology. 2003;99(5):1125–31. 10.1097/00000542-200311000-00019 . - DOI - PubMed

Publication types