. 2021 Mar;51(3):626-633.
doi: 10.1002/eji.202048739. Epub 2020 Nov 25.

The association of Epstein-Barr virus infection with CXCR3+ B-cell development in multiple sclerosis: impact of immunotherapies

Affiliations

The association of Epstein-Barr virus infection with CXCR3+ B-cell development in multiple sclerosis: impact of immunotherapies

Jamie van Langelaar et al. Eur J Immunol. 2021 Mar.

Abstract

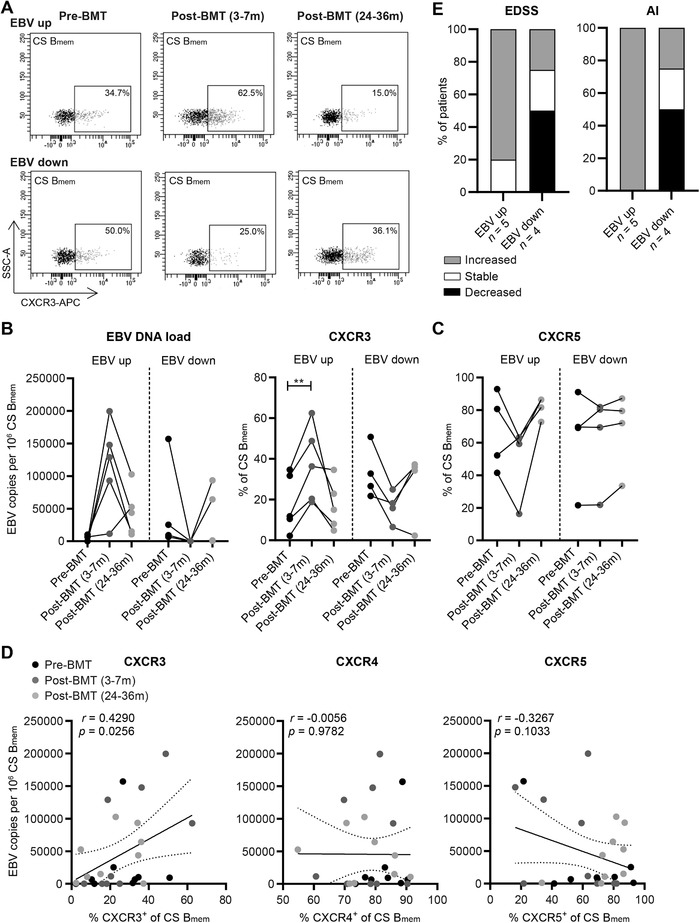
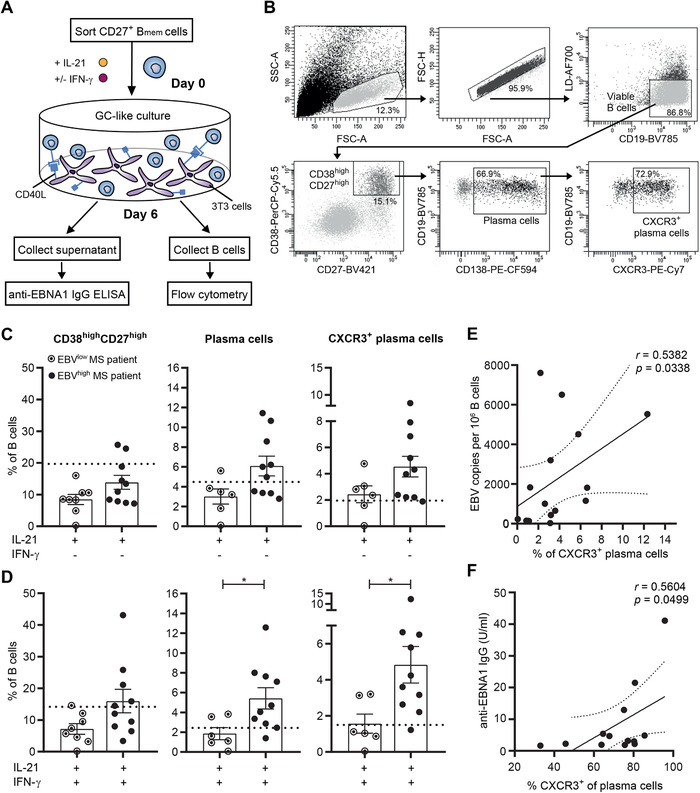
Epstein-Barr virus (EBV) infection of B cells is associated with increased multiple sclerosis (MS) susceptibility. Recently, we found that CXCR3-expressing B cells preferentially infiltrate the CNS of MS patients. In chronic virus-infected mice, these types of B cells are sustained and show increased antiviral responsiveness. How EBV persistence in B cells influences their development remains unclear. First, we analyzed ex vivo B-cell subsets from MS patients who received autologous bone marrow transplantation (n = 9), which is often accompanied by EBV reactivation. The frequencies of nonclass-switched and class-switched memory B cells were reduced at 3-7 months, while only class-switched B cells returned back to baseline at 24-36 months posttransplantation. At these time points, EBV DNA load positively correlated to the frequency of CXCR3+ , and not CXCR4+ or CXCR5+ , class-switched B cells. Second, for CXCR3+ memory B cells trapped within the blood of MS patients treated with natalizumab (anti-VLA-4 antibody n = 15), latent EBV infection corresponded to enhanced in vitro formation of anti-EBNA1 IgG-secreting plasma cells under GC-like conditions. These findings imply that EBV persistence in B cells potentiates brain-homing and antibody-producing CXCR3+ subsets in MS.

Keywords: EBV; memory B cells; multiple sclerosis; natalizumab; plasma cells.


Conflict of interest statement

J.S. received speaker/consultancy fee from Biogen, Merck, Novartis, and Sanofi‐Genzyme. All other authors have no commercial or financial conflicts of interest.

Figures

Figure 1
Figure 1
Reconstitution and EBV load of B‐cell subsets in the blood of autologous BMT‐treated MS patients. (A) Flow cytometry gating strategy used to define transitional (CD38highCD27; Btrans), naive mature (CD27 IgM+; Bnm), nonclass‐switched memory (CD27+IgM+; NCS Bmem), and class‐switched memory (IgMIgD; class‐switched [CS] Bmem) within blood CD19+ B cells. (B) Quantification of B‐cell subset frequencies in the blood of MS patients before (black dots) and both 3–7 months (dark gray dots) and 24–36 months (light gray dots) after receiving autologous BMT (paired samples; n = 9; Supporting Information Table S1). (C) EBV DNA load in sorted Bnm, NCS Bmem, and CS Bmem cells before and both 3–7 and 24–36 months after BMT (n = 9; copies/1 × 106 cells). Flow cytometry data were measured and B cell subsets were sorted in five independent experiments, with paired time points for one to two patients per experiment. EBV DNA load was determined by qPCR in three independent experiments, with paired time points for three to five patients per experiment. Data are presented as the mean ± SEM. **p < 0.01 and *p < 0.05. The p values in (B) were calculated by repeated measures one‐way ANOVA with Tukey's post hoc test.
Figure 2
Figure 2
The association between EBV load and chemokine receptor expression in class‐switched B cells of BMT‐treated MS patients. (A) Representative flow cytometry plots of CXCR3‐expressing class‐switched (CS) Bmem cells from an MS patient before and both 3–7 months and 24–36 months after autologous BMT. EBV copy numbers measured by qPCR and frequencies of CXCR3+ (B) as well as CXCR5+ (C) fractions were determined for CS Bmem cells of nine BMT‐treated MS patients. (D) EBV copy numbers were correlated to CXCR3+, CXCR4+, and CXCR5+ fractions of CS Bmem cells. Data were collected in the same number of experiments as depicted in Figure 1. (E) Expanded disability status scale (EDSS) and ambulatory index (AI) changes after BMT treatment (∆ pre‐ vs. 36 months post‐BMT) for patients showing increased (n = 5) and decreased (n = 4) memory B‐cell EBV loads and measured by questionnaires. **p < 0.01. The p values were calculated by repeated measures one‐way ANOVA with Tukey's post hoc test (B and C) and correlation coefficient by Pearson rank (D).
Figure 3
Figure 3
In vitro plasma cell formation of memory B cells from NTZ‐treated MS patients with different B‐cell EBV load. (A) Experimental setup of the GC‐like memory B‐cell differentiation assay. CD27+ memory B cells (Bmem) were sorted from different blood samples of a total of 15 NTZ‐treated MS patients (Supporting Information Table S1) and cultured under IL‐21‐/CD40L‐inducing (GC‐like) conditions for 6 days. (B) Representative flow cytometry gating strategy for the analysis of in vitro differentiated plasma cells within viable CD19+ cells after 6 days of culturing. Plasma cell development was analyzed for NTZ‐treated MS patients with high and low B‐cell EBV load (n = 6–10) under conditions with and without IFN‐γ (C and D). Dotted lines indicate the mean frequencies of each population analyzed for simultaneous in vitro cultures with memory B cells of six age‐ and gender‐matched healthy controls. In vitro cultures and flow cytometry data were collected in six independent experiments, with one to two EBVhigh and one to two EBVlow MS patients, as well as one healthy control per experiment. (E) Correlation between EBV copy numbers and fractions of in vitro induced CXCR3+ plasma cells. (F) Correlation between anti‐EBNA1 IgG secretion and CXCR3 surface expression by in vitro differentiated plasma cells. Anti‐EBNA1 IgG was measured in four independent experiments with two to six patient samples per experiment and each sample was measured in duplicate. Data are presented as the mean ± SEM. *p < 0.05. The p values were calculated by Mann–Whitney U (D) and correlation coefficients by Spearman rank (E and F) tests.

References

    1. Michel, L. , Touil, H. , Pikor, N. B. , Gommerman, J. L. , Prat, A. and Bar‐Or, A. , B cells in the multiple sclerosis central nervous system: trafficking and contribution to CNS‐compartmentalized inflammation. Front. Immunol. 2015. 10.3389/fimmu.2015.00636. - DOI - PMC - PubMed
    1. Lünemann, J. D. , Kamradt, T. , Martin, R. and Münz, C. , Epstein‐Barr virus: environmental trigger of multiple sclerosis? J. Virol. 2007. 81: 6777–6784. - PMC - PubMed
    1. Pender, M. P. , The essential role of Epstein‐Barr virus in the pathogenesis of multiple sclerosis. Neuroscientist 2011. 17: 351–367. - PMC - PubMed
    1. Thorley‐Lawson, D. A. , EBV Persistence–introducing the virus. Curr. Top. Microbiol. Immunol. 2015. 390: 151–209. - PMC - PubMed
    1. Pender, M. P. , Csurhes, P. A. , Burrows, J. M. and Burrows, S. R. , Defective T‐cell control of Epstein‐Barr virus infection in multiple sclerosis. Clin. Trans. Immunol. 2017. 6: e126. - PMC - PubMed

Publication types