. 2020 Nov 19;80(4):621-632.e6.
doi: 10.1016/j.molcel.2020.10.013. Epub 2020 Nov 4.

Drp1 Tubulates the ER in a GTPase-Independent Manner

Affiliations

Drp1 Tubulates the ER in a GTPase-Independent Manner

Yoshihiro Adachi et al. Mol Cell. .

Abstract

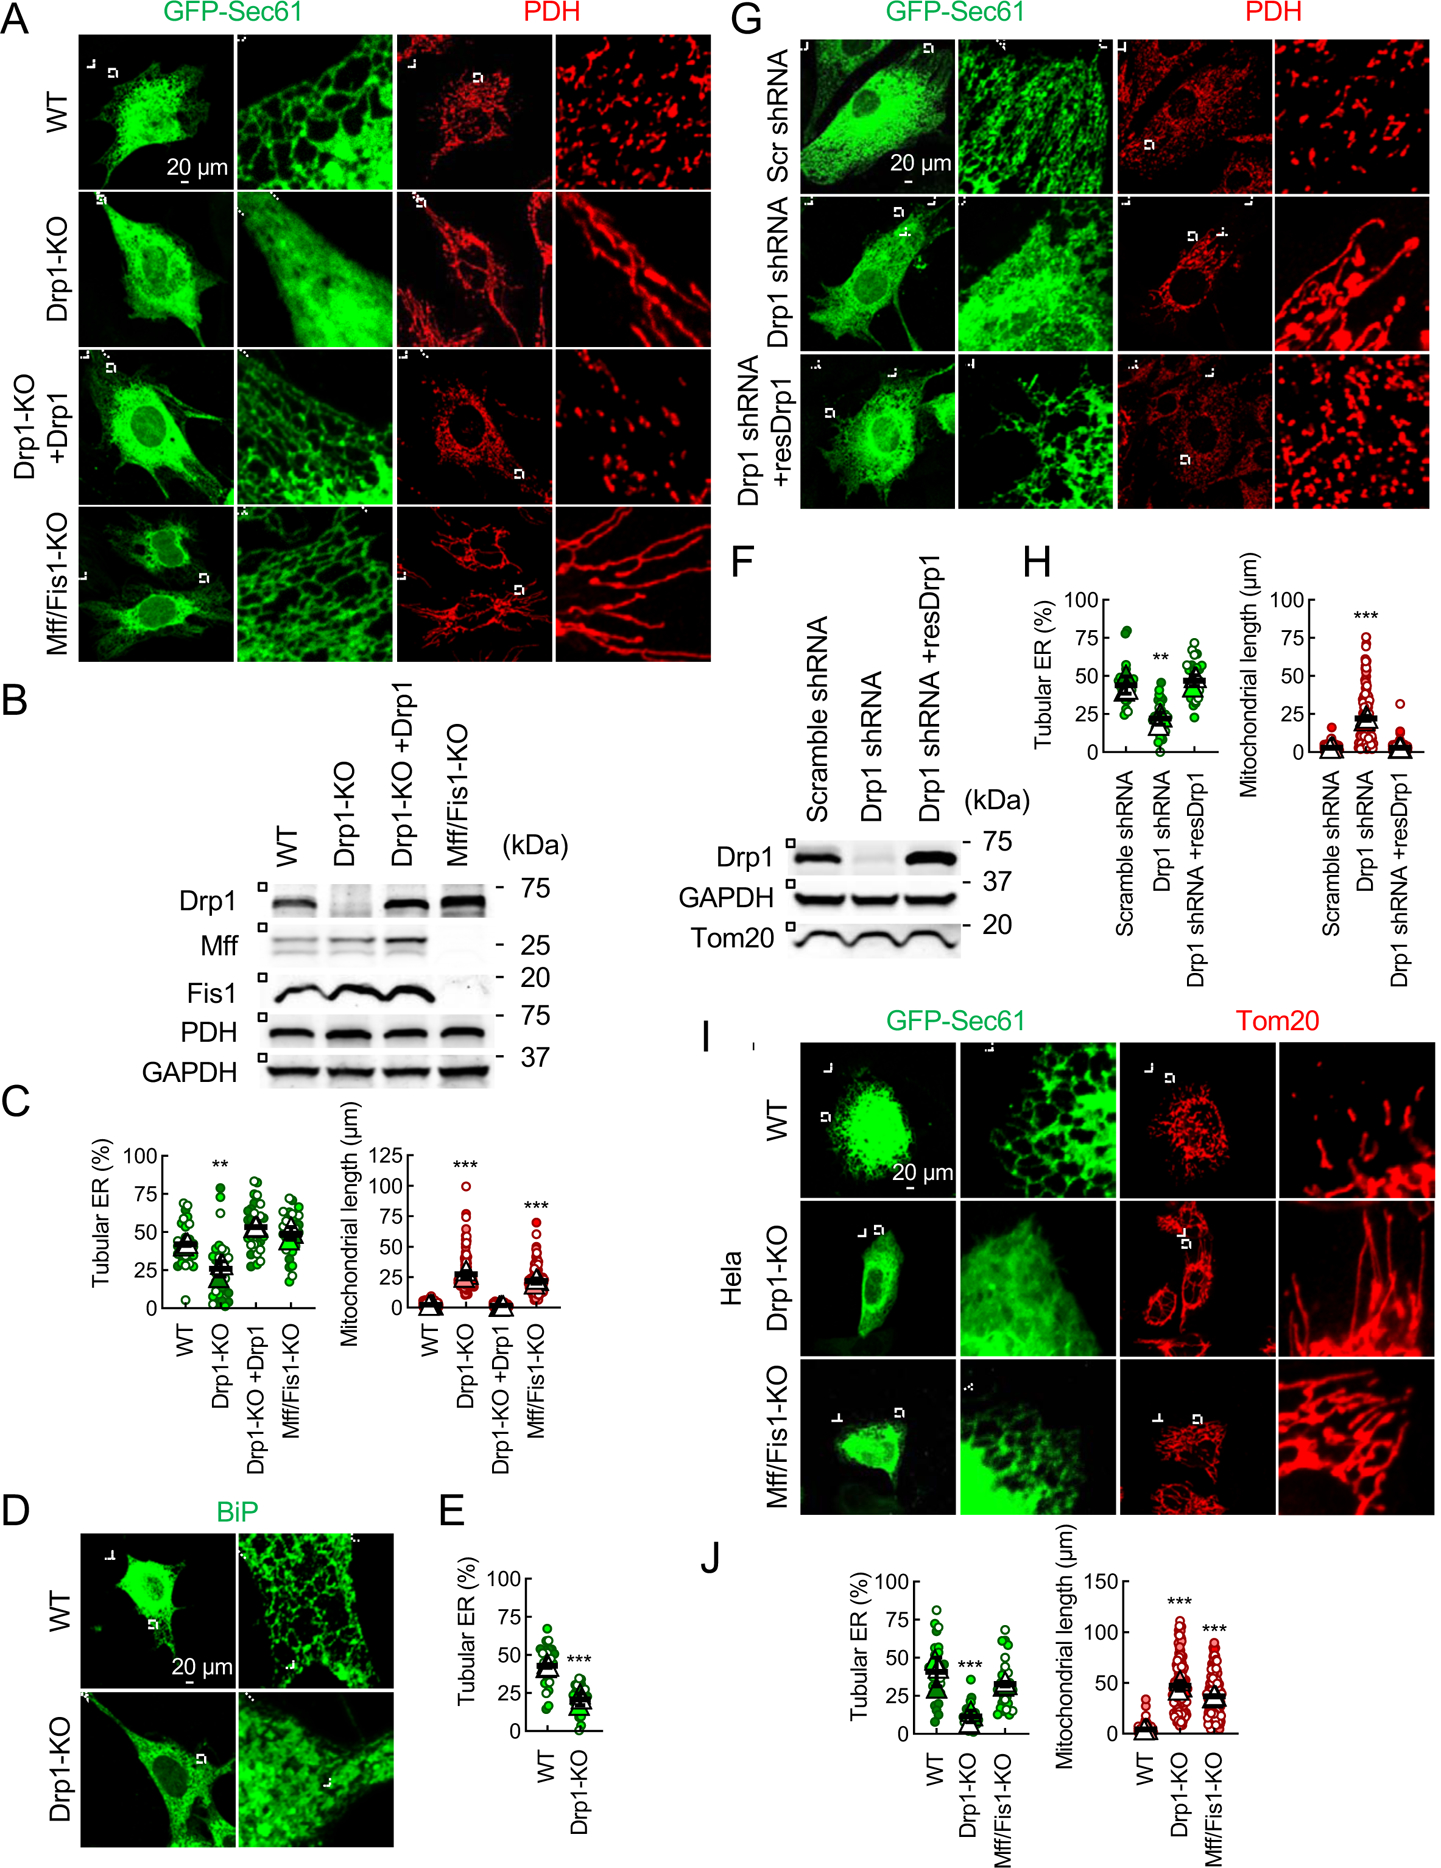
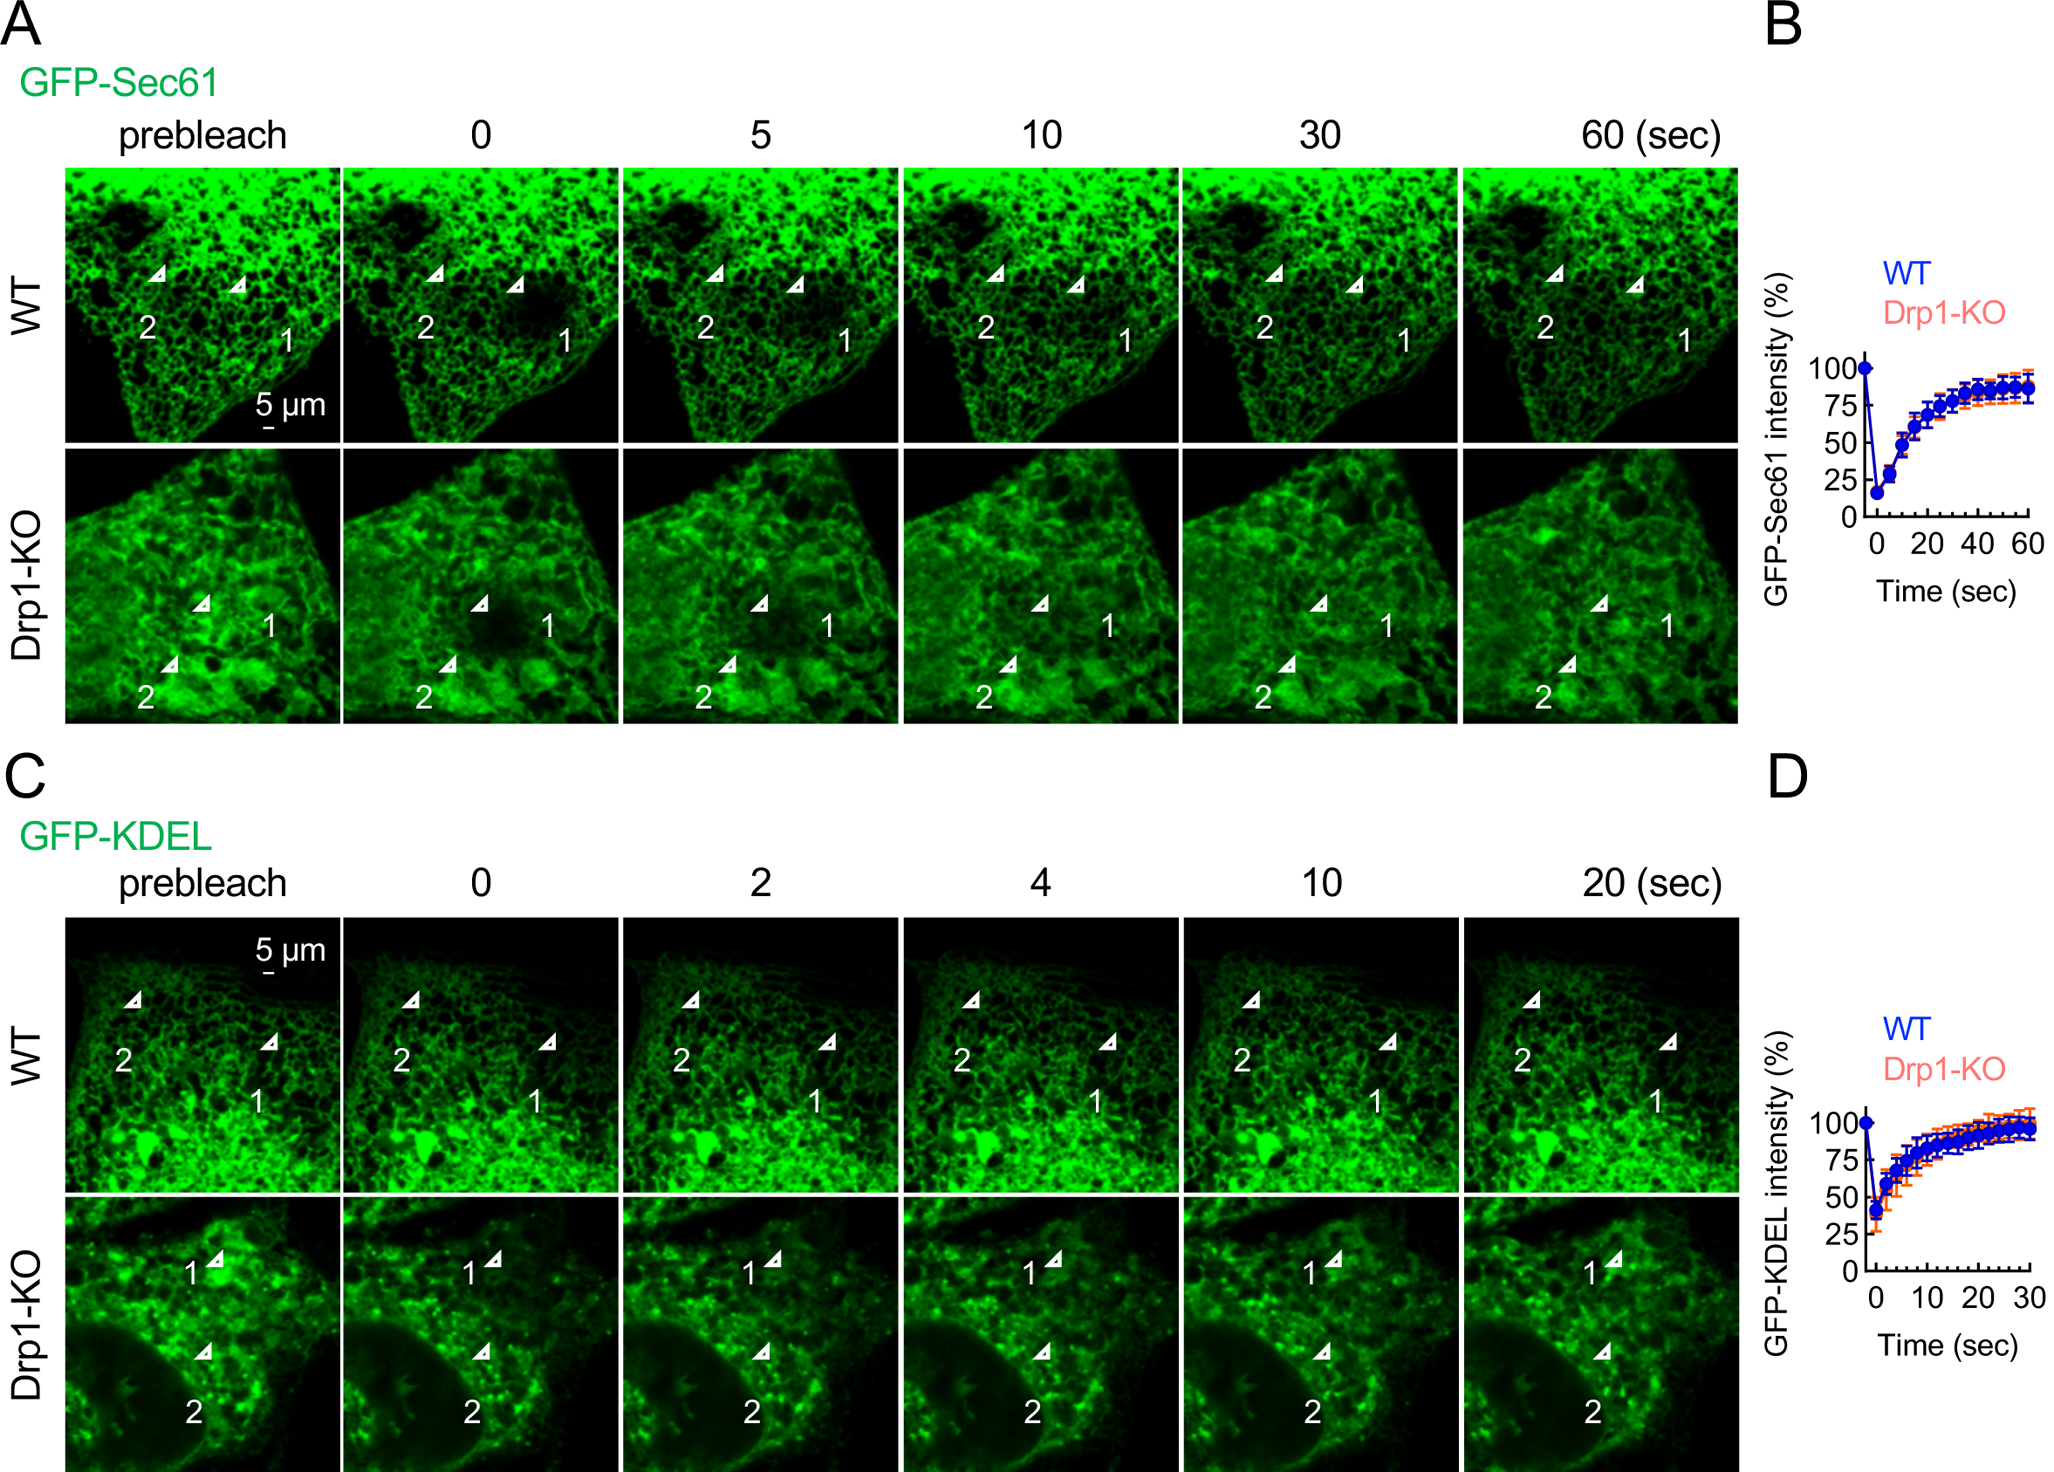
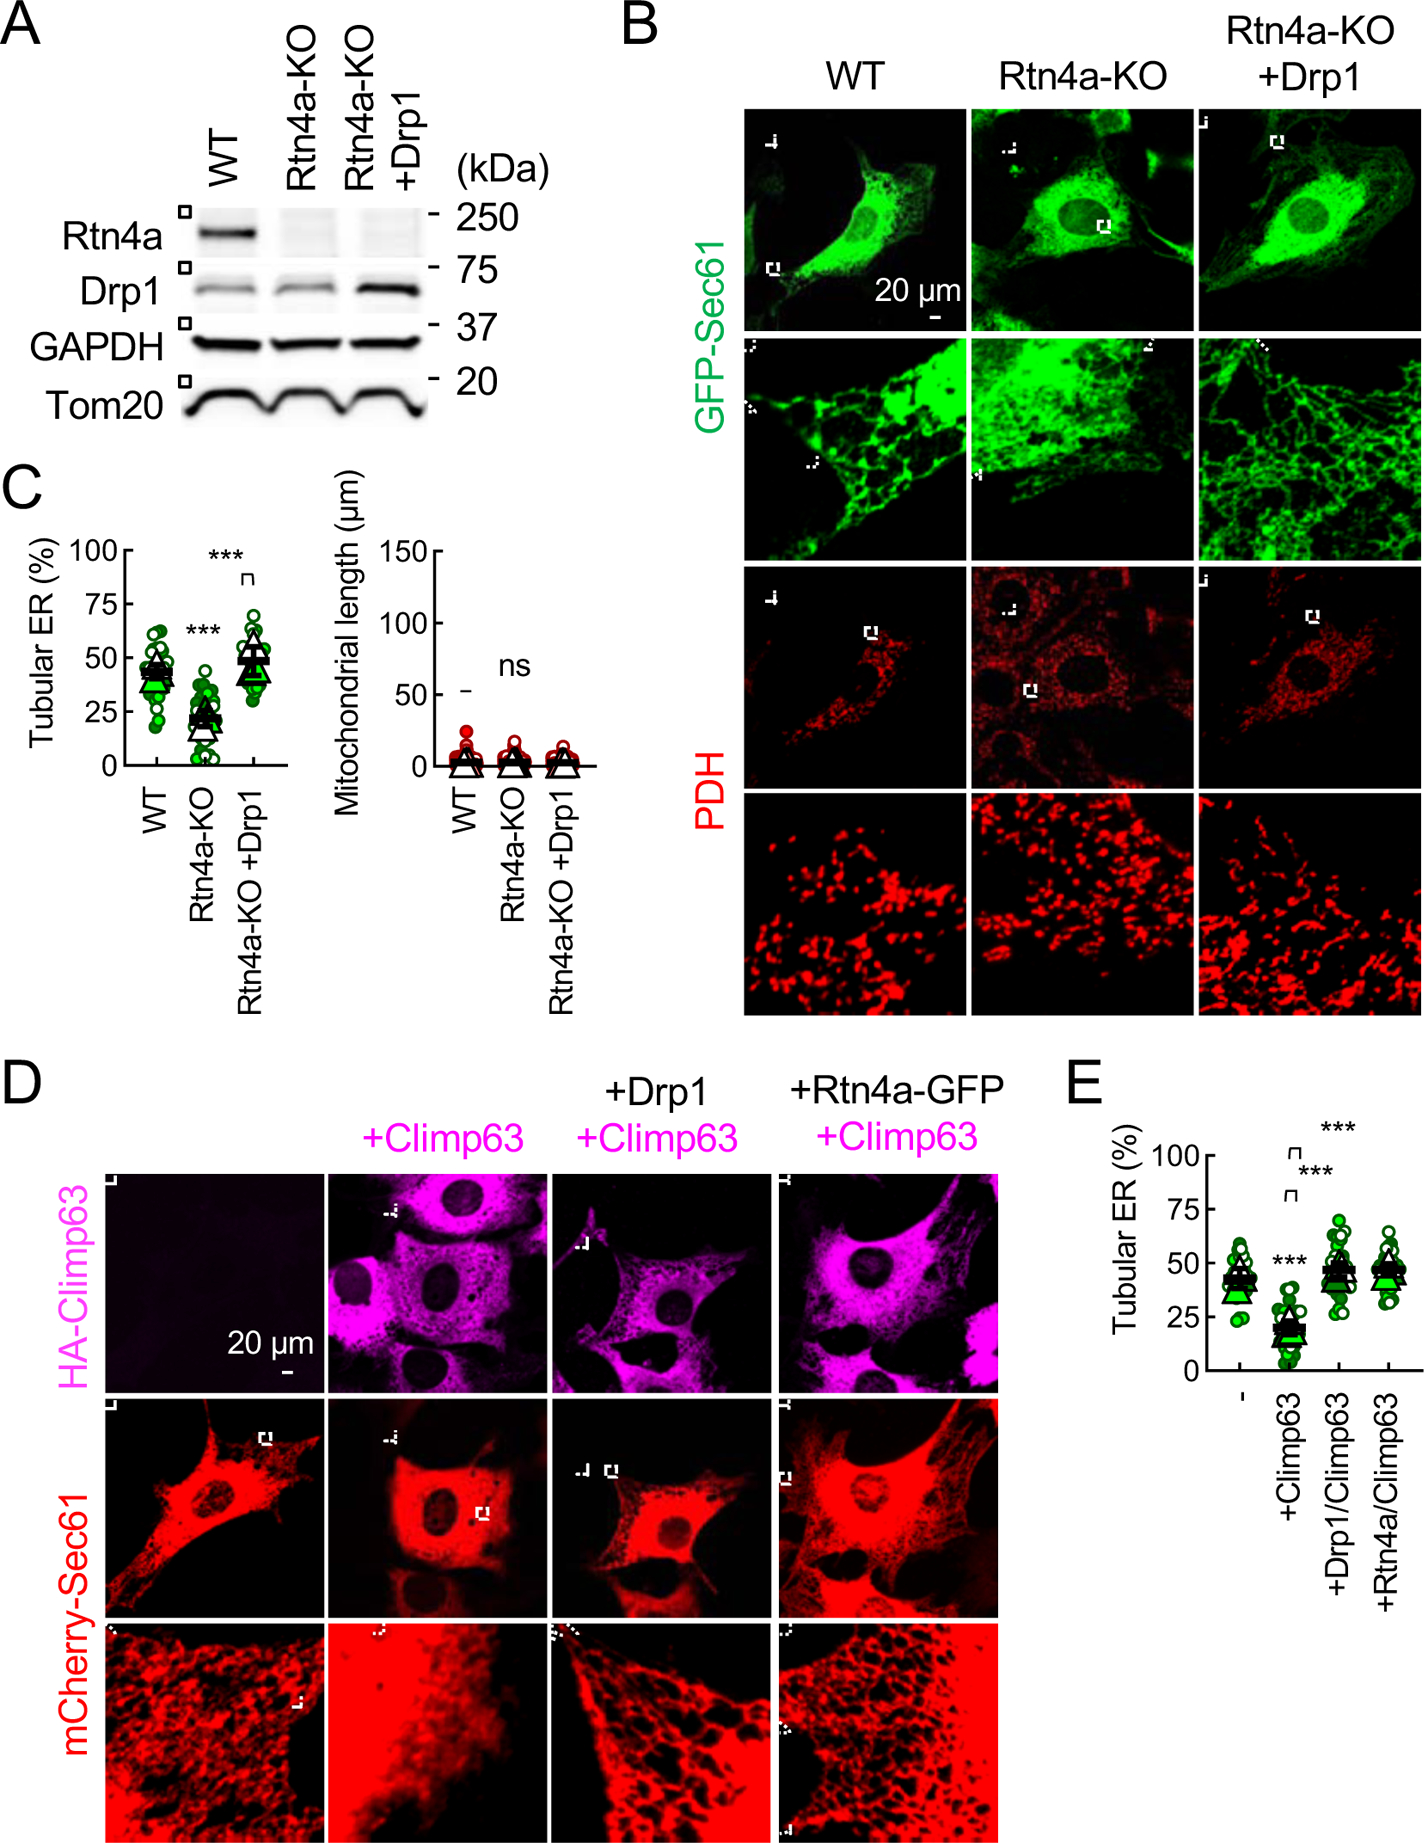
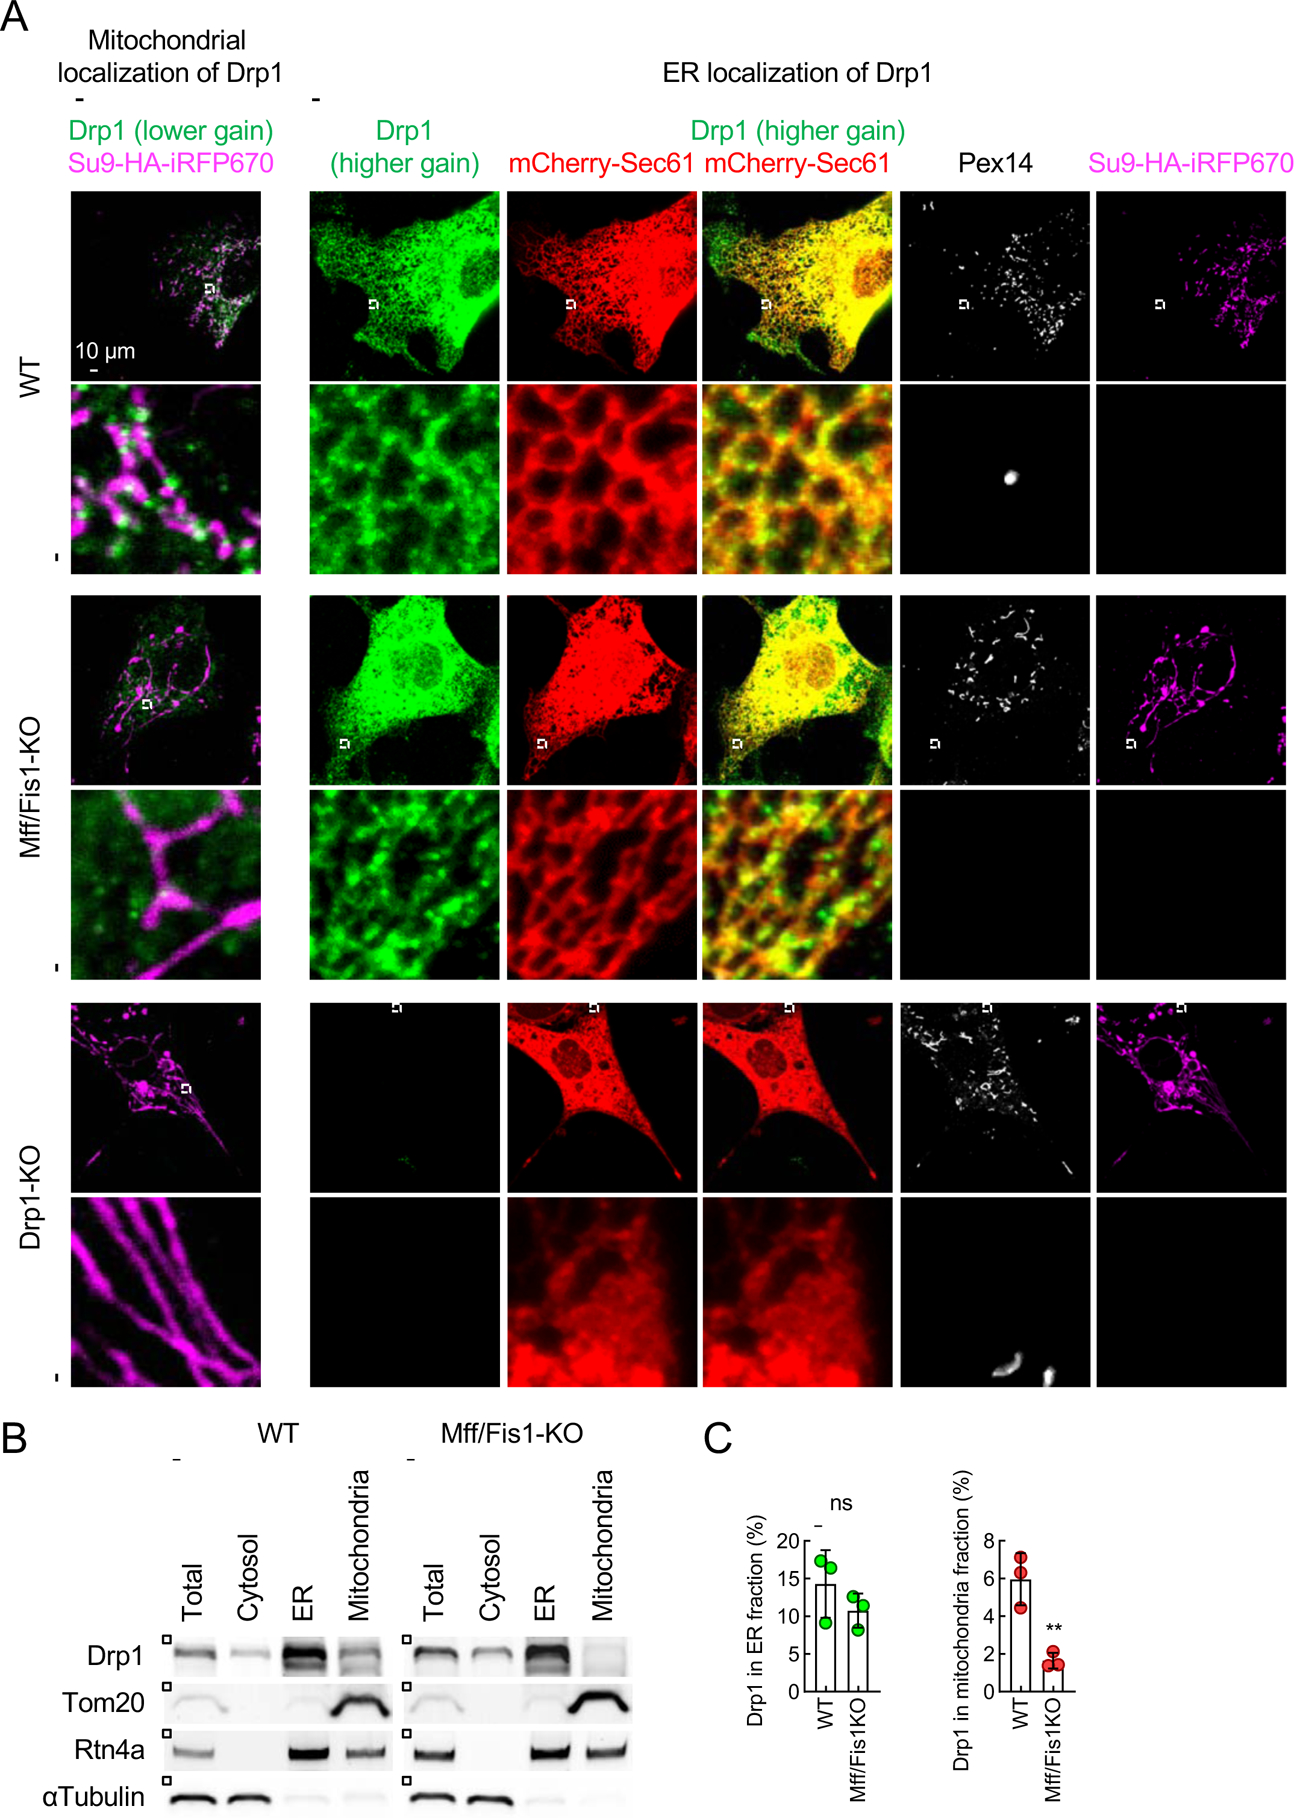
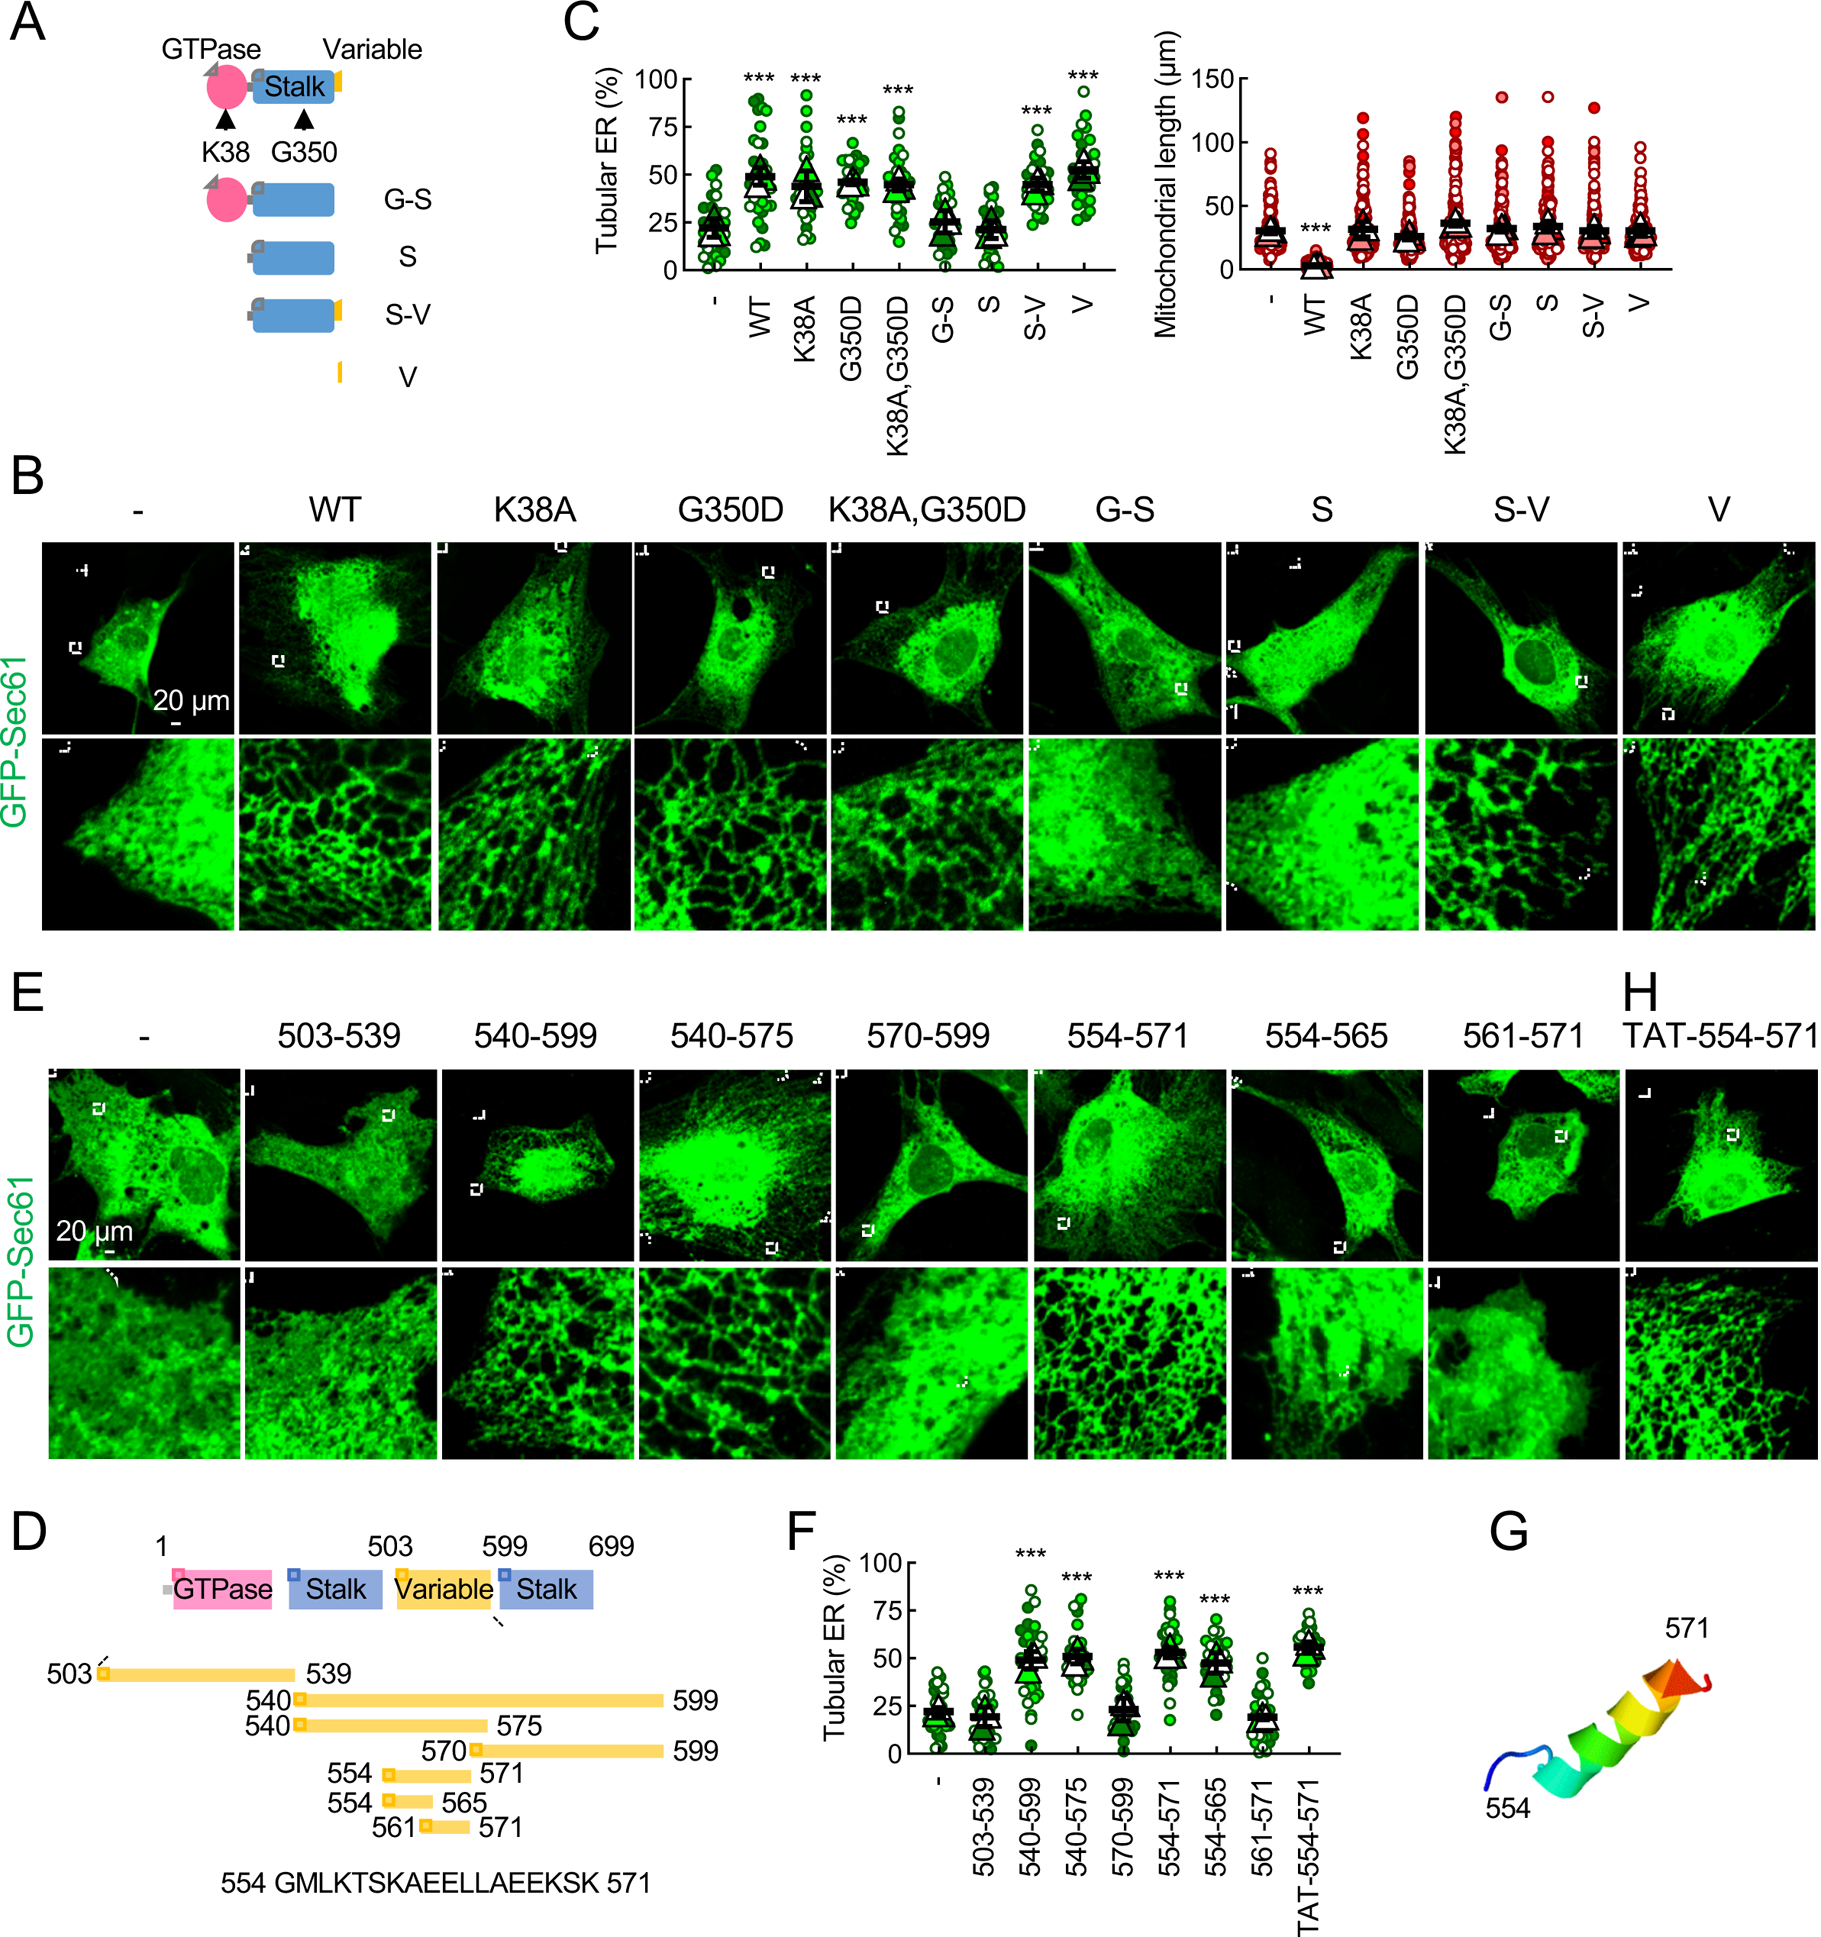
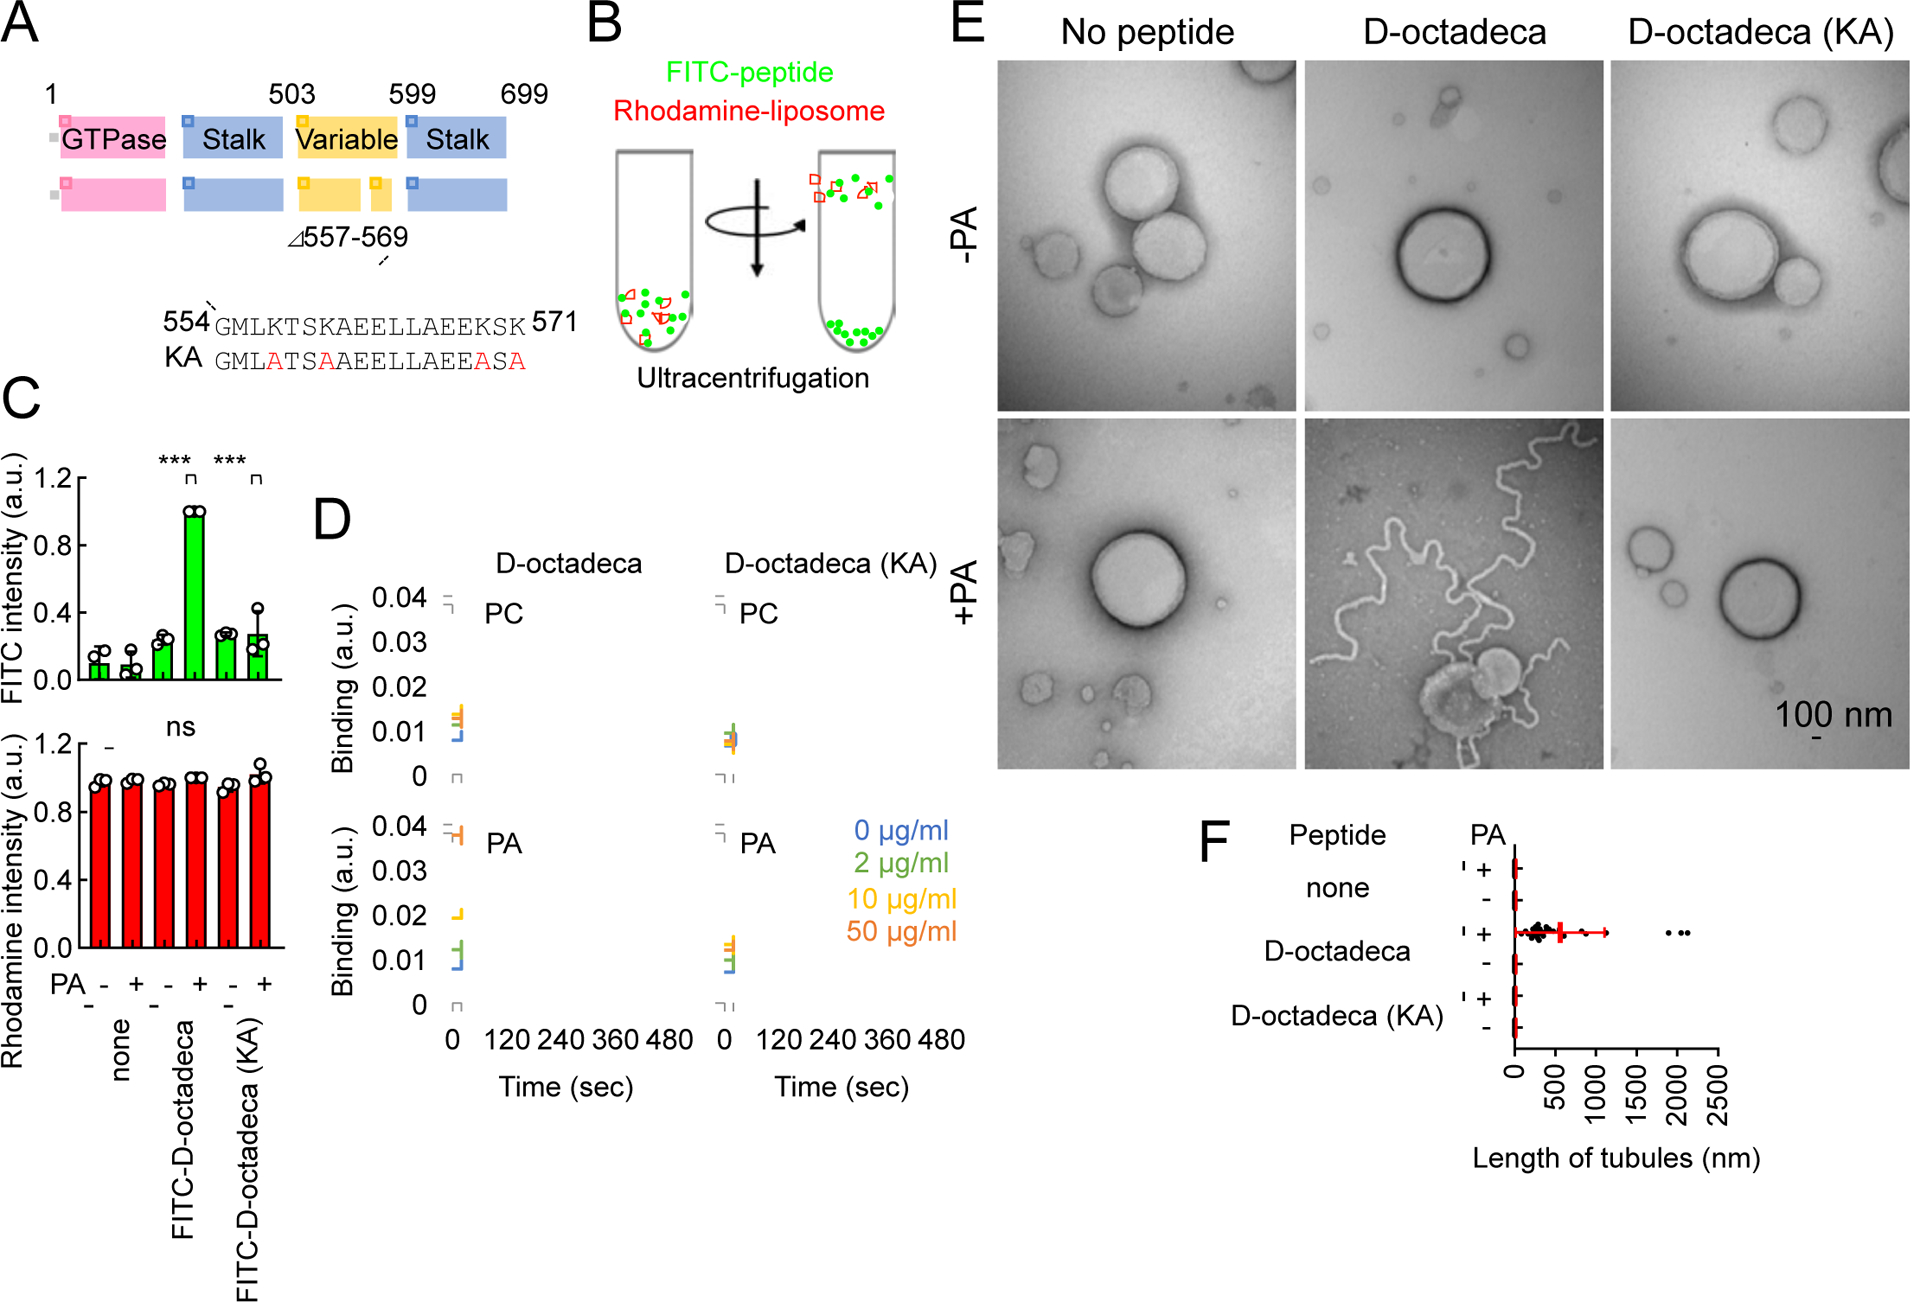
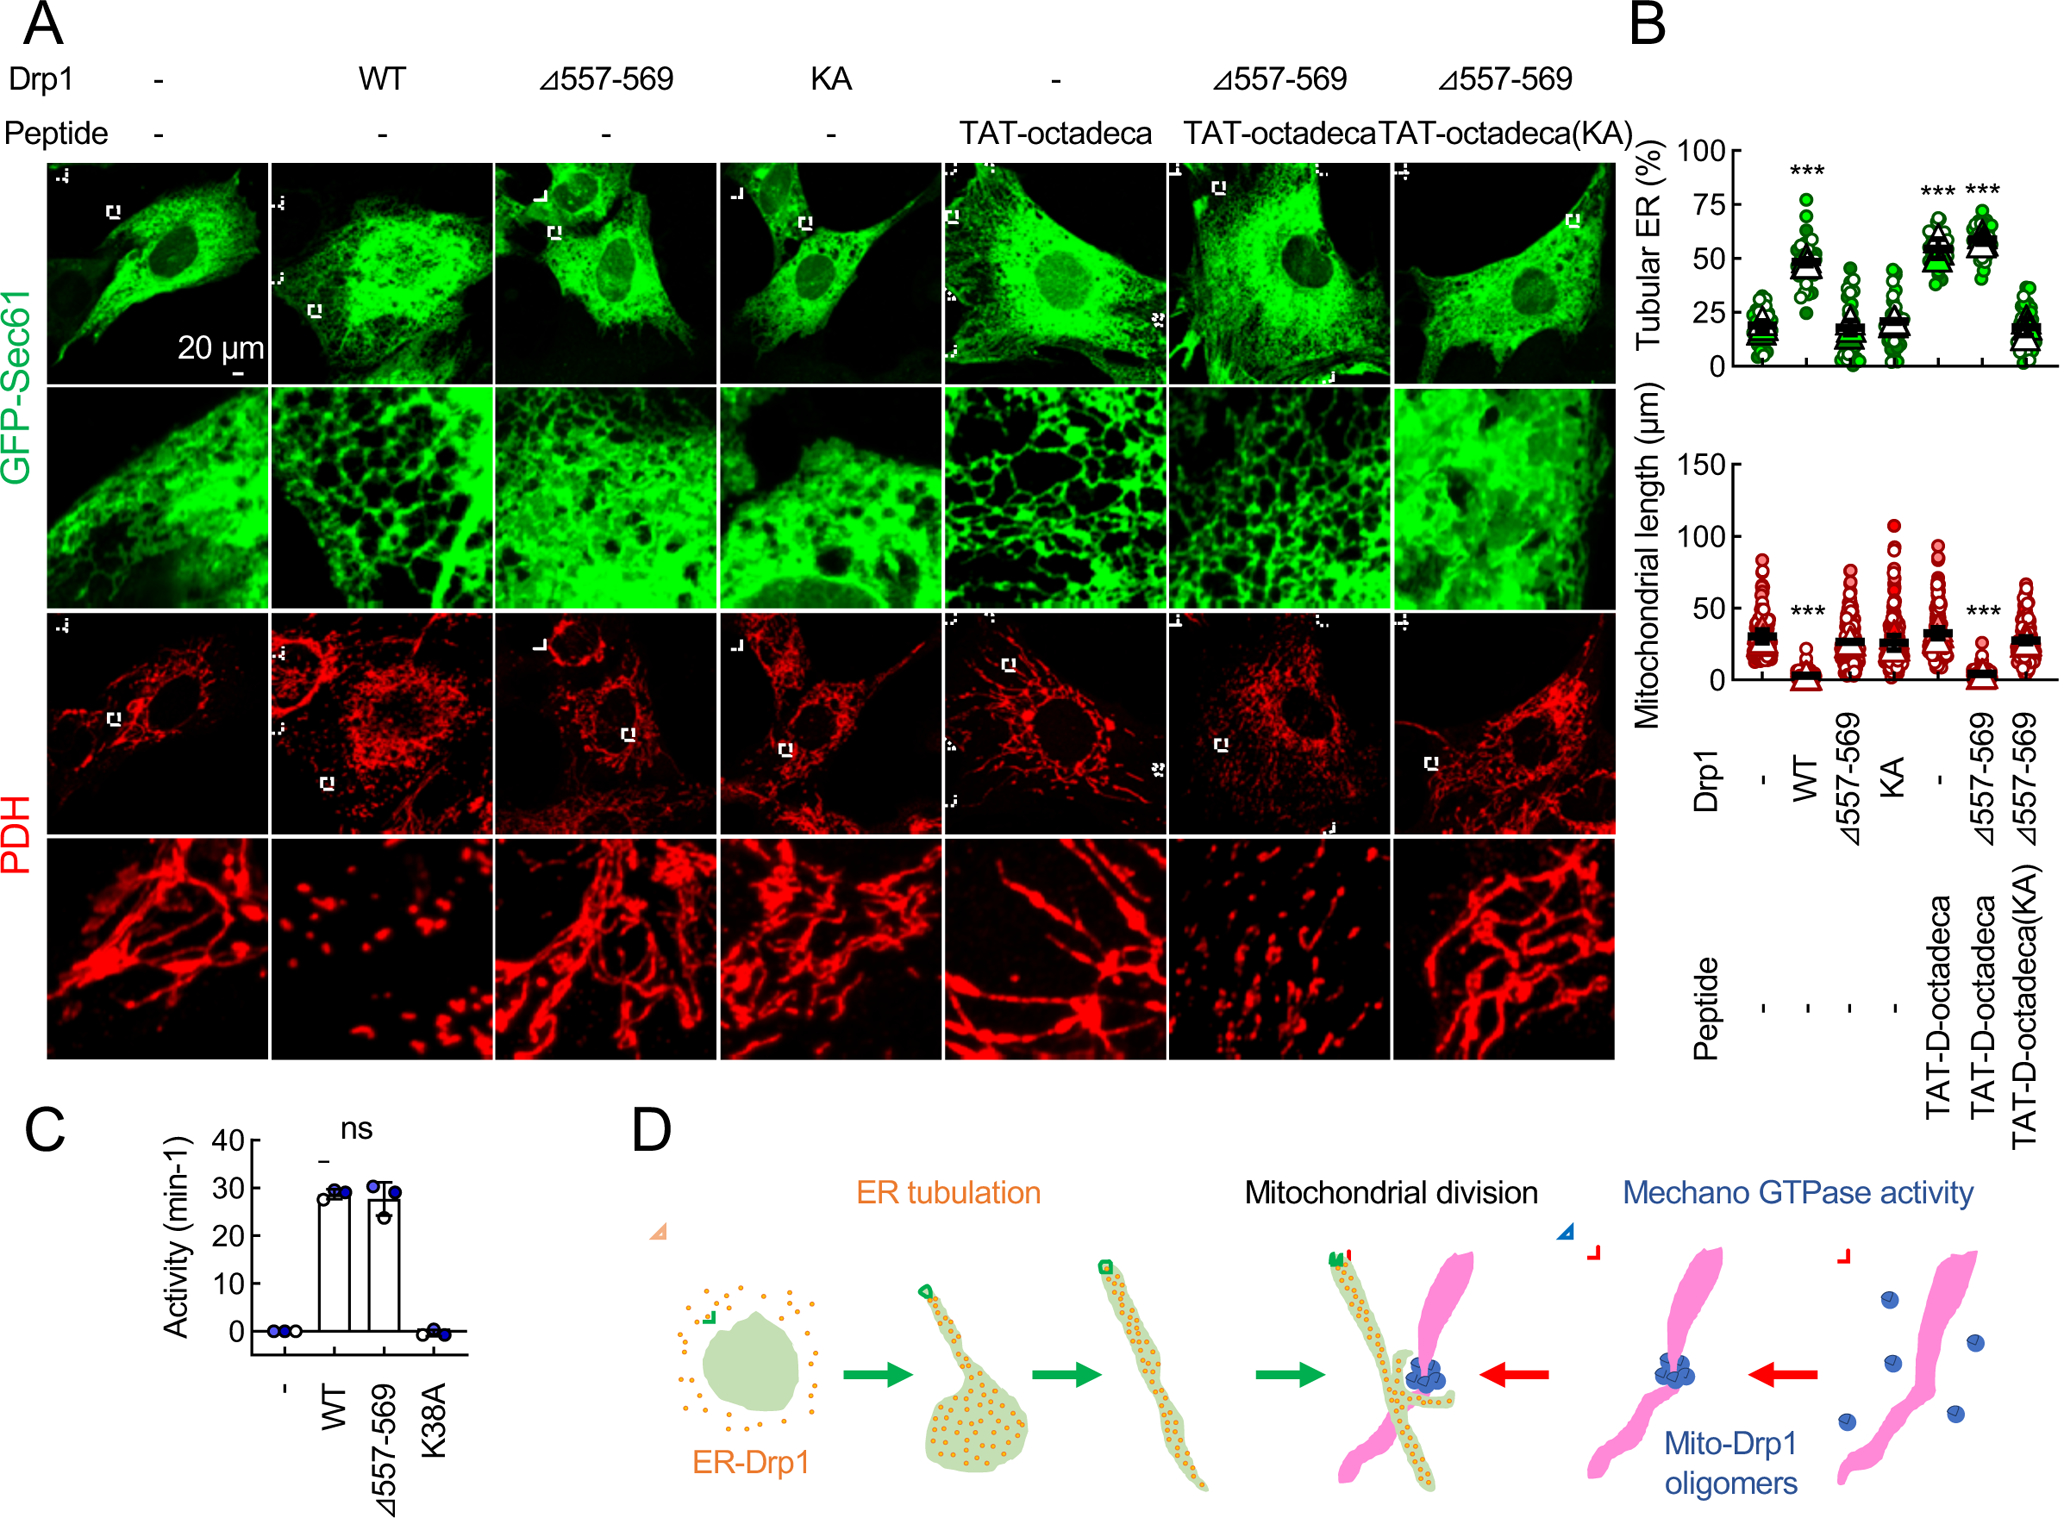
Mitochondria are highly dynamic organelles that continuously grow, divide, and fuse. The division of mitochondria is crucial for human health. During mitochondrial division, the mechano-guanosine triphosphatase (GTPase) dynamin-related protein (Drp1) severs mitochondria at endoplasmic reticulum (ER)-mitochondria contact sites, where peripheral ER tubules interact with mitochondria. Here, we report that Drp1 directly shapes peripheral ER tubules in human and mouse cells. This ER-shaping activity is independent of GTP hydrolysis and located in a highly conserved peptide of 18 amino acids (termed D-octadecapeptide), which is predicted to form an amphipathic α helix. Synthetic D-octadecapeptide tubulates liposomes in vitro and the ER in cells. ER tubules formed by Drp1 promote mitochondrial division by facilitating ER-mitochondria interactions. Thus, Drp1 functions as a two-in-one protein during mitochondrial division, with ER tubulation and mechano-GTPase activities.

Keywords: Drp1; mitochondria; mitochondrial division; organelle contact sites; phosphaditic acid; the endoplasmic reticulum.


Conflict of interest statement

Declaration of Interests The authors declare no competing interests.

Figures

Fig. 1.
Fig. 1.. Drp1 controls ER tubulation in cells.
(A) WT, Drp1-KO, and Mff/Fis1 double-KO MEFs were transfected with an ER marker (GFP-Sec61β) and subjected to immunofluorescence confocal microscopy with antibodies to a mitochondrial protein, pyruvate dehydrogenase (PDH), and GFP. Boxed areas are enlarged. Cells are outlined by a dotted line. (B) The expression levels of Drp1, Mff, and Fis1 were analyzed by Western blotting. (C) Quantification of the morphology of the ER (green, n = 3 experiments, 10 cells were analyzed in each experiment) and mitochondria (red, n = 3 experiments, 50 mitochondria were examined in each experiment). Bars are average ± SD. (D) WT and Drp1-KO MEFs were subjected to immunofluorescence microscopy with antibodies to an endogenous ER protein, BiP. (E) Quantification of ER morphology. Bars are average ± SD (n = 3). (F, G and H) Knockdown of Drp1 decreases amounts of ER tubules in cells. WT MEFs were transduced with lentiviruses carrying scramble or Drp1-targeted shRNAs. (F) The expression of Drp1 was analyzed by Western blotting. (G) The ER and mitochondria were visualized by GFP-Sec61β and anti-PDH antibodies, respectively. (H) Quantification of the morphology of ER (green, n = 3) and mitochondria (red, n = 3). Bars are average ± SD. (I) The indicated Hela cells were transfected with the GFP-Sec61β plasmid and subjected to immunofluorescence microscopy with antibodies to a mitochondrial protein (Tom20) and GFP. (J) Quantification of the morphology of ER (green, n = 3) and mitochondria (red, n = 3) is shown. Bars are average ± SD. Statistical analysis was performed using One-way ANOVA with post-hoc Tukey (C, F and I), and Student’s t-test (E): **p<0.01, ***p<0.001. See also Figure S1.
Fig. 2.
Fig. 2.. The loss of Drp1 does not affect the connectivity of the ER membrane and lumen.
(A) FRAP analysis of GFP-Sec61β (an ER membrane probe) in WT and Drp1-KO MEFs. GFP-Sec61β in region #1 was photobleached at 0 sec. Images were taken at 5 sec intervals. (B) GFP intensity in region #1 was normalized to that of unbleached region #2 at each time point. Bars are the average ± SD (n = 10 cells). (C) FRAP analysis of GFP-KDEL (an ER luminal probe) in WT and Drp1-KO MEFs. Images were taken at 2-sec intervals. (D) Quantification of relative GFP intensity in region #1. Bars are the average ± SD (n = 10 cells).
Fig. 3.
Fig. 3.. Drp1 forms ER tubules independently of Rtn4a and Climp63.
(A) The expression levels of Rtn4a and Drp1 were analyzed in WT MEFs, Rtn4a-KO MEFs, and Rtn4a-KO MEFs ectopically expressing Drp1 by Western blotting. (B) The ER and mitochondria in these MEFs were visualized. (C) Quantification of the morphology of the ER and mitochondria. Bars are average ± SD (n = 3 experiments). (D) WT MEF expressing mCherry-Sec61β were transduced with lentiviruses carrying HA-Climp63 along with Drp1 or Rtn4a-GFP. The efficiency of lentivirus transduction was essentially 100%. The MEFs were subjected to immunofluorescence microscopy with antibodies to HA and mCherry. (E) Quantification of ER morphology. Bars are average ± SD (n = 3). Statistical analysis was performed using One-way ANOVA with post-hoc Tukey (C and E): **p<0.01, ***p<0.001.
Fig. 4.
Fig. 4.. Drp1 is located at the ER.
WT, Mff1/Fis1-KO, and Drp1-KO MEFs, all of which express mCherry-Sec61β and a mitochondrial marker (Su9-HA-iRFP670), were analyzed by immunofluorescence confocal microscopy with antibodies to Drp1, mCherry, a peroxisomal protein (Pex14), and HA. Drp1 signals were detected using two different gain settings (lower gain for mitochondrial localization and higher gain for ER localization). Regions where mitochondria and peroxisomes are absent are boxed and enlarged (higher gain). (B) The ER and mitochondrial fractions were obtained from WT and Mff/Fis1-KO MEFs using differential centrifugations. Each fraction was analyzed by western blotting using antibodies to Drp1, Tom20, Rtn4a, and α-Tubulin. (C) Relative amounts of Drp1 in the ER and mitochondrial fractions were quantified. Bars are the average ± SD (n = 3). Statistical analysis was performed using a student’s t-test: **p<0.01.
Fig. 5.
Fig. 5.. D-octadecapeptide in the variable domain tubulates the ER in cells.
(A) Drp1-KO MEFs expressing the indicated Drp1 constructs (WT, mutants, or individual or combined domains) were transfected with GFP-Sec61β. (B) These MEFs were analyzed using immunofluorescence confocal microscopy with antibodies to GFP and Tom20 (see Fig. S2C). (C) Quantification of the morphology of ER (green, n = 3 experiments) and mitochondria (red, n = 3 experiments) is shown. Bars are average ± SD. (D) Truncations of the variable domain. (E) Drp1-KO MEFs carrying the truncations and GFP-Sec61β were subjected to immunofluorescence confocal microscopy with antibodies to GFP and PDH (see Fig. S2D). (F) Quantification of ER morphology. Bars are average ± SD (n = 3). (G) D-octadecapeptide is predicted to form an α-helix by ITASSER. (H) Drp1-KO MEFs expressing GFP-Sec61β were treated with synthetic D-octadecapeptide fused to a cell-permeable peptide TAT (50 μM) for 24 h and subjected to immunofluorescence microscopy with anti-GFP antibodies. Statistical analysis was performed using one-way ANOVA with the Tukey post-hoc test (C and F): ***p<0.001. See also Figure S2, S3 and S5.
Fig. 6.
Fig. 6.. Mechanism of ER tubulation by D-octadecapeptide.
(A) The amino acid sequence of D-octadecapeptide is shown. The KA D-octadecapeptide mutant was created by changing four lysines to alanines (red). (B) Liposome flotation assay. Synthetic liposomes that mimic the ER membrane (which contains PC, PE, PI, and PS) carrying rhodamine-PE with or without saturated PA were incubated with FITC-labeled D-octadecapeptide or KA D-octadecapeptide and placed at the bottom of a sucrose gradient. (C) After ultracentrifugation, we collected four fractions from the top of the tube and measured FITC and rhodamine fluorescence. Almost 100% of the liposomes floated to the top fraction based on rhodamine fluorescence. Bars are average ± SD (n = 3 experiments). (D) Interactions of D-octadecapeptide and KA D-octadecapeptide with saturated PC or saturated PA were measured using surface plasmon resonance. Averages of triplicates for each lipid concentration are shown. (E) The same liposomes used in (B) were incubated with 1 μM D-octadecapeptide or KA D-octadecapeptide and viewed with negative-stain EM. (F) The length of the tubules that emerged from the liposomes was quantified. Bars are average ± SD (n = 20 tubules). Statistical analysis was performed using one-way ANOVA with the Tukey post-hoc test (C) and Kruskal-Wallis with Dunn’s post-hoc test (F): ***p<0.001. See also Figure S4.
Fig. 7.
Fig. 7.. Function of ER tubulation by D-octadecapeptide.
(A) Drp1-KO MEFs expressing the indicated Drp1 constructs were transfected with GFP-Sec61β. MEFs were then treated with 50 μM TAT-D-octadecapeptide or KA TAT-D-octadecapeptide for 24 h and analyzed using immunofluorescence confocal microscopy with antibodies to GFP and PDH. (B) Quantification of the morphology of ER (green, n = 3 experiments) and mitochondria (red, n = 3 experiments) is shown. Bars are average ± SD. (C) GTPase activity of purified His6-tagged WT Drp1, Drp1Δ557–569 and GTPase-dead Drp1K38A. Bars are average ± SD (n = 3). (D) Model for the role of Drp1 in ER tubule-associated mitochondrial division. Statistical analysis was performed using Kruskal-Wallis with Dunn’s post-hoc test (B and C): ***p<0.001. See also Figure S2 and S5. See also Figure S4, S5, S6 and S7.

References

    1. Adachi Y, Iijima M, and Sesaki H (2018). An unstructured loop that is critical for interactions of the stalk domain of Drp1 with saturated phosphatidic acid. Small GTPases 9, 472–479. - PMC - PubMed
    1. Adachi Y, Itoh K, Iijima M, and Sesaki H (2017). Assay to Measure Interactions between Purified Drp1 and Synthetic Liposomes. Bio Protocol 7, e2266. - PMC - PubMed
    1. Adachi Y, Itoh K, Yamada T, Cerveny KL, Suzuki TL, Macdonald P, Frohman MA, Ramachandran R, Iijima M, and Sesaki H (2016). Coincident Phosphatidic Acid Interaction Restrains Drp1 in Mitochondrial Division. Mol Cell 63, 1034–1043. - PMC - PubMed
    1. Baumann O, and Walz B (2001). Endoplasmic reticulum of animal cells and its organization into structural and functional domains. Int Rev Cytol 205, 149–214. - PubMed
    1. Chen S, Novick P, and Ferro-Novick S (2013). ER structure and function. Curr Opin Cell Biol 25, 428–433. - PMC - PubMed

Publication types

LinkOut - more resources