. 2020 Dec 1;32(6):1012-1027.e7.
doi: 10.1016/j.cmet.2020.10.010. Epub 2020 Nov 4.

TANK-Binding Kinase 1 Regulates the Localization of Acyl-CoA Synthetase ACSL1 to Control Hepatic Fatty Acid Oxidation

Affiliations

TANK-Binding Kinase 1 Regulates the Localization of Acyl-CoA Synthetase ACSL1 to Control Hepatic Fatty Acid Oxidation

Jin Young Huh et al. Cell Metab. .

Abstract

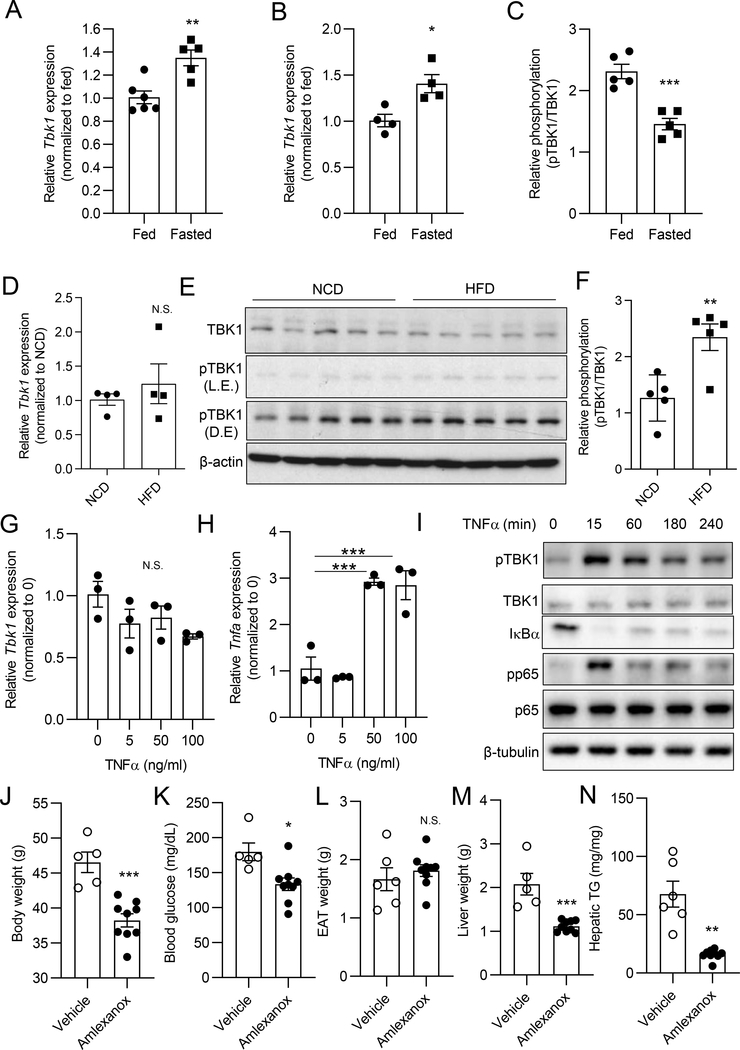
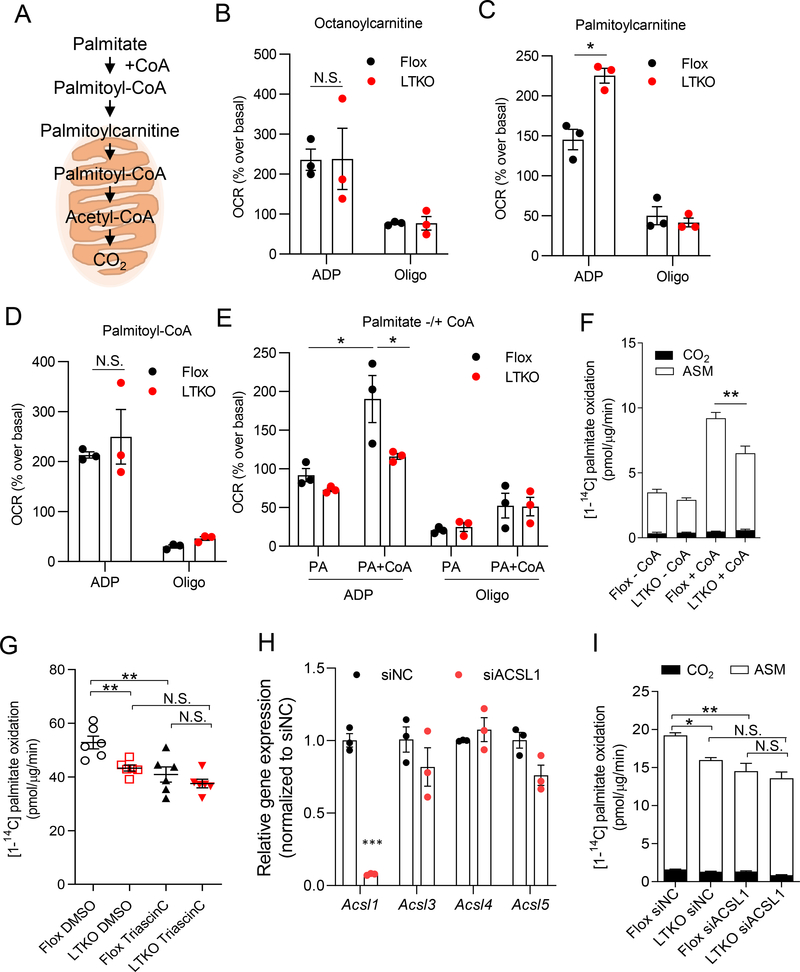
Hepatic TANK (TRAF family member associated NFκB activator)-binding kinase 1 (TBK1) activity is increased during obesity, and administration of a TBK1 inhibitor reduces fatty liver. Surprisingly, liver-specific TBK1 knockout in mice produces fatty liver by reducing fatty acid oxidation. TBK1 functions as a scaffolding protein to localize acyl-CoA synthetase long-chain family member 1 (ACSL1) to mitochondria, which generates acyl-CoAs that are channeled for β-oxidation. TBK1 is induced during fasting and maintained in the unphosphorylated, inactive state, enabling its high affinity binding to ACSL1 in mitochondria. In TBK1-deficient liver, ACSL1 is shifted to the endoplasmic reticulum to promote fatty acid re-esterification in lieu of oxidation in response to fasting, which accelerates hepatic lipid accumulation. The impaired fatty acid oxidation in TBK1-deficient hepatocytes is rescued by the expression of kinase-dead TBK1. Thus, TBK1 operates as a rheostat to direct the fate of fatty acids in hepatocytes, supporting oxidation when inactive during fasting and promoting re-esterification when activated during obesity.

Keywords: acyl-CoA synthetase long-chain family member 1 (ACSL1); fasting; hepatic lipid metabolism; mitochondria; nonalcoholic fatty liver disease (NAFLD); re-esterification; tank-binding kinase 1 (TBK1); β-oxidation.


Conflict of interest statement

Declaration of Interests A.R.S. is a founder of Elgia Therapeutics and named inventor on several patent applications that include amlexanox. The other authors declare that they have no competing interests.

Figures

Figure 1.
Figure 1.. Hepatic TBK1 mRNA expression is induced by fasting and its activity increases upon HFD.
(A) Tbk1 expression in liver tissues from ad libitum-fed or 16 h fasted mice. n = 5–6 mice per group. (B) Tbk1 expression in primary hepatocytes from ad libitum-fed or 16 h fasted mice. n = 4 mice per group. (C) Quantified amount of pTBK1 (Ser172) and TBK1 in liver tissues from ad libitum-fed or 16 h fasted mice. Band density quantified from immunoblot (IB) shown in Fig. S1C. n = 5 mice per group. (D) Tbk1 expression in liver tissues from NCD or 8 weeks of HFD-fed mice. n = 4 mice per group. (E) IB analysis of TBK1 and pTBK1(Ser172) in livers from NCD or 8 weeks of HFD-fed mice. n = 5 mice per group. L.E., light exposure; D.E, dark exposure. (F) Quantified ratio of TBK1 and pTBK1(Ser172) in liver tissues from NCD or HFD-fed mice. n = 5 mice per group. (G) Tbk1 expression in primary hepatocytes treated with vehicle (DMSO) or TNFα for 24 h. n = 3 replicates per group. (H) Tnfa expression in primary hepatocytes treated with vehicle (DMSO) or TNFα for 24 h. n = 3 replicates per group. (I) IB analysis of pTBK1 (S172), TBK1, IκBα, pp65 (S536), and p65 in primary hepatocytes treated with vehicle or TNFα (50 ng/ml) for the indicated time. (J-N) 8 days of amlexanox treatment in diet-induced obese (DIO) mice. n = 5 mice for vehicle and 9 mice for amlexanox group. (J) Body weight after amlexanox treatment. (K) Blood glucose levels. (L) Epididymal adipose tissue (EAT) weight. (M) Liver weight. (N) Hepatic triglyceride (TG) levels (mg/g tissue). * p < 0.05, **p < 0.01, ***p < 0.001, N.S. no significance; p > 0.05. (Student’s t test for A, B, C, D, F, J, K, L, M, and N, One-way ANOVA for G and H). All data in the figure are shown as the mean ± SEM. See also Figure S1 and S2.
Figure 2.
Figure 2.. Liver-specific TBK1 deficiency increases hepatic lipid accumulation in response to fasting.
(A~F) NCD-fed flox mice and LTKO mice. (A) Tbk1 mRNA expression in liver tissues from flox or LTKO mice. n = 5–6 mice per group. ***p < 0.001. (Student’s t test). (B) Body weight of 16 week-old NCD-fed mice. n = 11 mice per group. (C) Inflammatory gene expression in liver tissues. n = 4–7 mice per group. (D) Representative images of H&E-stained livers from flox and LTKO mice in ad libitum-fed or 16 h fasted. Scale bar, 50 μm. (E) Hepatic triglyceride (TG) content (mg/g tissue) of NCD-fed mice. n = 5–6 mice per group. (F) Hepatic cholesterol content (mg/g tissue) of NCD-fed mice. n = 6 mice for each group. (G~L) 8 weeks of HFD-fed flox and LTKO mice. (G) Body weight change during HFD feeding. n = 6–9 mice per group. (H) Liver weight of HFD-fed flox and LTKO mice in ad libitum-fed or 16 h fasted. n = 5–7 mice per group. (I) Inflammatory gene expression in liver tissues. n = 6–8 mice per group. (J) Representative images of H&E-stained livers from HFD-fed flox and LTKO mice in ad libitum-fed or 16 h fasted. Scale bars, 100 μm. (K) Hepatic triglyceride (TG) content (mg/g tissue) of HFD-fed mice. n = 6–9 mice per group. (L) Hepatic cholesterol content (mg/g tissue) of HFD-fed mice. n = 6–9 mice per group. For data in (C), (E), (F), (H), (I), (K), and (L), * p < 0.05, **p < 0.01, ***p < 0.001 for flox compared to LTKO in same feeding condition and #p < 0.05, ##p < 0.01, ###p < 0.001 for fed compared to fasted group in same genotype (two-way ANOVA followed Holm-Sidak’s multiple comparisons test). All data in the figure are shown as the mean ± SEM. See also Figure S3.
Figure 3.
Figure 3.. Loss of TBK1 suppresses fasting-induced fatty acid oxidation in liver.
(A-C) mRNA expression of fatty acid uptake-related genes (A), lipogenesis genes (B), and fatty acid oxidation genes (C) in the liver tissues from HFD-fed flox and LTKO mice in ad libitum-fed or 16 h fasted group. n = 6–9 mice per group. (D) Hepatic lipid secretion analysis with HFD-fed flox and LTKO mice. n = 6 mice for flox and 9 mice for LTKO. (E, F) De novo lipogenesis activity in livers from HFD-fed flox and LTKO mice. n = 8 mice for flox and n = 4 mice for LTKO. N.S., no significance (Student t-test). (G) Fatty acid uptake in primary hepatocytes from NCD-fed flox or LTKO mice. n = 8 replicates per group. (H, I) Serum levels of β-hydroxybutyrate (BOH) (H) and total ketone bodies (TKB) (I) in HFD-fed flox or LTKO mice upon 16 h fasting. n = 5–6 mice per group. *p < 0.05 (Student t-test). (J) 14C-palmitate oxidation activity in primary hepatocytes from flox or LTKO mice. n = 6 replicates per group. ***p < 0.001 (Student t-test). (K) Complete oxidation rate by 14C-palmitate. n = 6 replicates per group. **p < 0.01 (Student t test). For the data in (A), (B), (C), (D), and (G), *p < 0.05 for flox compared to LTKO in same feeding condition, #p < 0.05, ##p < 0.01 for fed compared to fasting in each genotype, N.S.; no significance between genotypes; p > 0.05 (two-way ANOVA followed Holm-Sidak’s multiple comparisons test). All data in the figure are shown as the mean ± SEM. See also Figure S4.
Figure 4.
Figure 4.. LTKO mice have increased mitochondria number and size.
(A) The mitochondrial DNA copy number in livers from NCD-fed flox and LTKO mice after 16 h fasting. n = 5–6 mice per group. (B) The mitochondrial DNA copy number in livers from HFD-fed flox and LTKO mice after 16 h fasting. n = 5–6 mice per group. (C) The mRNA levels of mitochondrial biogenesis-related genes from NCD-fed flox and LTKO mice in 16 h fasting. n = 6–7 mice per group. (D) The mRNA levels of mitochondrial biogenesis-related genes from HFD-fed flox and LTKO mice in 16 h fasting. n = 5–6 mice per group. (E) TEM photographs of liver tissues from HFD-fed flox and LTKO mice after 16 h fasting. Scale bar, 2 μm. KC, Kupffer cell; LD, lipid droplet; Mc, mitochondria; Nuc, nucleus; SD, space of Disse or perisinusoidal space; SS, sinusoidal space. (F) Distribution of mitochondrial area. (G) Distribution of mitochondrial length. (H) Mitochondria number per area. For the data in (A), (B), (C), (D), and (H) *p < 0.05, **p < 0.01 (Student t test). For (F) and (G), Kolmogorov-Smimov test was analyzed. N.S., no significance. All data in the figure are shown as the mean ± SEM.
Figure 5.
Figure 5.. Acyl-CoA synthetase activity is impaired in hepatic mitochondria of LTKO mice.
(A) The substrates for fatty acid oxidation. (B-E) ADP-stimulated and oligomycin-induced oxygen consumption rate (OCR) of isolated hepatic mitochondria from NCD-fed flox or LTKO mice with various substrates including octanoylcarnitine (B), palmitoylcarnitine (C), palmitoyl-CoA (D), and palmitate with (+) or without (−) coenzyme A (CoA) (E). n =3 mice per genotype and n = 6 replicates per mouse. Each dot indicates the mean value for each mouse. For data in (B), (C), (D) and (E), *p < 0.05, N.S., no significance (two-way ANOVA followed Holm-Sidak’s multiple comparisons test). (F) 14C-palmitate oxidation rate in the PMP (plasma membrane permeanilizer, 3 nM)-treated primary hepatocytes from flox or LTKO mice with or without CoA. n = 6 replicates per group. (G) Fatty acid oxidation rate in primary hepatocytes from flox or LTKO mice upon 5 μM triascin C treatment (pretreatment for 30 min and during 3 hours of oxidation assay). n = 6 replicates per group. (H) The mRNA levels of ACSL isoforms in primary hepatocytes by ACSL1 siRNA transfection. n = 3 replicates per group. siNC, siRNA for negative control. ***p < 0.001 (Student t test). (I) Fatty acid oxidation rate in siACSL1 transfected primary hepatocytes from flox or LTKO mice. n = 6 replicates per group. For data in (F), (G), and (I), *p < 0.05, **p < 0.01, N.S., no significance, (two-way ANOVA followed Holm-Sidak’s multiple comparisons test). All data in the figure are shown as the mean ± SEM. See also Figure S5.
Figure 6.
Figure 6.. The fasting-stimulated mitochondrial localization of ACSL1 is impaired in LTKO liver.
(A) The protein levels of ACSL1, ACSL4, and TBK1 in liver tissues from NCD-fed flox mice or LTKO mice. n = 4–8 mice per group. (B) Quantified levels of ACSL1 and ACSL4 expression in livers. (C) The expression of ACSL1 and TBK1 in mitochondrial and microsomal fraction of liver tissues from NCD-fed flox or LTKO mice. Ponceau band was used for loading control. n = 5 mice per group. (D) Quantified level of ACSL1 (normalized with ponceau band) in mitochondria. (E) Quantified level of ACSL1 (normalized with ponceau band) in microsome. (F) Quantified level of TBK1 (normalized with ponceau band) in mitochondria of flox mice. (G) Quantified level of TBK1 (normalized with ponceau band) in microsome of flox mice. (H-J) Re-esterification activity in primary hepatocytes from flox or LTKO mice upon [U-14C] palmitate. n = 3 replicates per group. (H) Autoradiography image for triglyceride (TG), diacylglyceride (DG) and polar lipid (PL). (I) Quantified band density of TG. (J) Quantified ratio of TG/PL. For data in (B), (D), and (E), *p < 0.05, **p < 0.01 for flox compared to LTKO in same feeding condition, #p < 0.05, ##p < 0.01 for fed compared to fasting in each genotype, two-way ANOVA followed Holm-Sidak’s multiple comparisons test was analyzed. Student t test was analyzed for (F), (G), (I), and (J). All data in the figure are shown as the mean ± SEM. See also Figure S6A and S6B.
Figure 7.
Figure 7.. Inactive TBK1 has a higher binding affinity for ACSL1.
(A) IP analysis with overexpressed TBK1 WT or TBK1 K38A and endogenous ACSL1 of primary hepatocytes. (B) IP analysis with overexpressed ACSL1 and TBK1 (WT, K38A, S172A) in HEK293 cell line. (C) IP analysis with overexpressed ACSL1 and each domain deleted TBK1 mutants (Full length, ΔULD, and ΔC-terminal). (D) The level of GST and pTBK1 (Ser172) in each purified GST-TBK1 from sf9 cells for in vitro binding assay. (E) In vitro binding assay with full length TBK1 (WT), C-terminal truncated TBK1 (ΔC WT), C-terminal truncated TBK1 with K38A mutation (ΔC K38A), and C-terminal truncated TBK1 with S172A mutation (ΔC S172A). n = 3 replicates per group. (F) Quantified level of GST normalized by flag (ACSL1). *p < 0.05 (Student t-test). (G) Cayman 10576 (20 μM, pre-treatment for 30 min and 3 hours of fatty acid oxidation assay) increases fatty acid oxidation in primary hepatocytes. n = 6 replicates per group. **p < 0.01 (Student t test). (H) Fatty acid oxidation rate in TBK1 WT or TBK1 K38A overexpressed hepatocytes from LTKO mice. n = 6 replicates per group. *p < 0.05, (two-way ANOVA followed Holm-Sidak’s multiple comparisons test). All IP analysis were replicated in more than three experiments. All data in the figure are shown as the mean ± SEM. See also Figure S6C and S7.

References

    1. ANSTEE QM, TARGHER G & DAY CP 2013. Progression of NAFLD to diabetes mellitus, cardiovascular disease or cirrhosis. Nat Rev Gastroenterol Hepatol, 10, 330–44. - PubMed
    1. BLACKBURN P, DESPRÉS JP, LAMARCHE B, TREMBLAY A, BERGERON J, LEMIEUX I & COUILLARD C 2006. Postprandial variations of plasma inflammatory markers in abdominally obese men. Obesity (Silver Spring), 14, 1747–54. - PubMed
    1. BYRNE CD & TARGHER G 2015. NAFLD: a multisystem disease. J Hepatol, 62, S47–64. - PubMed
    1. CHIANG SH, BAZUINE M, LUMENG CN, GELETKA LM, MOWERS J, WHITE NM, MA JT, ZHOU J, QI N, WESTCOTT D, DELPROPOSTO JB, BLACKWELL TS, YULL FE & SALTIEL AR 2009. The protein kinase IKKepsilon regulates energy balance in obese mice. Cell, 138, 961–75. - PMC - PubMed
    1. COLEMAN RA 2019. It takes a village: channeling fatty acid metabolism and triacylglycerol formation via protein interactomes. J Lipid Res, 60, 490–497. - PMC - PubMed

Publication types