. 2021 Jan 5;33(1):199-210.e8.
doi: 10.1016/j.cmet.2020.10.018. Epub 2020 Nov 4.

Functional Genomics Identifies Metabolic Vulnerabilities in Pancreatic Cancer

Affiliations

Functional Genomics Identifies Metabolic Vulnerabilities in Pancreatic Cancer

Douglas E Biancur et al. Cell Metab. .

Abstract

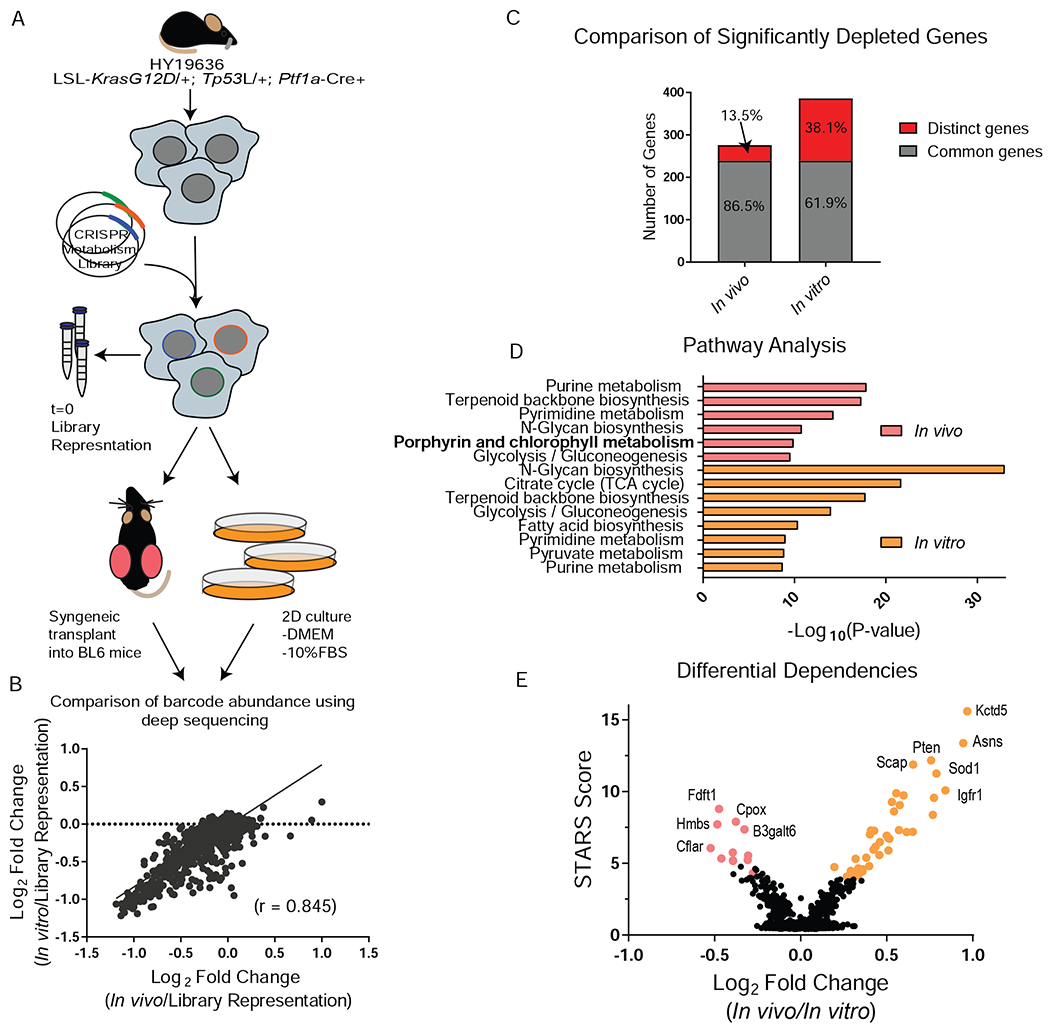
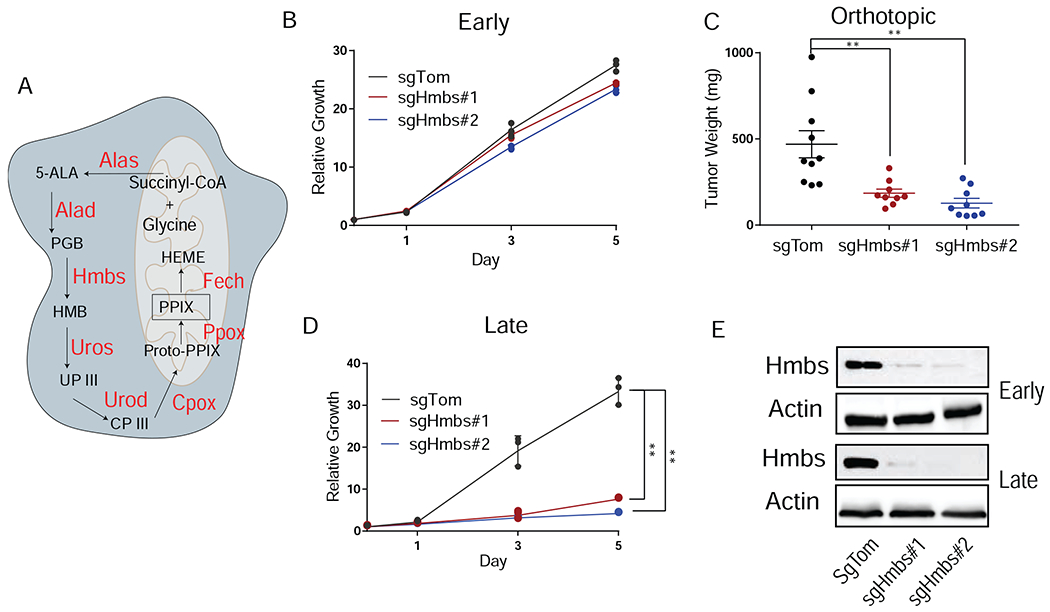
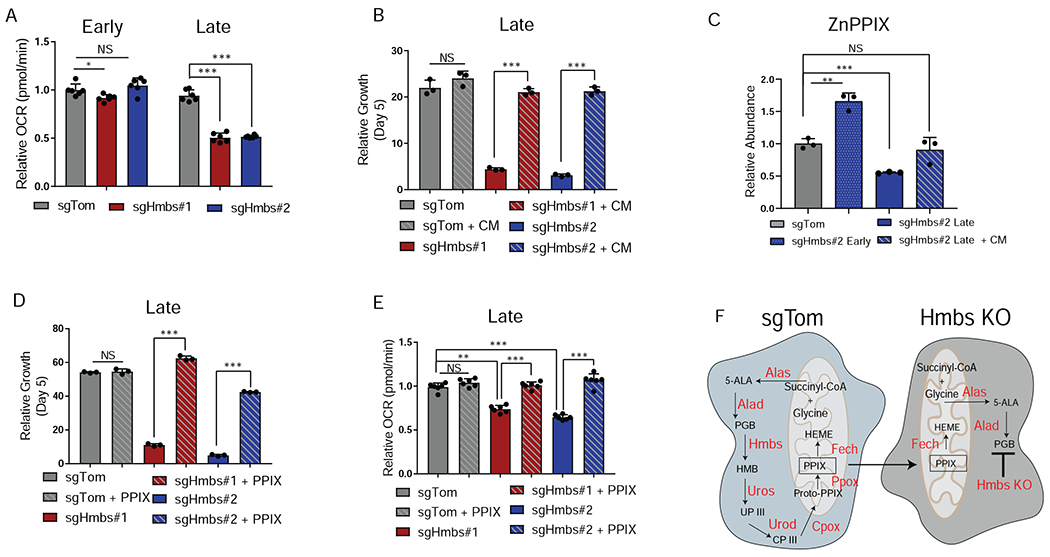
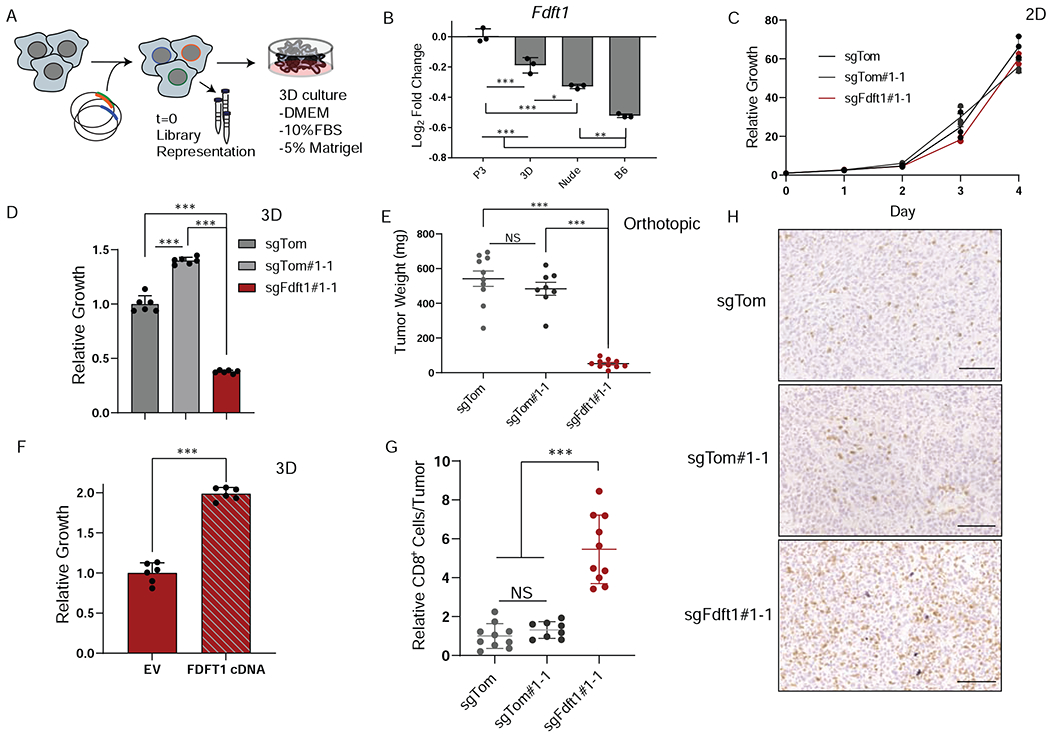
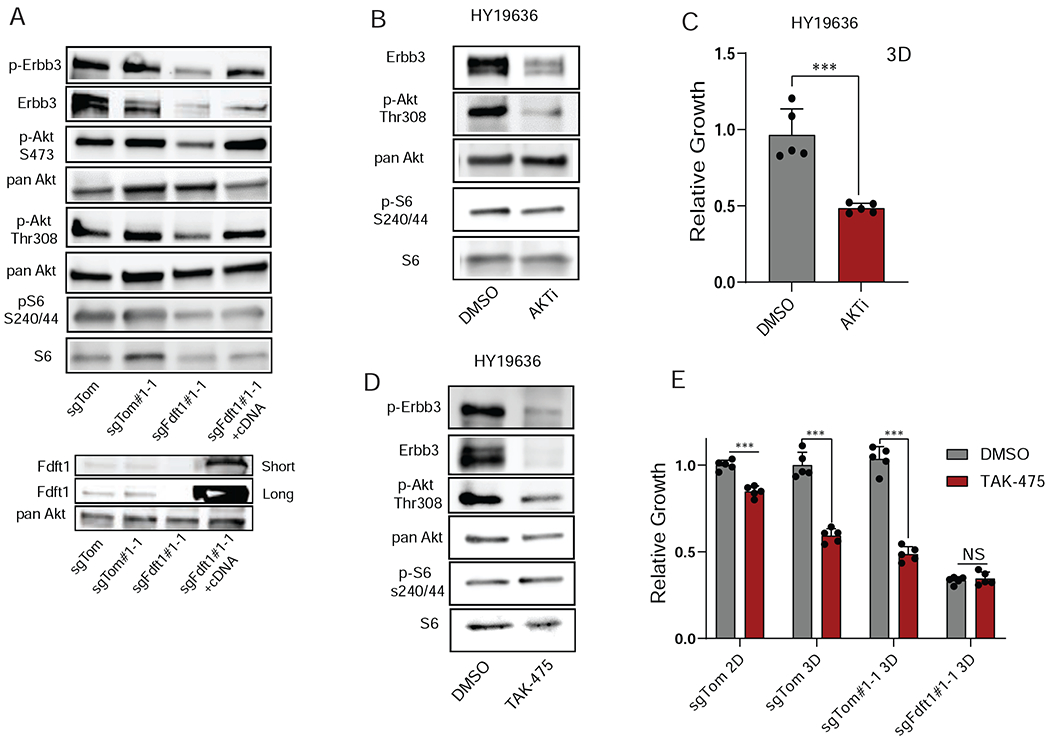
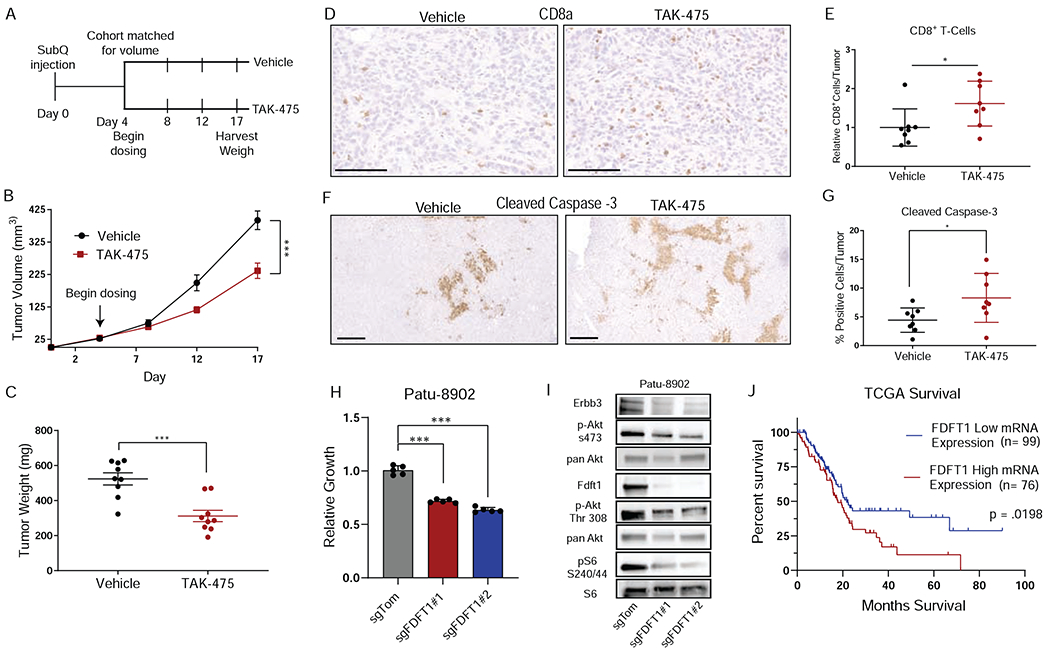
Pancreatic ductal adenocarcinoma (PDA) is a deadly cancer characterized by complex metabolic adaptations that promote survival in a severely hypoxic and nutrient-limited tumor microenvironment (TME). Modeling microenvironmental influences in cell culture has been challenging, and technical limitations have hampered the comprehensive study of tumor-specific metabolism in vivo. To systematically interrogate metabolic vulnerabilities in PDA, we employed parallel CRISPR-Cas9 screens using in vivo and in vitro systems. This work revealed striking overlap of in vivo metabolic dependencies with those in vitro. Moreover, we identified that intercellular nutrient sharing can mask dependencies in pooled screens, highlighting a limitation of this approach to study tumor metabolism. Furthermore, metabolic dependencies were similar between 2D and 3D culture, although 3D culture may better model vulnerabilities that influence certain oncogenic signaling pathways. Lastly, our work demonstrates the power of genetic screening approaches to define in vivo metabolic dependencies and pathways that may have therapeutic utility.

Keywords: cancer cell signaling; metabolism; nutrient crosstalk; pancreatic cancer; tumor microenvironment.


Conflict of interest statement

Declaration of Interests A.C.K. has financial interests in Vescor Therapeutics, LLC. A.C.K. is an inventor on patents pertaining to KRAS-regulated metabolic pathways, redox control pathways in pancreatic cancer, targeting GOT1 as a therapeutic approach, and the autophagic control of iron metabolism. A.C.K. is on the SAB of Rafael/Cornerstone Pharmaceuticals. A.C.K. is a consultant for Deciphera. R.T.M. consults for Bristol-Myers Squibb. A.J.A. has consulted for Oncorus, Inc.; Arrakis Therapeutics; and Merck & Co., Inc, and has research funding from Mirati Therapeutics and Deerfield, Inc. that are unrelated to this project. The other authors declare no competing interests.

Figures

Figure 1.
Figure 1.. Parallel CRISPR-Cas9 metabolism screens reveal metabolic dependencies in PDA.
A, Schematic of parallel CRISPR/Cas9 screen design using a B6 KPC line. B, Gene score correlation between in vitro (passage 7, P7) and in vivo. C, Comparison of significantly depleted genes (FDR < 0.2) in the in vitro (P7) and in vivo screen. FDR is calculated using STARS algorithm. D, Pathway analysis of significantly depleted genes (FDR < 0.2) using Metaboanalyst. The –Log10 p-value of the most enriched pathways (FDR < 0.005) are represented. E, Differential dependencies are plotted by looking at the delta log fold change between in vivo and in vitro (P7) conditions. STARS score is plotted on the y axis and differentially required genes with an FDR < 0.02 are colored.
Figure 2.
Figure 2.. Validation of heme biosynthetic screening hits
A, Schematic of heme biosynthesis. B, Relative proliferation rates of sgTom and sgHmbs cells performed immediately following transduction and selection (early passage) in 2D culture. Data are plotted as relative cell proliferation normalized to day 0 in arbitrary units. Error bars depict ± (s.d.) of three independent wells from a representative experiment. C, Tumor weight after orthotopic implantation of early passage sgTom (n = 10) and sgHmbs (KO#1 n = 9, KO#2 n = 9) cells into the pancreas of B6 mice harvested at endpoint. Error bars depict ± (s.e.m) of individual tumor weights. D, Relative proliferation rates of sgTom and sgHmbs cells that were cultured for greater than 10 days (late passage) after transduction and selection. Data are plotted as in B. Error bars depict ± s.d. of three independent wells from a representative experiment. E, Western blot of sgTom and sgHmbs cell lysates collected from early or late passage cells for Hmbs and Actin. For all panels, significance determined with an unpaired 2 tailed t-test. *P<0.05, **P<0.01, ***P<0.001, ns: non-significant, P>0.05.
Figure 3.
Figure 3.. Metabolic crosstalk masks the necessity for heme biosynthesis
A, Oxygen consumption rates (OCR) of early passage (immediately after selection) or late passage (> 10 days in culture) cells. Data are plotted as relative OCR to sgTom early passage. Error bars depict ± s.d of 6 individual wells from a representative experiment. B, Relative growth of late passage sgTom and sgHmbs cells assessed at day 5 after seeding and grown in 2D culture. Cells were treated with either fresh media or conditioned media (CM) from sgTom cells. Error bars depict ± s.d. of three independent wells from a representative experiment. C, ZnPPIX abundance in sgTom cells, early passage sgHmbs cells, late passage sgHmbs cells, or late passage sgHmbs cells treated with CM in 2D culture. Data are plotted as relative abundance to sgTom cells. Error bars depict ± s.d. of three independent samples. D, Relative growth of late passage sgTom and late sgHmbs cells assessed at day 5 after seeding and grown in 2D culture. Cells were either treated DMSO or PPIX. Error bars depict ± s.d. of three independent wells from a representative experiment. E, Relative OCR of sgTom and late passage sgHmbs cells treated with either DMSO or PPIX. Data are plotted as relative OCR to DMSO treated sgTom samples. Error bars depict ± s.d of 6 individual wells from a representative experiment. F, Schematic depicting how cells proficient in heme biosynthesis (sgTom) can support cells with perturbed heme synthesis (Hmbs KO). For all panels, significance determined with an unpaired 2 tailed t-test. *P<0.05, **P<0.01, ***P<0.001, ns: non-significant, P>0.05.
Figure 4.
Figure 4.. Three-dimensional culture reveals differential dependency on Fdft1
A, Schematic depicting experimental design for 3D metabolism screen. B, Log fold change of Fdft1 is plotted for P3, 3D, Nude, and B6 experimental conditions. Error bars depict ± s.d. of experimental condition (screens performed in triplicate). C, Relative proliferation rates of sgTom (polyclonal), sgTom#1-1 (clone), and sgFdft1#1-1 (clone) cells grown in 2D culture. Data are plotted as relative cell proliferation normalized to day 0 in arbitrary units. Error bars depict ± s.d. of three independent wells from a representative experiment.. D, Relative growth of sgTom (polyclonal), sgTom#1-1 (clone), and sgFdft1#1-1 (clone) cells grown in 3D culture and assessed by cell titer-glo (CTG). Data are plotted as relative luminescent signal to sgTom. Error bars depict ± s.d. of 6 independent wells from a representative experiment. E, Tumor weight after orthotopic implantation of sgTom (polyclonal) (n = 10), sgTom#1-1 (clone) (n = 8), and sgFdft1#1-1 (clone) (n = 10) cells into the pancreata of B6 mice harvested at endpoint. Error bars depict ± s.e.m of individual tumor weights. F, Relative growth of sgFdft1#1-1+ empty vector (EV) and sgFdft1#1-1 + human FDFT1 cDNA (FDFT1 cDNA) cells grown in 3D and assessed by cell titer-glo (CTG). Data are plotted as relative luminescent signal to sgFdft1#1-1 + EV. Error bars depict ± s.d. of 5 independent wells from a representative experiment G, Quantification of CD8a positive cells in either sgTom (polyclonal), sgTom#1-1 (clone), and sgFdft1#1-1 (clone) orthotopic tumors injected into the pancreata of B6 mice. Error bars depict ± s.d. of 10 independent tumors (sgTom), 8 independent tumors (sgTom#1-1) and 10 independent tumors (sgFdft1#1-1). F, Representative images of IHC for CD8a cells performed on sgTom (polyclonal), (n = 10), sgTom#1-1 (clone) (n = 8), and sgFdft1#1-1 (clone) (n = 10) orthotopic tumors. Scale bar represents 100μm. For all panels, significance determined with an unpaired 2 tailed t-test. *P<0.05, **P<0.01, ***P<0.001, ns: non-significant, P>0.05.
Figure 5.
Figure 5.. Fdft1 potentiates Akt signaling in PDA cells
A, Western blot of sgTom (polyclonal), sgTom#1-1 (clone), sgFdft1#1-1 (clone), sgFdft1#1-1 + FDFT1 cDNA (rescue clone) cell lysates for p-Erbb3, Erbb3, p-Akt S473, pan Akt, p-Akt Thr 308, pS6 S240/44, S6, and Fdft1 in 3D conditions. B, Western blot of HY19636 cells treated with either DMSO or 1μM AKTi (MK-2206) in 3D conditions. Cell lysates were probed for Erbb3, p-Akt Thr308, pan Akt, p-S6 S240/44, and S6. C, Relative growth of HY19636 cells treated with either DmSo or 1μM AKTi (MK-2206). Growth was assessed by cell titer-glo (CTG). Data are plotted as relative luminescent signal to DMSO. Error bars depict ± s.d. of 5 independent wells from a representative experiment. D, Western blotting of HY19636 cells treated with either DMSO or 5μM TAK-475 in 3D conditions. Cell lysates were probed for p-Erbb3, Erbb3, p-Akt Thr 308, pan Akt, p-S6 S240/44, and S6. E, Relative growth of sgTom (polyclonal), sgTom#1-1 (clone), sgFdft1#1-1 (clone) cells treated with either DMSO or TAK-475 in 2D (sgTom) and 3D (sgTom, sgTom#1-1, sgFdft1#1-1) culture. Data are plotted as relative absorbance or luminescent signal to sgTom for 2D and 3D conditions respectively. Error bars depict ± s.d.of 3 (2D) or 5 (3D) independent wells from a representative experiment. For all panels, significance determined with an unpaired 2 tailed t-test. *P<0.05, **P<0.01, ***P<0.001, ns: non-significant, P>0.05.
Figure 6.
Figure 6.. Fdft1 inhibition decreases PDA tumor growth
A, Schematic depicting experimental design for treating mice with Fdft1 inhibitor TAK-475. B, Tumor volume of either vehicle treated (n = 9) or TAK-475 treated (n = 9) mice at the indicated time points. Error bars depict ± s.e.m of individually measured tumors. C, Tumor weight harvested at endpoint of panel B (day 17) of either vehicle or TAK-475 treated tumors. Error bars depict ± s.e.m of individually weighed tumors. D, Representative images of Immunohistochemistry (IHC) performed on vehicle treated (n = 8) and TAK-475 treated (n = 8) tumors for intratumoral CD8a positive cells. Scale bar represents 100μm. E, Quantification of positive CD8a positive cells in either vehicle or TAK-475 treated tumors as in panel d. Error bars depict ± s.d. of 8 independent tumors. F, Representative images of IHC performed on vehicle (n = 8) and TAK-475 (n = 8) treated tumors for cleaved caspase-3 positive cells. Scale bar represents 500μm. G, Quantification of positive cleaved caspase-3 positive cells in either vehicle or TAK-475 treated as in panel d. Error bars depict ±s.d. of 8 independent tumors. H, Relative growth of human PDA cells Patu-8902 transduced with either sgTom or sgFdft1 and grown in 3D culture and assessed by cell titer-glo (CTG). Data are plotted as relative luminescent signal to sgTom. Error bars depict ± s.d. of 5 independent wells from a representative experiment. I, Western blot of sgTom, sgFdft1#1, and sgFdft1#2 in Patu-8902cell lysates for p-Erbb3, Erbb3, p-Akt S473, pan Akt, p-Akt Thr 308, pS6 S240/44, S6, and Fdft1 in 3D conditions. J, Survival plot of human pancreatic cancer cases from the cancer genome atlas (TCGA). Tumors were stratified by mRNA expression of FDFT1 into either high (top 50% of expression, n = 76) or low expressing (bottom 50% of expression, n = 99) tumors. P-value is calculated by Log-rank (Mantel-Cox) test. For all panels (except panel J), significance determined with an unpaired 2 tailed t-test. *P<0.05, **P<0.01, ***P<0.001, ns: non-significant, P>0.05.

References

    1. Bardeesy N, Aguirre AJ, Chu GC, Cheng KH, Lopez LV, Hezel AF, Feng B, Brennan C, Weissleder R, Mahmood U, et al. (2006). Both p16(Ink4a) and the p19(Arf)-p53 pathway constrain progression of pancreatic adenocarcinoma in the mouse. Proceedings of the National Academy of Sciences of the United States of America 103, 5947–5952. - PMC - PubMed
    1. Biancur DE, and Kimmelman AC (2018). The plasticity of pancreatic cancer metabolism in tumor progression and therapeutic resistance. Biochimica et biophysica acta. - PMC - PubMed
    1. Biancur DE, Paulo JA, Małachowska B, Del Rey MQ, Sousa CM, Wang X, Sohn AS, Chu GC, Gygi SP, and Harper JW (2017a). Compensatory metabolic networks in pancreatic cancers upon perturbation of glutamine metabolism. Nature communications 8, 15965. - PMC - PubMed
    1. Biancur DE, Paulo JA, Malachowska B, Quiles Del Rey M, Sousa CM, Wang X, Sohn ASW, Chu GC, Gygi SP, Harper JW, et al. (2017b). Compensatory metabolic networks in pancreatic cancers upon perturbation of glutamine metabolism. Nature communications 8, 15965. - PMC - PubMed
    1. Cantor JR, Abu-Remaileh M, Kanarek N, Freinkman E, Gao X, Louissaint A Jr., Lewis CA, and Sabatini DM (2017). Physiologic Medium Rewires Cellular Metabolism and Reveals Uric Acid as an Endogenous Inhibitor of UMP Synthase. Cell 169, 258–272.e217. - PMC - PubMed

Publication types

MeSH terms