

Negative Binomial mixed models estimated with the maximum likelihood method can be used for longitudinal RNAseq data
- PMID: 33152752
- PMCID: PMC8293834
- DOI: 10.1093/bib/bbaa264
Negative Binomial mixed models estimated with the maximum likelihood method can be used for longitudinal RNAseq data
Abstract
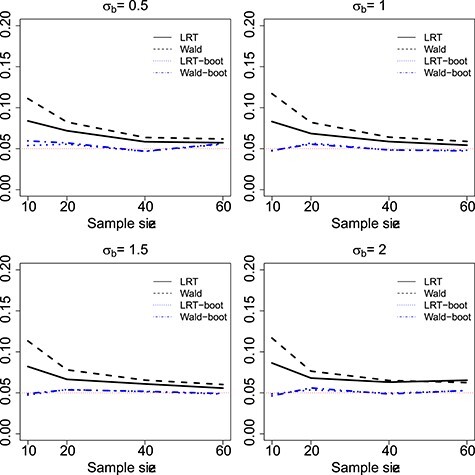
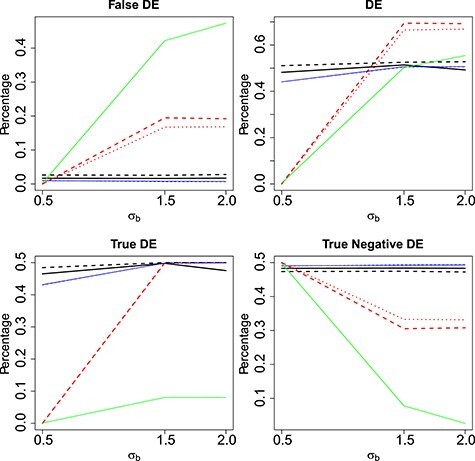
Time-course RNAseq experiments, where tissues are repeatedly collected from the same subjects, e.g. humans or animals over time or under several different experimental conditions, are becoming more popular due to the reducing sequencing costs. Such designs offer the great potential to identify genes that change over time or progress differently in time across experimental groups. Modelling of the longitudinal gene expression in such time-course RNAseq data is complicated by the serial correlations, missing values due to subject dropout or sequencing errors, long follow up with potentially non-linear progression in time and low number of subjects. Negative Binomial mixed models can address all these issues. However, such models under the maximum likelihood (ML) approach are less popular for RNAseq data due to convergence issues (see, e.g. [1]). We argue in this paper that it is the use of an inaccurate numerical integration method in combination with the typically small sample sizes which causes such mixed models to fail for a great portion of tested genes. We show that when we use the accurate adaptive Gaussian quadrature approach to approximate the integrals over the random-effects terms, we can successfully estimate the model parameters with the maximum likelihood method. Moreover, we show that the boostrap method can be used to preserve the type I error rate in small sample settings. We evaluate empirically the small sample properties of the test statistics and compare with state-of-the-art approaches. The method is applied on a longitudinal mice experiment to study the dynamics in Duchenne Muscular Dystrophy. Contact:s.tsonaka@lumc.nl Roula Tsonaka is an assistant professor at the Medical Statistics, Department of Biomedical Data Sciences, Leiden University Medical Center. Her research focuses on statistical methods for longitudinal omics data. Pietro Spitali is an assistant professor at the Department of Human Genetics, Leiden University Medical Center. His research focuses on the identification of biomarkers for neuromuscular disorders.
Keywords: Adaptive Gaussian quadrature integration; Bootstrap; Negative Binomial mixed effects model; Random effects models.
© The Author(s) 2020. Published by Oxford University Press.
Figures
References
-
- Cui S, Ji T, Li J, et al. . What if we ignore the random effects when analyzing RNA-seq data in a multifactor experiment. Stat Appl Genet Mol Biol 2016; 15:87–105. - PubMed
-
- Fitzmaurice GM, Laird NM, Ware JH. Applied Longitudinal Analysis. Hoboken, NJ: Wiley-Interscience, 2004.
Publication types
MeSH terms
LinkOut - more resources
Full Text Sources
Molecular Biology Databases
